


0
US Dollar Index
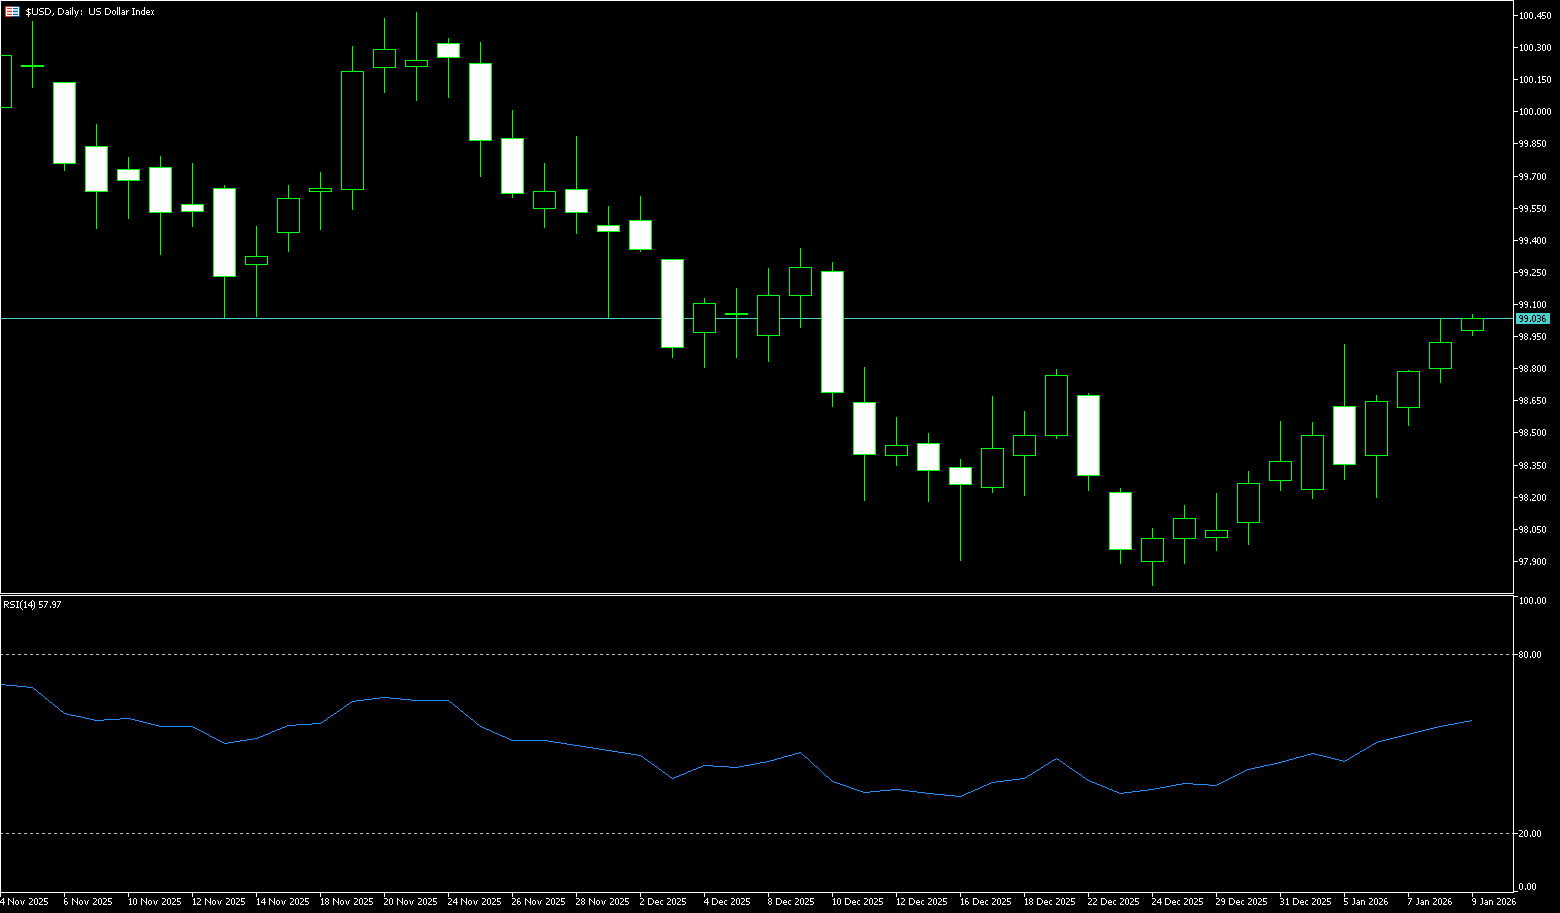
The US dollar index hovered around 99.10 on Wednesday, near its highest level since early December, as the latest inflation data had little impact on the short-term outlook for Federal Reserve policy. Data released on Tuesday showed that the US CPI was largely in line with expectations, reinforcing the view that the Fed might keep policy unchanged later this month. However, underlying price pressures showed signs of easing, with core inflation at 0.2% for the month, below the expected 0.3%. The dollar also shrugged off concerns about the Fed's independence after the US Department of Justice threatened criminal charges against Fed Chairman Jerome Powell. Supportive statements from other major central bank governors and Wall Street bank CEOs for Powell helped calm the markets. Investors are now turning their attention to Wednesday's US PPI and retail sales reports for more clues about the economic trajectory.
From a technical perspective, the trend is upward according to the oscillator chart. The US dollar index is currently above the 200-day moving average of 98.73 and the 50-day moving average of 98.97, providing additional support for trend indicators. The 200-day moving average at 98.73 is a key medium- to long-term support level that may hinder a bullish breakout. Secondly, the 25-day moving average at 98.44 is a key level to watch. Technically, the MACD has turned positive, indicating that downward momentum is weakening and bullish forces are beginning to recover. The RSI (14) is around 61, in a neutral-to-strong range, suggesting that the market is still in a stalemate between bulls and bears, and a one-sided market is unlikely in the short term. On the upside, if the US dollar index breaks through, it may rise back to 99.32 (the high of December 9th last year), and the next level could trigger further acceleration to 99.82 (the high of November 28th last year).
Today, consider shorting the US Dollar Index around 99.20; Stop loss: 99.30; Target: 98.80; 98.75
WTI Crude Oil
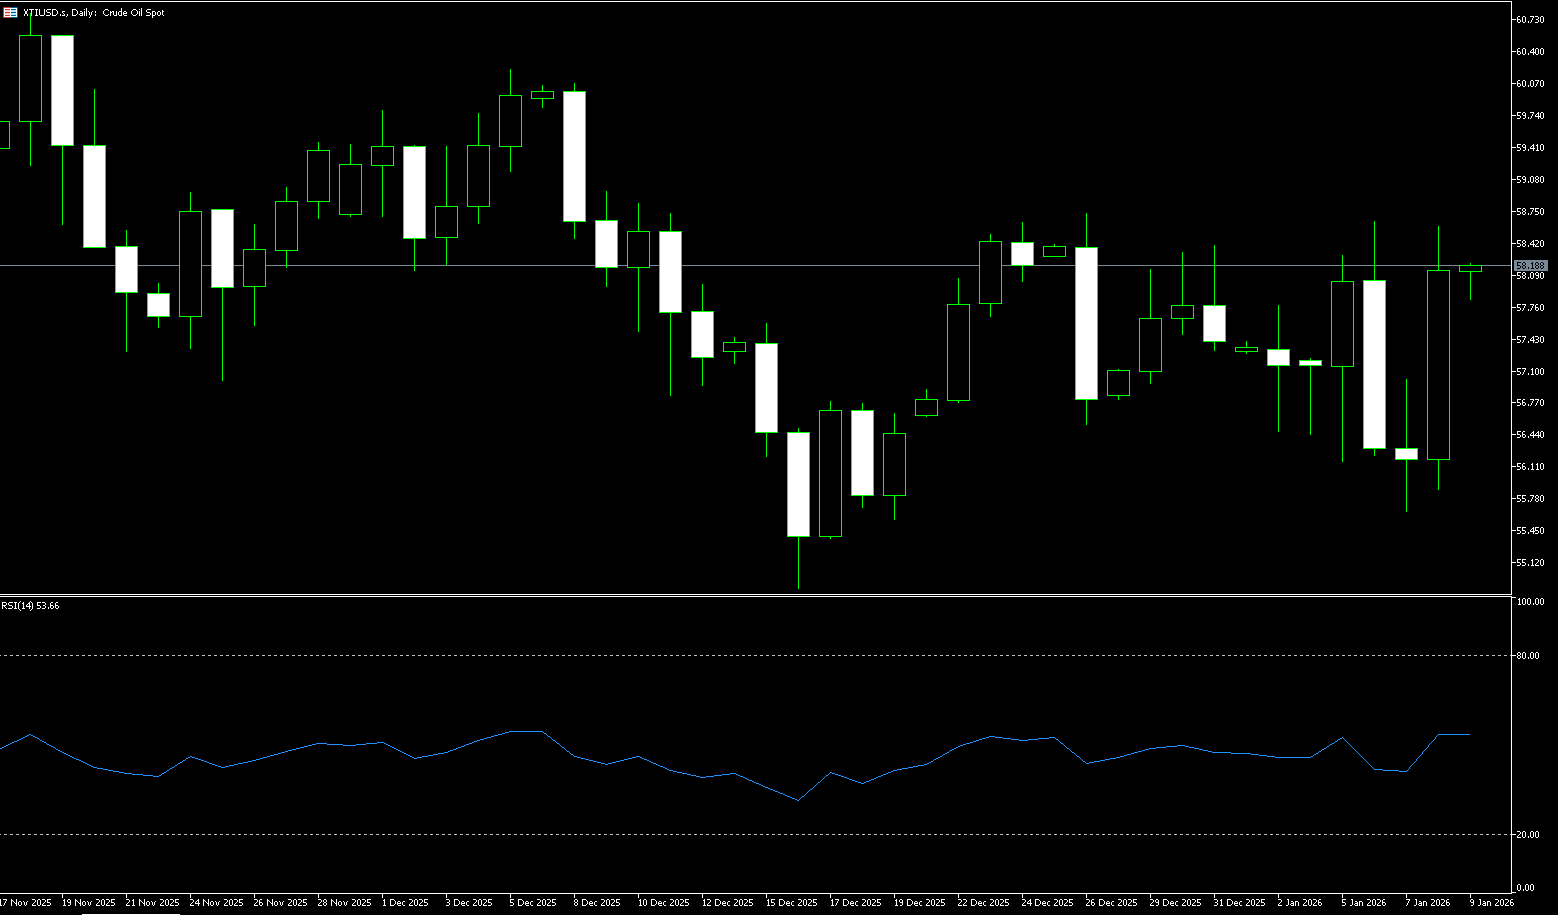
WTI crude oil hovered around $60.30 per barrel on Wednesday, near a 12-week high, as investors awaited comments from US officials on Iran ahead of a White House meeting. This comes after President Trump decided to cancel talks with Iranian officials until protests subside, while expressing support for the demonstrators. The unrest in Iran and the risk of US intervention could threaten the country's approximately 3.3 million barrels per day of oil production. Trump also warned that countries doing business with Iran would face new 25% tariffs, exacerbating concerns about supply disruptions. Meanwhile, attacks on two oil tankers near the Union Black Sea terminal of the Caspian Pipeline disrupted Kazakhstan's crude oil exports, exacerbating delays caused by severe winter weather and damaged berths.
The current WTI holding above $60 reflects more of a return to geopolitical risk premiums than a fundamental improvement in supply and demand fundamentals. From a daily chart technical perspective, oil prices may still have some upward momentum in the short term, but the risk-reward ratio for going long is decreasing near key resistance levels. Looking at the daily chart, WTI has recently experienced a significant rebound, with prices consistently rising above the 5-day and 10-day moving averages. The short-term moving averages are showing an upward divergence, indicating that bullish momentum remains dominant. Currently, oil prices have returned above the $60 mark, which is also the upper edge of the previous trading range. In terms of resistance levels, the $61.50-$62.00 range is a dense area of highs from the past two months and a key resistance level from the previous downtrend. If this level cannot be effectively broken, oil prices may fall back into the range. Support is seen around $59.00; a break below this level could destroy the short-term rebound structure and retest the $57.50 support level.
Today, consider going long on spot crude oil around 60.08; Stop loss: 59.90; Target: 61.80; 61.50
Spot Gold
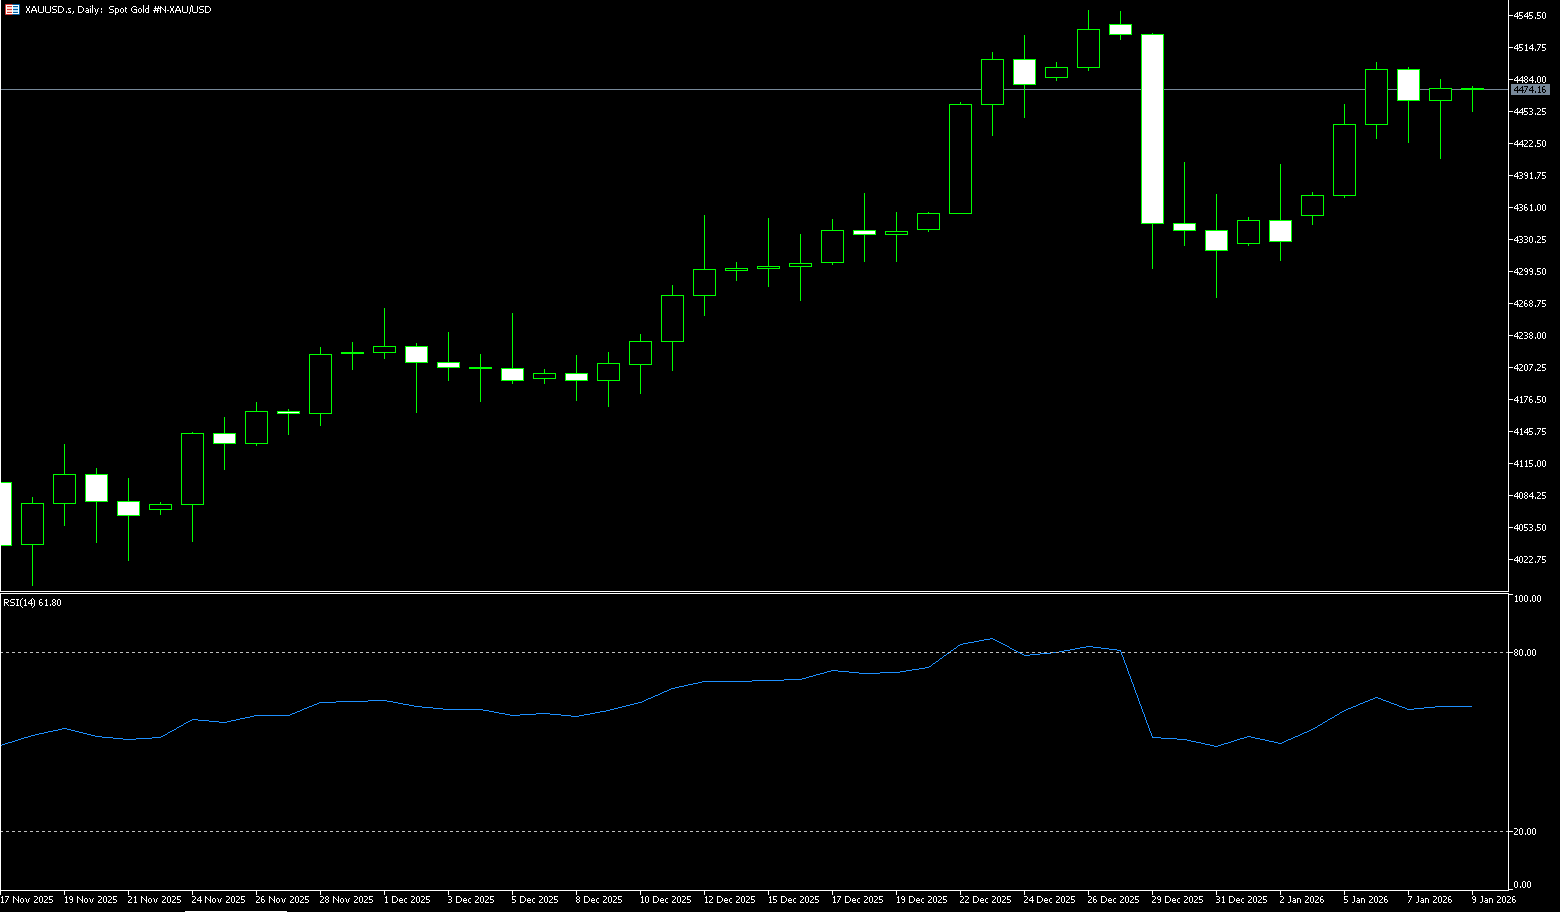
Gold prices rose to around $4,643 per ounce on Wednesday, a new record high, supported by increased bets on a US interest rate cut and increased safe-haven demand. December data showed a slowdown in US underlying inflation, reinforcing the view that price pressures are gradually easing and providing a clearer picture after previous data was distorted by the temporary shutdown effect. In response, interest rate futures showed investors' expectations for two or three Fed rate cuts this year diverging, exceeding the median of only one expected by policymakers. Meanwhile, concerns about the Fed's independence have intensified again after US prosecutors launched a criminal investigation into Chairman Powell's June testimony. Geopolitical risks remain high, with markets closely watching the potential risk of US intervention in Iran's political turmoil, following multiple warnings of possible military action.
On the 4-hour chart, the 21-period simple moving average has crossed above the 50-period simple moving average, and both are sloping upwards, reinforcing the current uptrend. Price action remains easily above key moving averages, with the 21-period simple moving average at approximately $4,558 forming the first layer of dynamic support, followed by the 50-period simple moving average at approximately $4,485. Momentum indicators remain positive. The MACD remains above the signal line in positive territory, and the slightly widening histogram suggests strong bullish momentum. Meanwhile, the RSI indicator is at 67.60, having turned down from overbought territory, suggesting the rally may pause or consolidate in the short term. However, any pullback is likely to be viewed as a correction rather than a trend reversal, and the overall technical picture remains bullish. Therefore, there are no significant resistance levels to the upside, naturally bringing the next round number targets of $4,650, $4,700, and $4,750 into view. These areas may attract Fibonacci traders to take profits.
Today, consider going long on spot gold around 4,618; Stop loss: 4,614; Target: 4,645; 4,650
AUD/USD
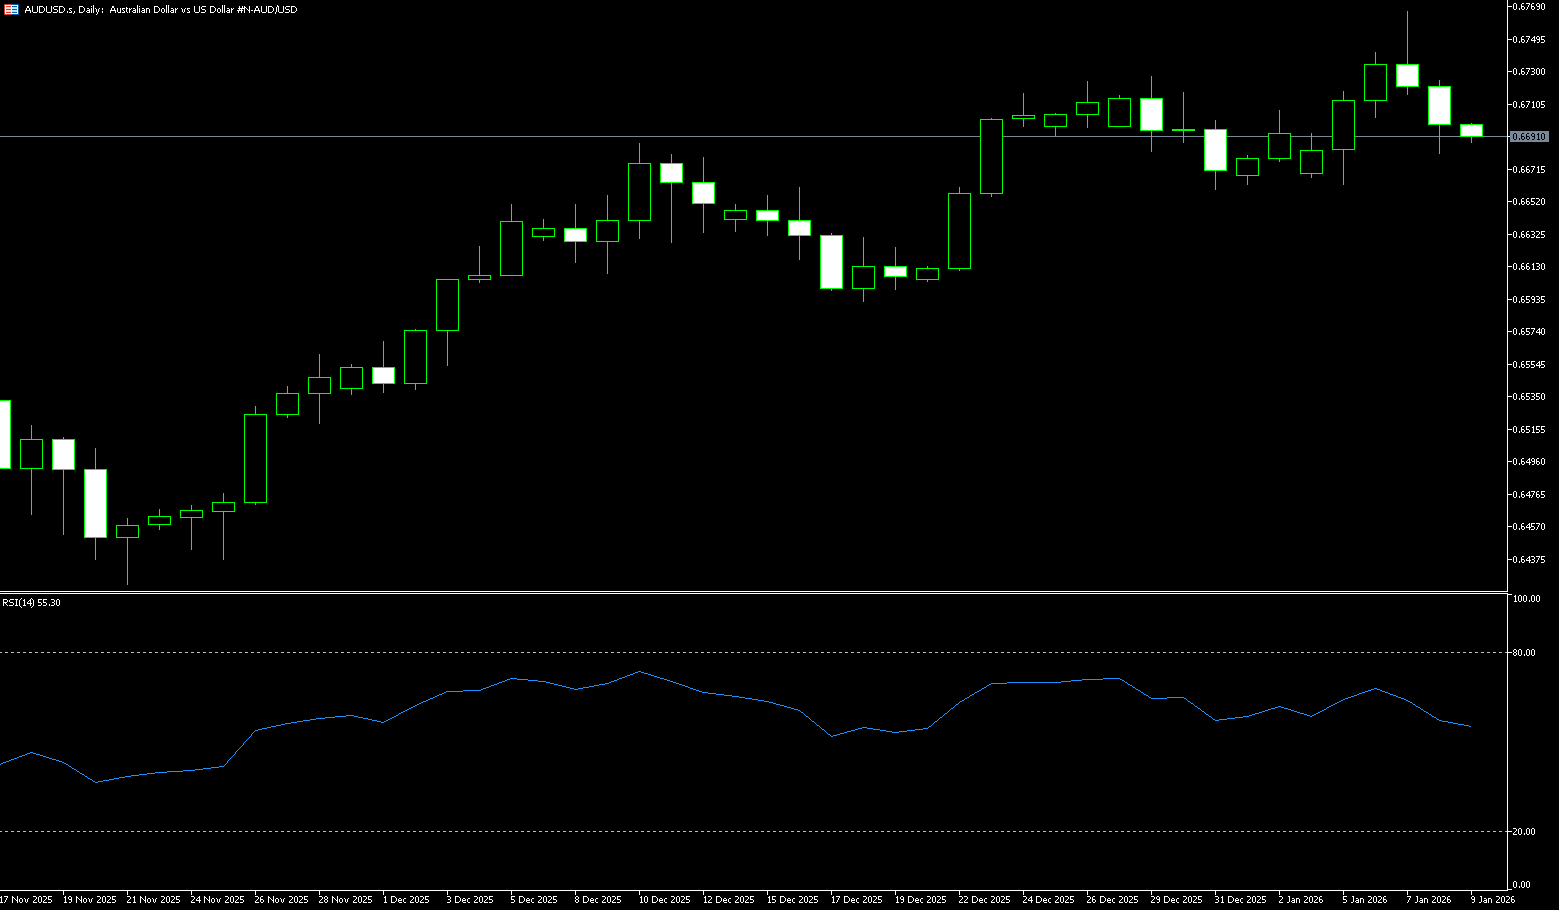
The Australian dollar is trading around US$0.6685, near a two-week low, as investors continue to assess the possibility of a February rate hike. The probability of the Reserve Bank of Australia (RBA) raising the cash rate by 0.25 percentage points next month remains around 27%, down from nearly 40% last week, although the market expects a 76% probability of a rate hike in May. A slight pullback in November inflation and a decline in consumer confidence this month have made the prospect of a February rate hike uncertain, suggesting the RBA may pause. A 0.2% decline in quarterly job vacancies in November also indicates stable labor demand. However, strong household spending in November could push inflation higher and support expectations of a tighter monetary policy. The RBA's next move now largely depends on the upcoming fourth-quarter CPI data; if the core data is higher than expected, it could increase pressure for an earlier rate hike. The market is also watching next week's December employment report for additional guidance on monetary policy.
The daily chart shows that the AUD/USD pair immediately faces downside against the weekly low of 0.6659 (December 31st), while a deeper pullback could move the price towards the 0.6660-0.6632 range, which coincides with the 9-day and 40-day simple moving averages. Below that lies the key psychological level of 0.6600, followed by 0.6585 (the 100-day simple moving average). If the bulls regain control, the spot pair could challenge 0.6725 (the high of December 26th last year), followed by the 2026 upper limit of 0.6766 (January 7th), and then 0.6800 (the psychological level), all before the 0.7000 benchmark. Furthermore, momentum indicators still support further upside, despite some warning signs: the Relative Strength Index (RSI) has fallen back to the 55 area, while the Average Directional Index (ADX) is near 30, continuing to show a strong trend.
Consider going long on the Australian dollar around 0.6673 today; Stop loss: 0.6660; Target: 0.6720; 0.6730
GBP/USD
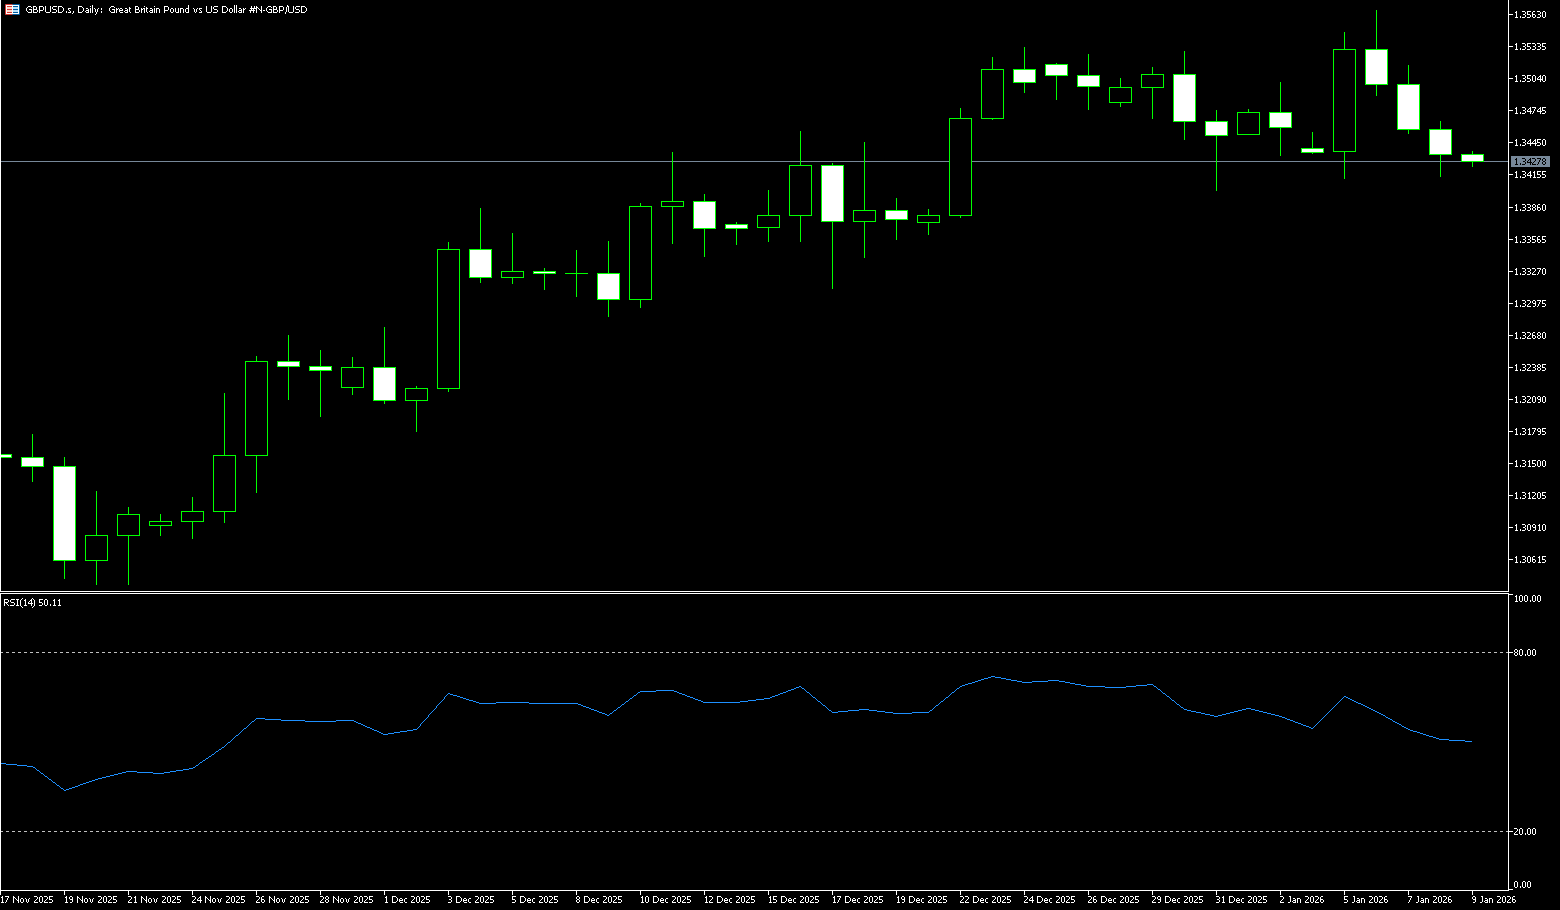
The GBP/USD pair traded around 1.3440 during Wednesday's Asian trading session, pressured by renewed demand for the US dollar. According to Tuesday's report from the US Bureau of Labor Statistics, the US Consumer Price Index rose 2.7% year-on-year in December, consistent with November's increase. This data was in line with market consensus. Concerns about the Federal Reserve's independence could weigh on the dollar. Fed Chairman Powell stated on Sunday that the Fed had received subpoenas from the Justice Department regarding his statements to Congress last summer about cost overruns in the central bank's $2.5 billion renovation project in Washington. Powell called these threats "pretexts" aimed at pressuring the Fed to cut interest rates. However, the Bank of England's dovish stance could weaken the pound against the dollar; the Bank of England is expected to keep interest rates unchanged in February, with the next 0.25% rate cut most likely occurring in March or April.
During the recent upward trend, 1.3485 has initially emerged as a short-term resistance zone, while the more crucial resistance lies at the 1.3500 psychological level. If the exchange rate can effectively hold above 1.3500 and maintain its position without breaking through on pullbacks, it is expected to further challenge the annual high of 1.3567 in the short term; conversely, if it is repeatedly blocked at this level, it may return to a range-bound trading pattern. Technical indicators show that the current momentum is recovering. Although the bullish force of the MACD has strengthened, it is still in its early stages. The RSI (14) is running at 52.61, which is in the neutral to strong zone, indicating that buyers have a slight advantage, but it has not yet entered an overbought state. On the other hand, a corrective pullback may occur in the short term, once the currency pair breaks below the psychological level of 1.3400 and the 200-day simple moving average of 1.3402. Any further decline to 1.3359 {220-day simple moving average} could be considered a buying opportunity.
Consider going long on GBP/USD around 1.3425 today; Stop loss: 1.3415; Target: 1.3470; 1.3480
USD/JPY
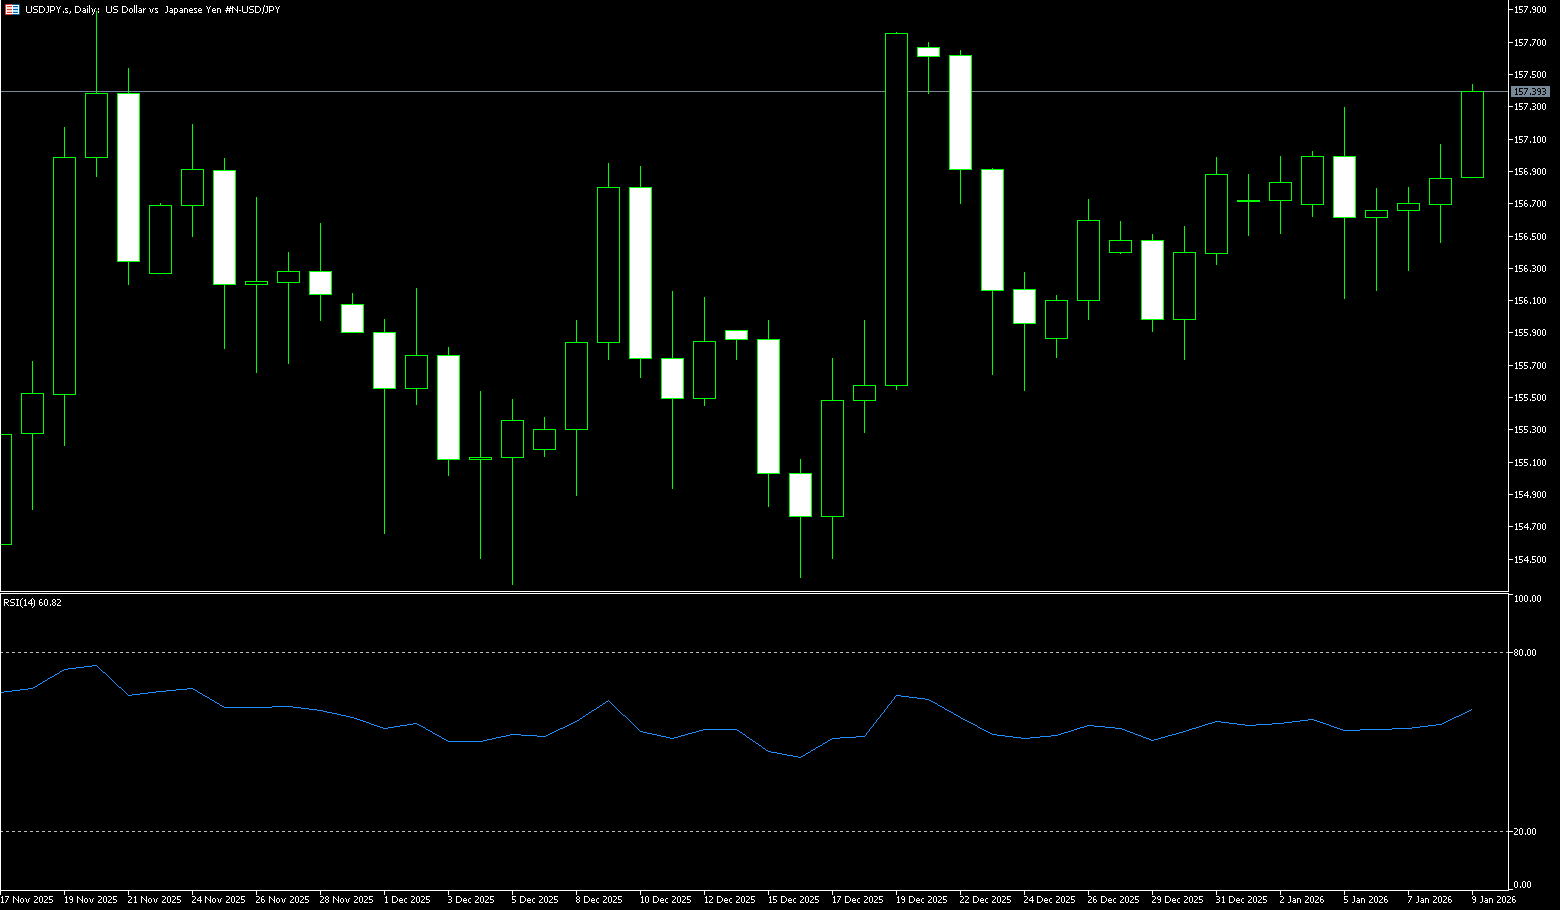
The yen rebounded to around 158.50 yen per dollar on Wednesday, after earlier hitting a low of 159.45 since July 2024 and approaching the key psychological threshold of 160, following intervention by local authorities. This decline was fueled by rumors that Prime Minister Sanae Takashi might call a snap election next month to consolidate power and push forward with expansionary fiscal policies, with reports suggesting a possible lower house election on February 8. On the economic front, a private survey showed that manufacturing activity has slowed due to trade frictions, while the service sector faces tourism-related disruptions, limiting the Bank of Japan's ability to pursue interest rate hikes. Meanwhile, Japanese Finance Minister Satsuki Katayama noted earlier this week that she and US Treasury Secretary Scott Bessenter held a bilateral meeting on the sidelines of a multilateral finance ministers' meeting, expressing concern about the yen's "unilateral depreciation."
The daily chart shows the 5-day simple moving average (SMA) at 158.26 continuing its upward trend, with USD/JPY holding above it, reinforcing a strong bullish bias and providing dynamic support for buyers. The Moving Average Convergence Divergence (MACD) indicator shows a bullish crossover near the zero line, with the histogram turning positive, indicating improved momentum. The Relative Strength Index (RSI) is at 70.47, indicating overbought conditions but still strong momentum, supporting further upside. As long as USD/JPY remains above the rising 5-day SMA, pullbacks will be limited, and the pair could rise further to 159.50 and challenge the psychological level of 160. A close below the moving average could suggest weakening momentum and a consolidation phase towards 158.00 (the psychological level) and 157.48 (the 9-day SMA).
Consider shorting the US dollar around 158.70 today; Stop loss: 158.90; Target: 157.80, 157.60
EUR/USD
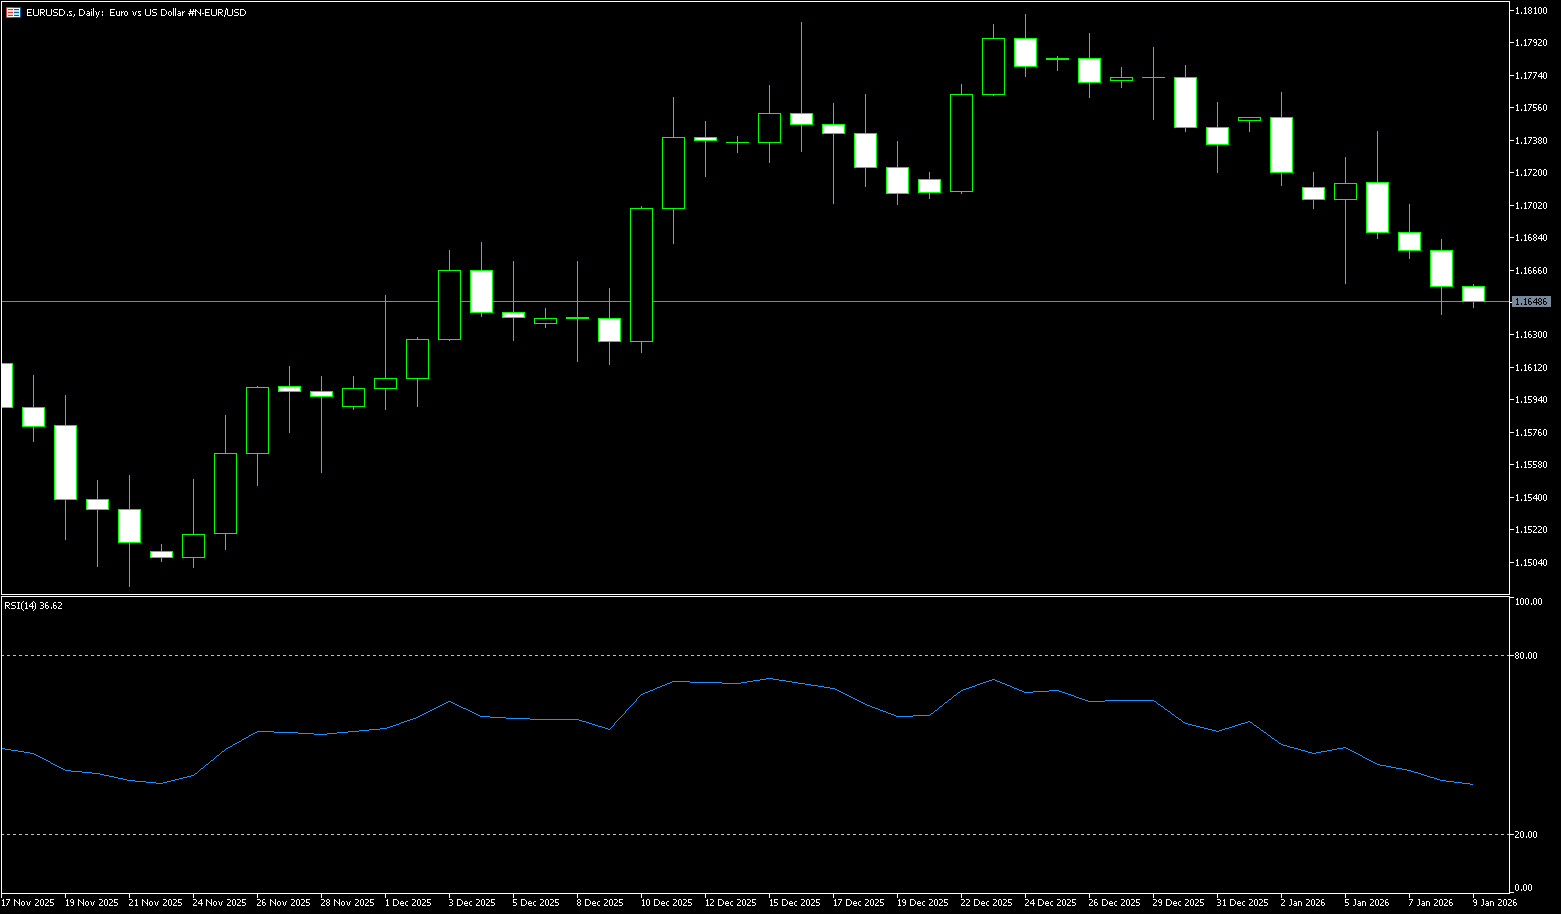
On Tuesday, EUR/USD remained stable around 1.1640. Traders digested news that the Trump administration had threatened to sue the Federal Reserve, after Fed Chairman Powell stated on Sunday that he was facing a criminal investigation. Political risks surrounding the US central bank could put pressure on the dollar and create tailwinds for the pair. The open war between the Fed and the US government is clearly not a good sign for the dollar. Signs that the European Central Bank seems to be nearing the end of its rate-cutting cycle could provide some support for the euro. ECB Vice President Louis de Guindos stated last week that interest rates were at an appropriate level, but warned of “significant uncertainty” due to geopolitical risks. Financial markets currently have limited room for immediate action, and rates are expected to remain unchanged at the next meeting, although a rate hike is considered unlikely given the weak inflation backdrop.
From a technical perspective, the EUR/USD pair retreated after reaching a high of 1.1807 on the daily chart, hitting a low of 1.1617 before rebounding. Strong resistance lies at 1.1750; a hold above this level could lead to a retest of previous highs. Support is seen at last week's low of 1.1617; a break below this level could lead to a return to lower levels. The MACD indicator shows a DIFF of 0.0002, a DEA of 0.0018, and a histogram of -0.0032, indicating that downward momentum has not completely subsided. The RSI is around 42.37, in a slightly bearish zone, suggesting a higher probability of range-bound trading in the short term. The first support level for EUR/USD is 1.1600 (a psychological level). A break below this level would expose the 200-day simple moving average support at 1.1578, which is the last line of defense for the bulls, after which the pair would turn bearish. Additionally, if the price breaks through the psychological level of 1.1700, the next resistance level is 1.1762 (this year's high).
Today, consider going long on the Euro around 1.1632; Stop loss: 1.1620; Target: 1.1680, 1.1685
Disclaimer: The information contained herein (1) is proprietary to BCR and/or its content providers; (2) may not be copied or distributed; (3) is not warranted to be accurate, complete or timely; and, (4) does not constitute advice or a recommendation by BCR or its content providers in respect of the investment in financial instruments. Neither BCR or its content providers are responsible for any damages or losses arising from any use of this information. Past performance is no guarantee of future results.
Lebih Liputan


Pendedahan Risiko:Instrumen derivatif diniagakan di luar bursa dengan margin, yang bermakna ia membawa tahap risiko yang tinggi dan terdapat kemungkinan anda boleh kehilangan seluruh pelaburan anda. Produk-produk ini tidak sesuai untuk semua pelabur. Pastikan anda memahami sepenuhnya risiko dan pertimbangkan dengan teliti keadaan kewangan dan pengalaman dagangan anda sebelum berdagang. Cari nasihat kewangan bebas jika perlu sebelum membuka akaun dengan BCR.
BCR Co Pty Ltd (No. Syarikat 1975046) ialah syarikat yang diperbadankan di bawah undang-undang British Virgin Islands, dengan pejabat berdaftar di Trident Chambers, Wickham’s Cay 1, Road Town, Tortola, British Virgin Islands, dan dilesenkan serta dikawal selia oleh Suruhanjaya Perkhidmatan Kewangan British Virgin Islands di bawah Lesen No. SIBA/L/19/1122.
Open Bridge Limited (No. Syarikat 16701394) ialah syarikat yang diperbadankan di bawah Akta Syarikat 2006 dan berdaftar di England dan Wales, dengan alamat berdaftar di Kemp House, 160 City Road, London, City Road, London, England, EC1V 2NX. Entiti ini bertindak semata-mata sebagai pemproses pembayaran dan tidak menyediakan sebarang perkhidmatan perdagangan atau pelaburan.

 English
 简体中文
简体中文
 繁體中文
繁體中文
 Bahasa
Melayu
Bahasa
Melayu
 Tiếng
Việt
Tiếng
Việt
 ไทย
ไทย
 日本語
日本語
 한국어
한국어
 ភាសាខ្មែរ
 español