


0
US Dollar Index
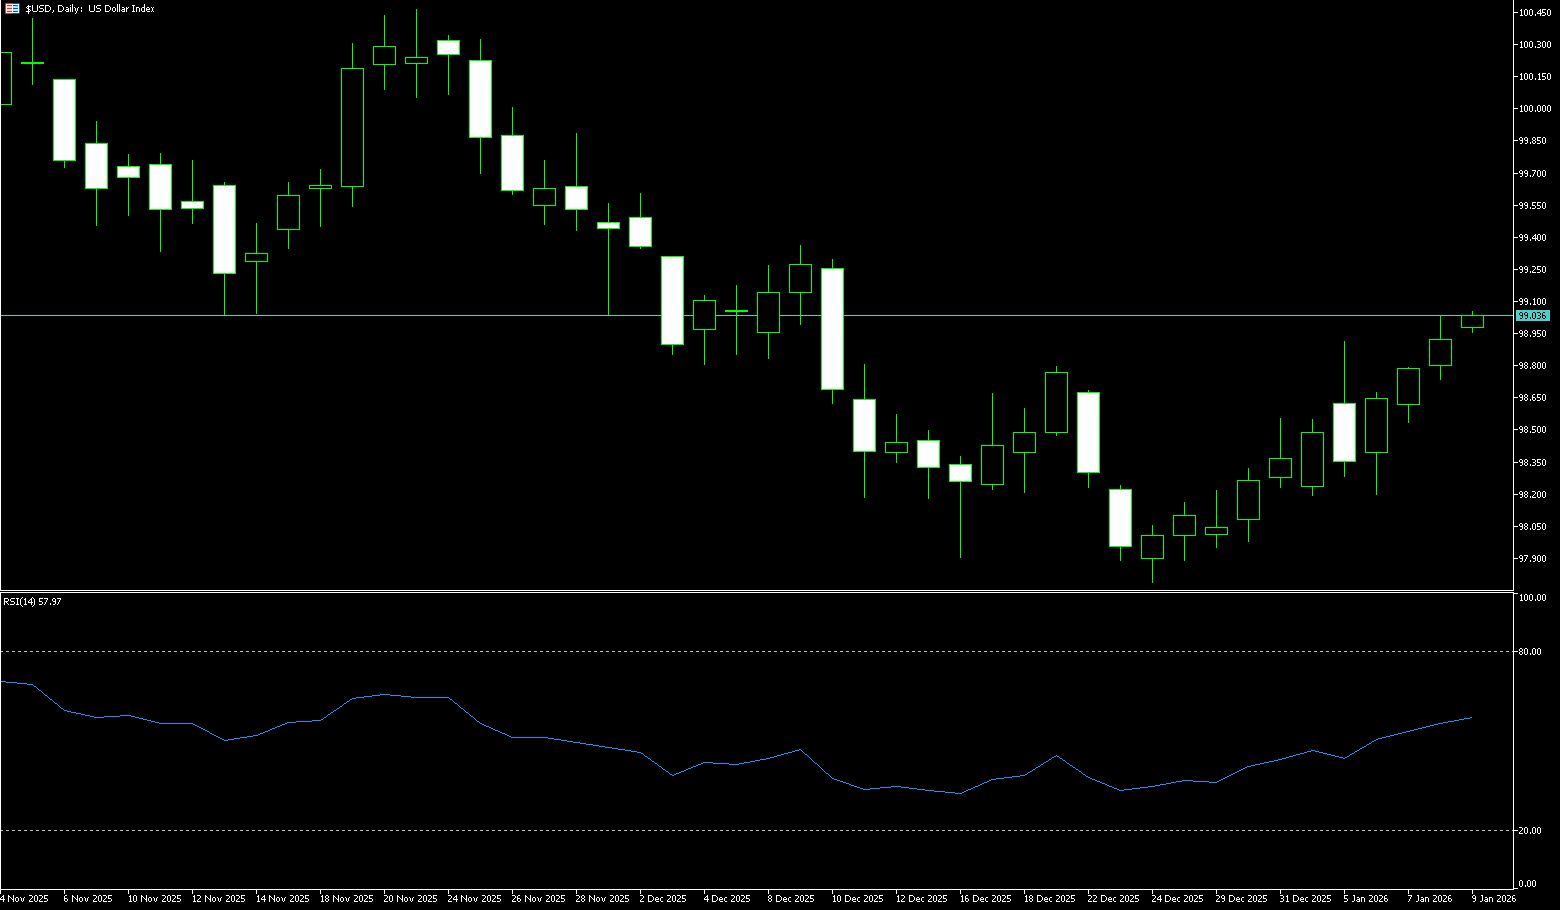
December nonfarm payrolls increased by 50,000, below the expected 70,000, while the unemployment rate fell from 4.6% to 4.4%, exceeding expectations. This supports the view of gradual easing rather than rapid interest rate cuts. Therefore, despite the weak nonfarm payroll data, the dollar remained relatively strong. In addition to economic data, traders are also focused on a possible Supreme Court ruling on future US import tariffs. The US dollar index climbed above 99 last week, rising for several consecutive trading days to reach its highest level in nearly a month. Data released last Thursday showed that weekly jobless claims rose slightly to 208,000, while announced layoffs in December fell to 35,553, the lowest level since July 2014, indicating a resilient labor market. The market has almost a 90% probability that the Federal Reserve will keep its policy unchanged at its January meeting, although traders continue to expect two or more rate cuts later this year. Investors are also awaiting the US Supreme Court's ruling on the legality of the Trump administration's tariffs. On the policy front, US fiscal officials recently stated publicly that the current economy still has growth potential, and if financing costs further decline, it is expected to unleash stronger momentum. This statement was interpreted by the market as an openness to continued monetary easing. Regarding interest rate expectations, the market anticipates an over 80% probability that the Federal Reserve will maintain interest rates unchanged at its January meeting, making the short-term policy path relatively clear, which also helps the US dollar maintain its strong consolidation.
Last week, the US dollar index showed a volatile rebound pattern, and was in a "low-level stabilization - volatile recovery" recovery phase. Overall, it remained in a volatile consolidation range of 98-99, still within a downward trend framework in the medium term. Short-term rebound momentum was limited by key resistance and data expectations. Technically, the US dollar index is in a technical rebound phase within a medium-term downward trend. The 200-day moving average of 98.79 has turned from resistance to support, but 99.32 (the high on December 9th last year) constitutes a key resistance area. From a technical perspective, the MACD has formed a golden cross below the zero axis, with increasing red histogram momentum, and the RSI (14) fluctuates in the 60-65 range, but the bullish elasticity is limited. The Bollinger Bands are currently consolidating, with the index oscillating around the upper band at 98.94, indicating an imminent breakout. On the other hand, candlestick pattern analysis shows the US dollar index recently exhibiting a converging triangle pattern, with lower highs and higher lows, resulting in a narrowing price range. This pattern typically foreshadows an impending breakout. Considering the consolidation characteristics of the Bollinger Bands, the US dollar index is highly likely to break downwards after completing its consolidation, continuing its medium-term downtrend. Therefore, key support levels to watch are 98.35 (the 20-day moving average) and 98.00 (a psychological level), with a break below these levels targeting 97.75 (the low from last December). Furthermore, if the US dollar index breaks above 99.32 (the high from December 9th last year) and 99.82 (the high from November 28th last year), the next target will be the psychological level of 100.
Today, consider shorting the US Dollar Index around 99.26; Stop loss: 99.40; Target: 98.80; 98.70
WTI Crude Oil
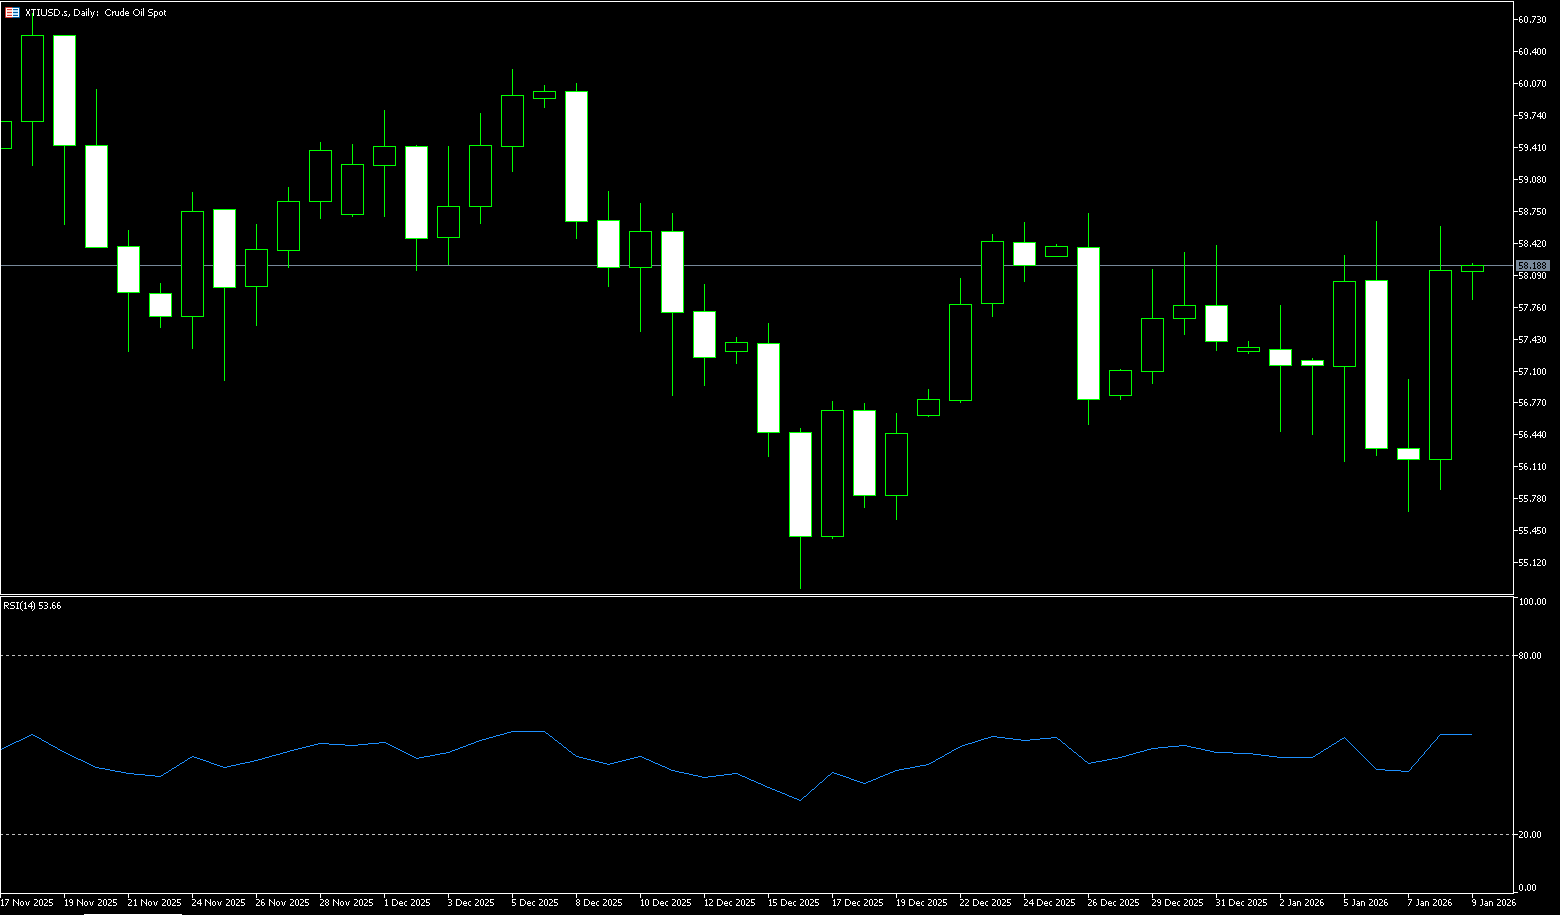
WTI crude oil rose for the third consecutive week to around $58.60 per barrel, as the market continued to weigh geopolitical risks. President Trump warned Iran that he would respond "toughly" if its government caused the deaths of protesters, reigniting concerns about potential supply disruptions from one of OPEC's largest oil producers. Traders also digested news that Senator Lindsey Graham said Trump had approved a bipartisan sanctions bill targeting countries that bought cheap Russian oil to fund the Moscow war. Meanwhile, US actions in Venezuela remain under scrutiny, with Washington seizing two oil tankers in the Atlantic linked to the country, one of which flew the Russian flag, highlighting Trump's efforts to increase control over energy flows in the Americas and pressure the Venezuelan socialist government. On the other hand, despite the increase in US refined oil inventories and plans to sell Venezuelan crude oil to domestic refiners, the market is more concerned about the evolving situation in Venezuela and the potential supply disruption risks from major oil-producing countries such as Russia, Iraq, and Iran. Against the backdrop of multiple geopolitical uncertainties, expectations of capital inflows, and highly concentrated short positions, oil prices received significant short-term support.
WTI crude oil showed a "bottoming out and rebounding, consolidation and repair" trend last week. It found support near $55.68 at the beginning of the week, and rebounded sharply by over 3% before the end of the week due to geopolitical risks and short covering. Overall, it maintained range-bound trading, and the medium-term downward pressure has not been completely eliminated. The 14-day Relative Strength Index (RSI) shows that the current RSI (14) is around 50-55, rising from near the oversold zone to below the neutral zone, but has not entered an extremely oversold state. Momentum has shifted from weak to stable, indicating a significant weakening of bearish momentum. The MACD shows an important change signal, indicating that although the downward momentum has clearly weakened, the trend has not yet completed a strong reversal confirmation. From the perspective of moving averages, the 100-day moving average is below the 200-day moving average, confirming the continuation of the downtrend. Specifically, the 200-day moving average is currently around $62.01, and the 100-day moving average is around $60.13. Both are sloping downwards and converging at the top of the descending channel, forming a strong dynamic resistance zone. This further confirms the medium-term bearish pattern. Currently, oil prices are exhibiting a typical descending channel structure, having traded within this channel since October 2025. They are currently testing key support areas near $57.21 (the 20-day moving average) and $55.68 (last week's low). Finally, there is the area around $54.88 (last year's low). Only if oil prices effectively hold above the psychological level of $60.00 and the 100-day moving average ($60.13) will it be more likely to open up upward potential to test the resistance zone near the 200-day moving average at $62.01.
Today, consider going long on spot crude oil around 58.48; Stop loss: 58.30; Target: 59.80; 60.00
Spot Gold
Gold prices maintained a positive bias last week, continuing to fluctuate at high levels and breaking through $4,500 to reach a domestic yearly high of $4,517. Despite a stronger dollar and rising US Treasury yields, risk aversion continued to favor the gold metal. The dollar extended its two-week upward trend, rising to a one-month high amid key US data risks, putting some downward pressure on gold. Nevertheless, rising market expectations for further Fed rate cuts, coupled with continued geopolitical uncertainty, provided a tailwind for the safe-haven precious metal. This mixed fundamental backdrop, in turn, made traders reluctant to make new directional bets, resulting in a subdued/range-bound price movement. As the market increasingly accepts expectations that the US central bank will cut borrowing costs twice more this year, coupled with continued geopolitical uncertainty, these factors continue to support gold prices. However, the US dollar defied the dovish expectations of the Federal Reserve, extending its two-week upward trend to a near one-month high. Although gold prices have stabilized above $4400, they still face some pressure in the short term, mainly from the annual weighting adjustment of the Bloomberg Commodity Index. This adjustment mechanism aims to make the index more closely reflect market realities, but since its implementation this week, it has created significant selling pressure on precious metals such as gold and silver. This index rebalancing often triggers passive selling by funds, leading to short-term pressure on gold prices, but this is more of a technical factor than a deterioration in fundamentals.
Spot gold exhibited a high-level consolidation with a slightly bullish bias last week. After experiencing a historic surge of 64.57% in 2025, gold prices are currently in a technical adjustment phase within a bull market trend. While maintaining a long-term bull market structure, there is a need for overbought correction. Technical indicators present complex signals: the MACD indicator's fast and slow lines crossed downwards after a high-level death cross, and the histogram has turned negative, indicating short-term bearish momentum; the RSI indicator has fallen from the overbought zone to around 65.09, showing that overbought pressure is being digested; the KDJ indicator formed a golden cross at a low level and is now correcting upwards, suggesting a possible technical rebound. From a candlestick pattern perspective, the gap up on January 2, 2026, created a gap (US$4315-4327). If this gap remains unfilled, the short-term rebound momentum will strengthen; if the gap is filled, it could trigger a deeper pullback. Currently, the price is forming a consolidation platform in the US$4350-4500 range, and the direction of the breakout from this range will determine the short-term trend. The daily chart shows intense competition between bulls and bears. Key support levels at $4,400 (psychological level) and $4,394.30 (20-day moving average) have turned into strong support; then comes key support at $4,345 (last week's low). On the upside, the first resistance level for gold is at $4,517 (last week's high). If gold holds above this level, it could pave the way for a break above the all-time high of $4,549.80, and further challenge the psychological level of $4,600.
Today, consider going long on spot crude oil around 4503; stop loss: 4498; target: 4540; 4550

AUD/USD
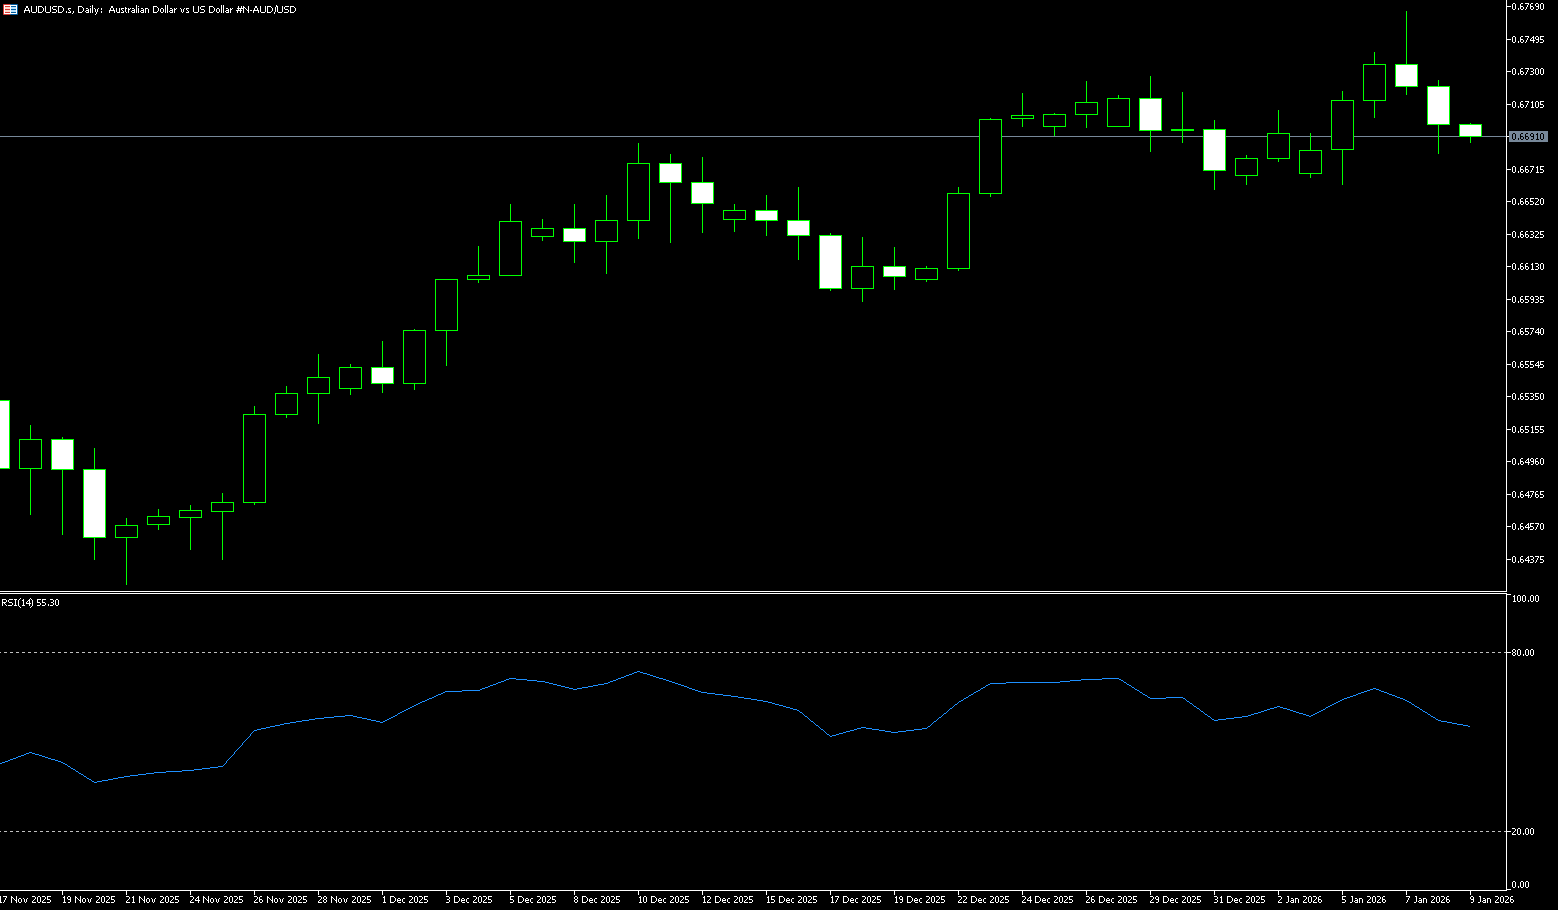
The AUD/USD pair weakened slightly last week, hovering just below 0.6700. This movement mainly reflects renewed support for the US dollar, while the Australian dollar was pressured by easing expectations of monetary tightening amid mixed US macroeconomic data. Overall, these data point to a moderate slowdown in the US economy, but one that remains relatively resilient. Against this backdrop, monetary policy expectations remain cautious. Investors believe the Federal Reserve can wait patiently before further easing. The market widely expects interest rates to remain unchanged at the January meeting, and the likelihood of a rate cut in March has decreased. This outlook supports the US dollar and limits the upside potential of the AUD/USD pair. US consumer confidence also indirectly supports the US dollar. The preliminary reading of the University of Michigan Consumer Sentiment Index rose to its highest level in several months in January, while one-year and five-year inflation expectations remain high. These factors reinforce the view that the Federal Reserve must remain vigilant about inflation risks, even in a softer growth environment. In Australia, the Australian dollar was pressured by disappointing inflation data. November's Consumer Price Index (CPI) data showed that the annual inflation rate fell to 3.4%, a larger drop than expected.
Last week, the AUD/USD pair generally trended slightly higher, maintaining an upward channel structure. The bulls and bears were locked in a tug-of-war near key resistance levels, with the short-term upward momentum slowing but the bullish pattern remaining intact. The exchange rate has been moving within an upward channel, with the lows gradually rising. It is supported by short-term moving averages (such as the 5-day and 10-day moving averages) and the overall bullish trend remains intact. However, it encountered significant resistance near 0.6766 (the high since October 2024), and fell back after touching it multiple times, indicating that the selling pressure in this area is relatively heavy, and it is difficult to form a one-sided upward trend without resistance in the short term. The RSI (14) of the daily chart is about 55-60, which is in the strong range. The safety margin of the short-term bulls is narrowing, and we need to be wary of profit-taking leading to a pullback. Although the MACD has not accelerated significantly, the bullish trend continues. If a death cross occurs, we need to be wary of a short-term weakening. In addition, the exchange rate is above the Bollinger Band midline and is moving towards the upper band. The bandwidth is expanding, which suggests that the trend opportunity is increasing. An effective breakout of the upper band may open up new upward space. The short-term oscillating pattern with a slight upward bias continues. A break above and holding above 0.6755 (the upper Bollinger Band) and 0.6766 (last week's high) could lead to a move towards the 0.6800 psychological level and 0.6852 (the high from October 4th last year). Conversely, a break below 0.6641 (the 34-day moving average) would likely lead to a pullback to the 0.6600 psychological level for consolidation.
Today, consider going long on the Australian dollar near 0.6680; stop-loss: 0.6668; target: 0.6730; 0.6740
GBP/USD
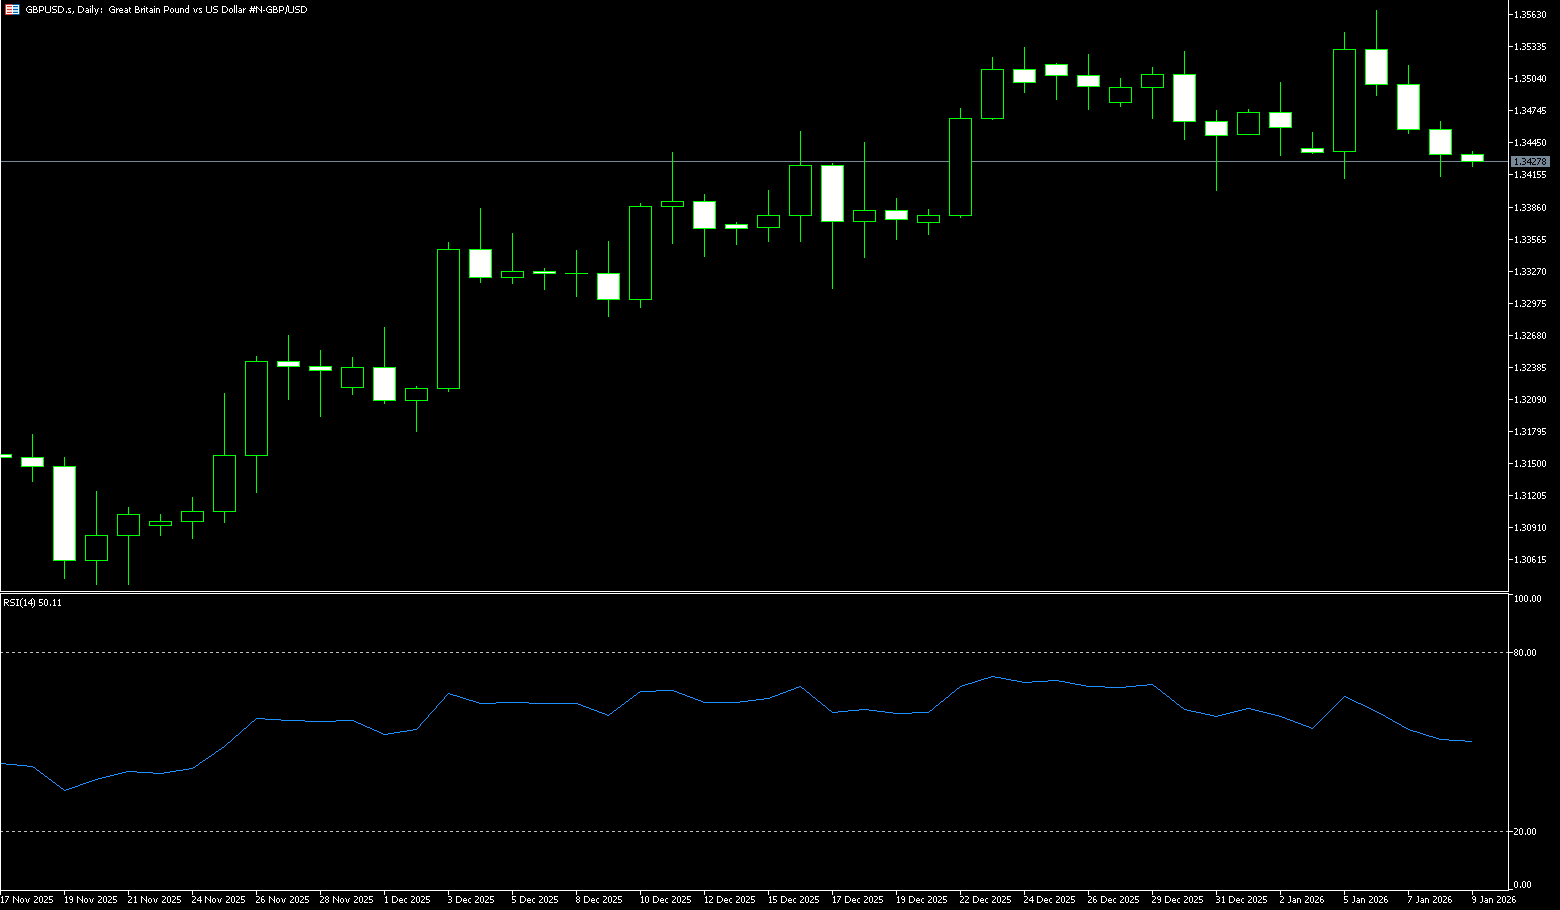
During last week's trading session, the pound was indeed influenced by the strong performance of the US dollar, especially after the release of mixed non-farm payroll data, and traded near its key 200-day simple moving average around 1.3392. The market remained cautious ahead of key US events and preferred to hold the dollar, which negatively impacted the pair. The market is awaiting the US Supreme Court's ruling on tariffs. Relatively stable global stock markets diminished the dollar's appeal as a safe-haven asset. These factors combined limited further dollar strength after its previous rise to a one-month high and provided some support for the pound against the dollar. On the other hand, the Bank of England's recent signals have been relatively dovish and neutral. Central bank officials hinted that interest rates are gradually approaching the neutral range, and the overall rhetoric did not shift significantly towards a dovish stance, which supported the pound's performance to some extent and helped limit the downside potential of the pound against the dollar. Therefore, in the absence of clear negative catalysts, the market still needs to see stronger selling momentum to confirm a deeper pullback in the exchange rate from the 1.3565-1.3570 high reached at the beginning of this week (a new high since September last year). Looking at the weekly performance, the pound/dollar pair is currently roughly flat, with limited overall volatility. Although there is a lack of clear direction in the short term, considering the overall fundamental environment, the overall pattern remains slightly bullish, which is conducive to some bargain hunting at lower levels.
From a technical perspective, the pound/dollar pair's movement last week exhibited the following key characteristics: First, from the perspective of the moving average system, although the pound/dollar pair pulled back last week, it still remained above the 200-day moving average at 1.3392. The effective holding of this key medium-term support level indicates that the overall bullish trend has not fundamentally changed. At the same time, the 9-day moving average at 1.3468 has turned from support to resistance, and the price is trading below it, indicating that short-term momentum has indeed weakened. Secondly, looking at the Relative Strength Index (RSI), the 14-day RSI has fallen from nearly overbought levels of 69.29 in early January to around 48.50, currently in a neutral-to-bullish range. Momentum has clearly slowed but remains around 50, suggesting that while the market has undergone adjustments, the medium-term bullish trend remains unchanged. Thirdly, the daily MACD fast and slow lines are flattening near the zero line, indicating that bullish momentum is slowing and there is some short-term downward pressure, but no clear death cross signal has yet appeared, indicating that the conditions for a trend reversal are not yet sufficient. Finally, from a price pattern perspective, the GBP/USD pair has formed a relatively clear consolidation pattern within the range of 1.3392 (200-day moving average) - 1.3567 (last week's high). The 1.3500-1.3530 area above forms strong resistance, while 1.3392 (200-day moving average) and 1.3355 (lower Bollinger Band) below are important support levels. This range-bound trading pattern typically indicates that the market is choosing a direction, and a breakout from key levels could trigger a new trend.
Today, consider going long on GBP/USD around 1.3394; Stop loss: 1.3380; Target: 1.3440; 1.3450
USD/JPY
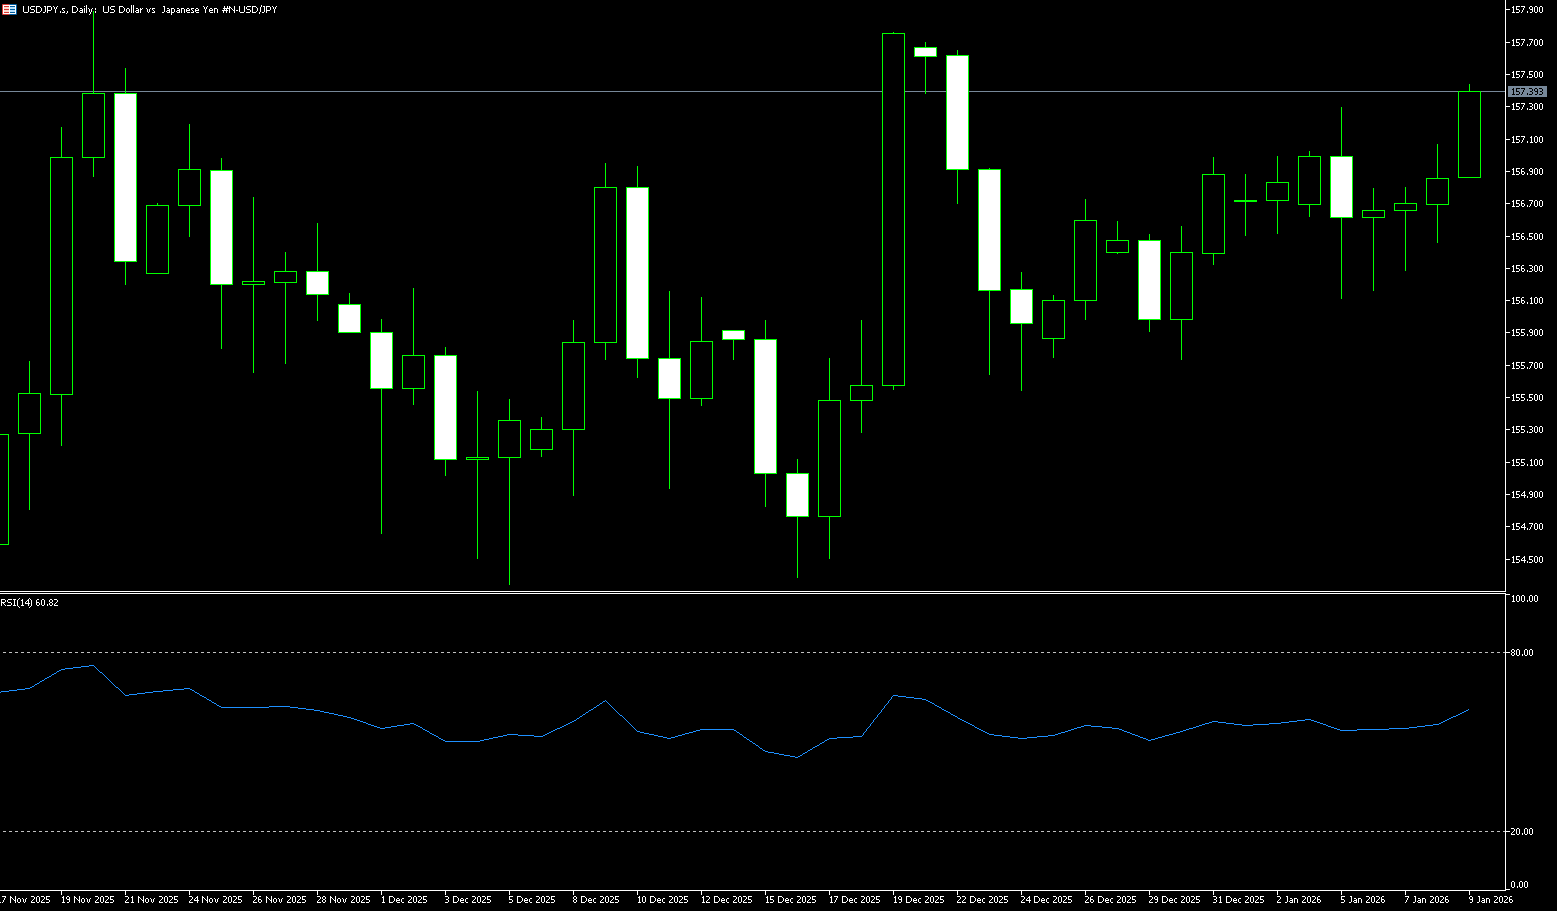
Last week, the yen continued to weaken against the dollar, with USD/JPY rising for the fourth consecutive day as the dollar continued to strengthen following the release of the latest batch of US economic data. The pair reached a high of 158.20, hovering near its highest level since January 2025, and is on track for its second consecutive week of gains. The yen weakened for several trading days last week, with USD/JPY rising to a weekly high near 158. Despite an unexpected rebound in Japanese household spending in November, continued declines in real wages and structural problems such as inflation outpacing wages weakened the consumption outlook and exacerbated market uncertainty regarding the timing of the Bank of Japan's interest rate hikes. Against the backdrop of a strong US dollar and escalating geopolitical and trade tensions, the Japanese yen is under significant short-term pressure, but expectations of a Federal Reserve rate cut may still limit further upside potential. Meanwhile, regional frictions are further weighing on the yen's performance. On the policy front, Bank of Japan Governor Kazuo Ueda reiterated this week that if economic and inflation trends meet expectations, the central bank will continue to gradually raise interest rates. This statement provides some support for the yen in the medium to long term, but in the short term, the market still lacks a clear judgment on the specific timing of the next rate hike, limiting the yen's rebound ability. However, due to widespread market expectations that the Federal Reserve may continue to cut rates this year, the further upside potential of the US dollar is also somewhat constrained.
Last week, the USD/JPY pair generally exhibited a high-level, slightly bullish consolidation pattern, repeatedly battling within the 156.16 (34-day moving average) - 158.00 (psychological level) range. The medium-term upward trend remains intact, but short-term momentum is slowing. Key resistance and support levels are clear, and indicators show weakening bullish dominance and a more volatile trading pattern. Last week, the exchange rate repeatedly tested the 157.00-157.30 level but encountered resistance, with increased selling pressure and a slower upward slope, resulting in a high-level consolidation. The USD/JPY pair remains within its medium-term upward channel, supported by dynamic levels at 156.12 (last week's low) and 156.16 (the 34-day moving average). As long as the 156.00-156.16 area holds, the medium-term bullish structure remains intact; however, a close below this range could lead to high-level consolidation or even a phase of pullback. The daily RSI (14) rose from 52.60 to 63.50 last week, indicating that bulls still have the upper hand, but momentum is slowing. It is neither overbought nor weakening, showing clear consolidation characteristics and limiting the possibility of a one-sided trend. On the other hand, the MACD's upward momentum is weakening, with a potential risk of a death cross, warranting caution against further weakening momentum triggering a pullback. Regarding the moving average system, the exchange rate is trading above the 20-day and 100-day moving averages, indicating a healthy medium-term bullish structure. However, the short-term moving averages are flattening, suggesting a slowdown in the upward momentum and an increased probability of consolidation. If USD/JPY stabilizes above 157.00 and breaks through 157.30 with significant volume, with the RSI returning above 60 and the MACD histogram expanding again, the target is 158.00 (a psychological level) and the previous high of 158.20, further challenging 158.88 (last year's high) and pointing towards the psychological level of 160.00. Conversely, if it breaks below the 156.00-156.16 support area, and the RSI (14) crosses below 50 and the MACD forms a death cross, it may test the 155.53 (55-day moving average) and the 155.03 (lower Bollinger Band) area.
Consider shorting the US dollar around 158.05 today; Stop loss: 158.30; Target: 157.20 157.00
EUR/USD
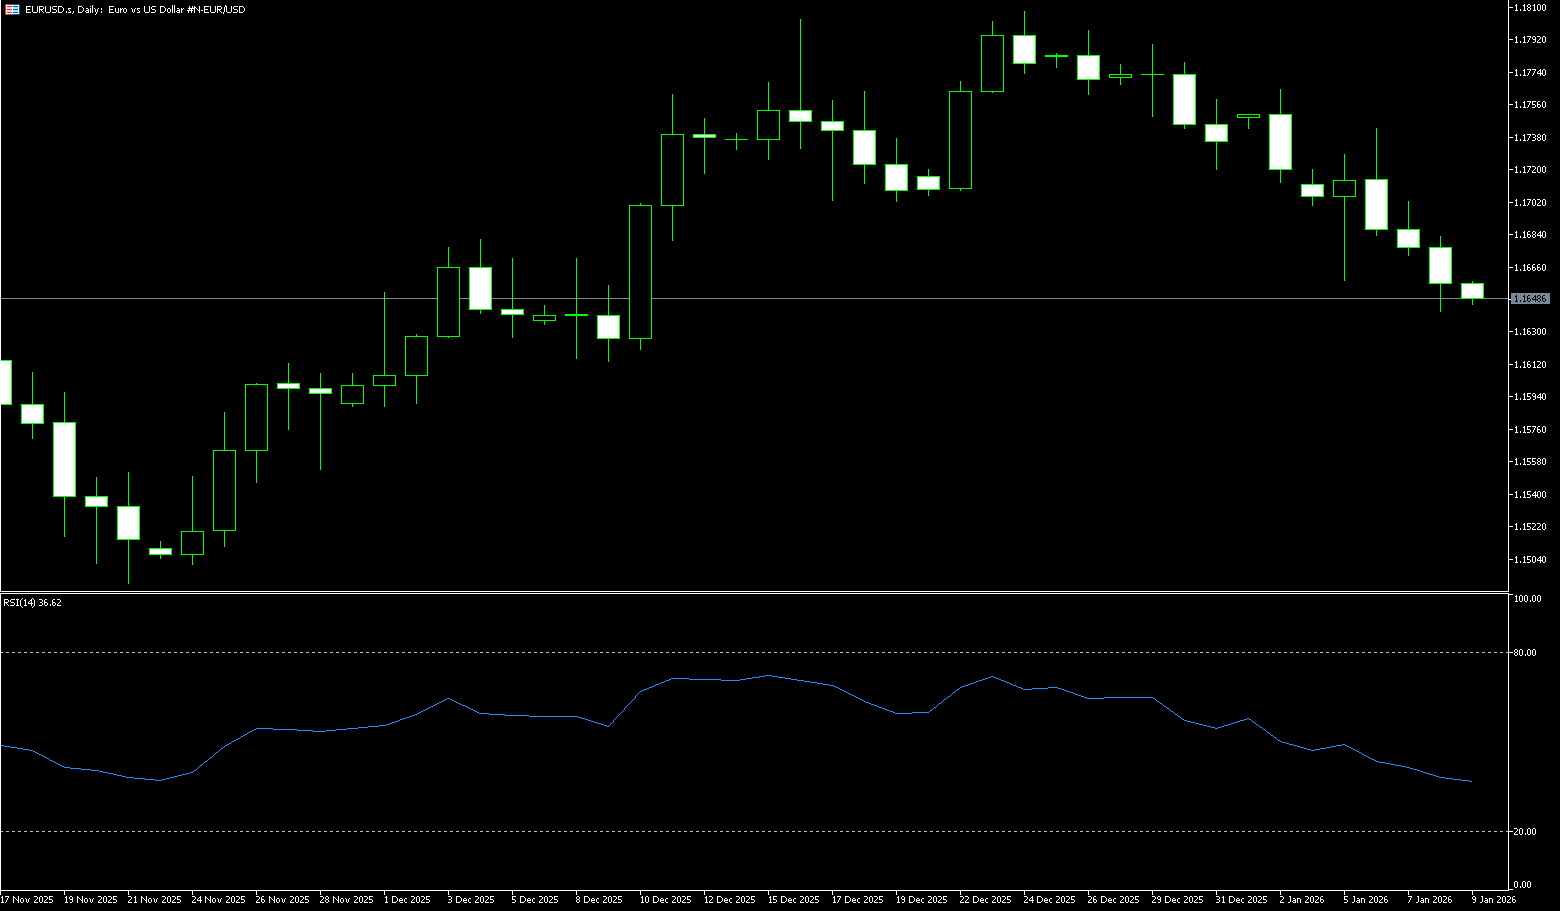
Last week, EUR/USD continued its painful run throughout the week, and is expected to record a weekly decline of 0.70%, despite mixed US economic data. In the EU, retail sales exceeded expectations, but traders' focus remained on the dynamics of the US and the dollar. The pair is currently trading at 1.1635 after hitting an intraday high of 1.1662. December's US nonfarm payroll data was mixed, with the economy adding 50,000 jobs, below the expected 60,000 and also below November's 64,000. However, the unemployment rate fell to 4.4% from 4.6%, according to the US Bureau of Labor Statistics. Other data showed that the housing market continued to lose momentum, with both building permits and new home starts declining in October compared to November's readings. Meanwhile, the University of Michigan's preliminary January consumer confidence report was stronger than expected. In the Eurozone, consumer spending rose 0.2% in November, an improvement from the flat figure in October and exceeding expectations. German data was mixed that day, with industrial production exceeding expectations, but the trade balance narrowing due to declining exports. The Eurozone economic calendar will include speeches by European Central Bank policymakers, the release of the Sentix investor confidence index, and the Harmonized Index of Consumer Prices (HICP) for the region, Germany, Spain, and Italy.
Last week, the euro traded in a downward trend against the US dollar, falling from a high of 1.1743 to a low of 1.1618 before the weekend, generally fluctuating within the 1.16-1.17 range. Short-term downward pressure is evident, but the medium-term consolidation pattern remains unchanged. On the weekly chart, the pair is in a high-level consolidation phase after a previous surge. On the daily chart, a pullback is observed. After breaking below the psychological level of 1.17, the pair found key support near 1.1602 (the 180-day moving average) and 1.1600 (the psychological level). No clear reversal pattern has yet formed, and the pair is likely to maintain range-bound trading in the short term. The 14-day Relative Strength Index (RSI), a technical indicator, has fallen from near the overbought zone of 70 to below 40, currently around 36.30, indicating weakening upward momentum and a potential for a pullback. However, it has not yet entered the oversold zone, suggesting limited downside potential. The daily MACD, after crossing below the signal line, has further broken below the zero line, with the green histogram expanding, releasing short-term downward signals and indicating increased bearish pressure. As for the moving averages, the 5-day moving average shows signs of crossing below the 10-day moving average, forming a death cross. The short-term moving average system is bearish, putting downward pressure on prices; the 100-day moving average, however, remains upward, providing some support for the medium-term trend. Therefore, the support levels to watch are 1.1602 (180-day moving average) and 1.1600 (psychological level). A break below these levels could lead to a test of 1.1570 (200-day moving average) and 1.1511 (the low of November 25th last year). A rebound would require a break above the psychological resistance level of 1.1700 to alleviate downward pressure. A break above this level would target 1.1742 (last week's high), with a short-term target of the psychological level of 1.1800.
Today, consider going long on the Euro around 1.1620; stop-loss: 1.1610; targets: 1.1670, 1.1680.
Disclaimer: The information contained herein (1) is proprietary to BCR and/or its content providers; (2) may not be copied or distributed; (3) is not warranted to be accurate, complete or timely; and, (4) does not constitute advice or a recommendation by BCR or its content providers in respect of the investment in financial instruments. Neither BCR or its content providers are responsible for any damages or losses arising from any use of this information. Past performance is no guarantee of future results.
Lebih Liputan


Pendedahan Risiko:Instrumen derivatif diniagakan di luar bursa dengan margin, yang bermakna ia membawa tahap risiko yang tinggi dan terdapat kemungkinan anda boleh kehilangan seluruh pelaburan anda. Produk-produk ini tidak sesuai untuk semua pelabur. Pastikan anda memahami sepenuhnya risiko dan pertimbangkan dengan teliti keadaan kewangan dan pengalaman dagangan anda sebelum berdagang. Cari nasihat kewangan bebas jika perlu sebelum membuka akaun dengan BCR.
BCR Co Pty Ltd (No. Syarikat 1975046) ialah syarikat yang diperbadankan di bawah undang-undang British Virgin Islands, dengan pejabat berdaftar di Trident Chambers, Wickham’s Cay 1, Road Town, Tortola, British Virgin Islands, dan dilesenkan serta dikawal selia oleh Suruhanjaya Perkhidmatan Kewangan British Virgin Islands di bawah Lesen No. SIBA/L/19/1122.
Open Bridge Limited (No. Syarikat 16701394) ialah syarikat yang diperbadankan di bawah Akta Syarikat 2006 dan berdaftar di England dan Wales, dengan alamat berdaftar di Kemp House, 160 City Road, London, City Road, London, England, EC1V 2NX. Entiti ini bertindak semata-mata sebagai pemproses pembayaran dan tidak menyediakan sebarang perkhidmatan perdagangan atau pelaburan.

 English
 简体中文
简体中文
 繁體中文
繁體中文
 Bahasa
Melayu
Bahasa
Melayu
 Tiếng
Việt
Tiếng
Việt
 ไทย
ไทย
 日本語
日本語
 한국어
한국어
 ភាសាខ្មែរ
 español