


0
US Dollar Index
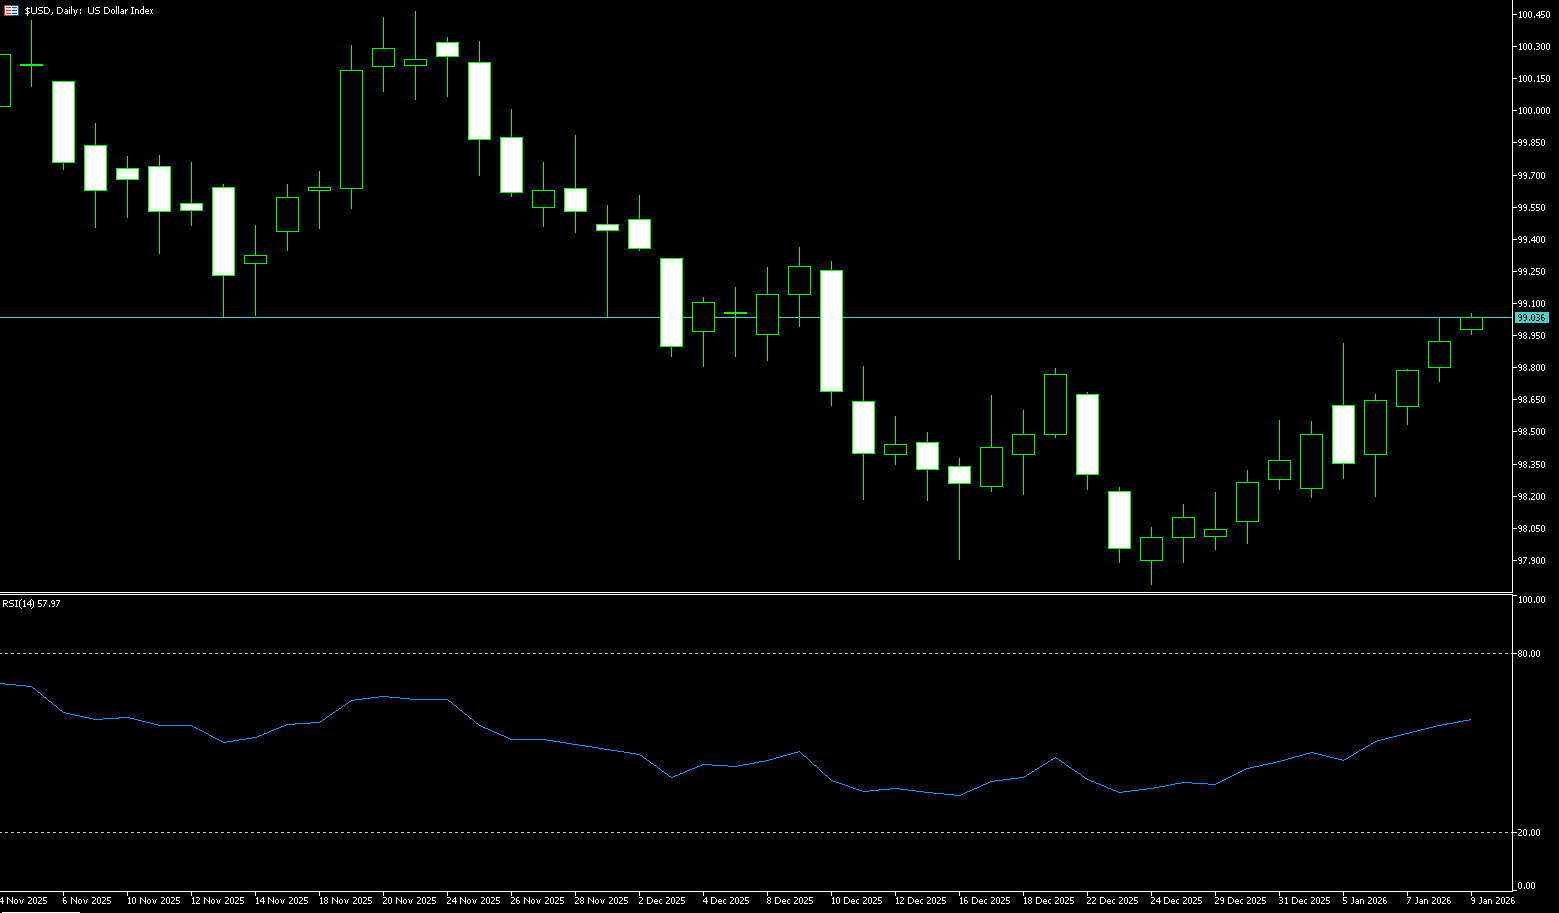
The US dollar index reached above 99 on Tuesday as investors increased bets that the Federal Reserve would cut interest rates further following encouraging inflation data. The latest data showed that underlying price pressures are easing, reinforcing the view that inflation is gradually cooling. Core consumer prices, excluding food and energy, rose 0.2% in December, below market expectations, while the annual core inflation rate remained at 2.6%, matching a four-year low. These data provide a clearer signal that earlier reports were distorted by the shutdown effect. Interest rate futures reflected a divergent market view that the Fed will cut rates two or three times this year, exceeding the expectations of FOMC members. Furthermore, the upcoming Supreme Court ruling on the legality of Trump's tariff policies could also influence the dollar's trajectory.
On Monday, the US dollar index traded slightly above 99.00, having previously dipped to a low of 97.75 before stabilizing and rebounding, subsequently reaching a high of around 99.26 before encountering resistance and falling back. Overall, the current price is in the process of a corrective rebound, but there is significant upward pressure, and a one-sided upward trend has not yet formed. From a technical perspective, the MACD has turned positive to 0.2489, indicating that the downward momentum is weakening and the bullish forces are beginning to recover. The RSI (14) is at 56.09, which is in the neutral to strong range, indicating that the market is still in a stalemate between bulls and bears, and it is unlikely that a one-sided market will emerge in the short term. In this context, the key support level is the 200-day moving average {98.77}. The 25-day moving average {98.42} is an important medium- to long-term support level. This has become a key point of observation. As for the upside, the US dollar index may still rise above 99.32 {the high of December 9th last year}, and the next level will be 99.82 {the high of November 28th last year}.
Today, consider shorting the US Dollar Index around 99.28; Stop loss: 99.40; Target: 98.80; 98.70
WTI Crude Oil
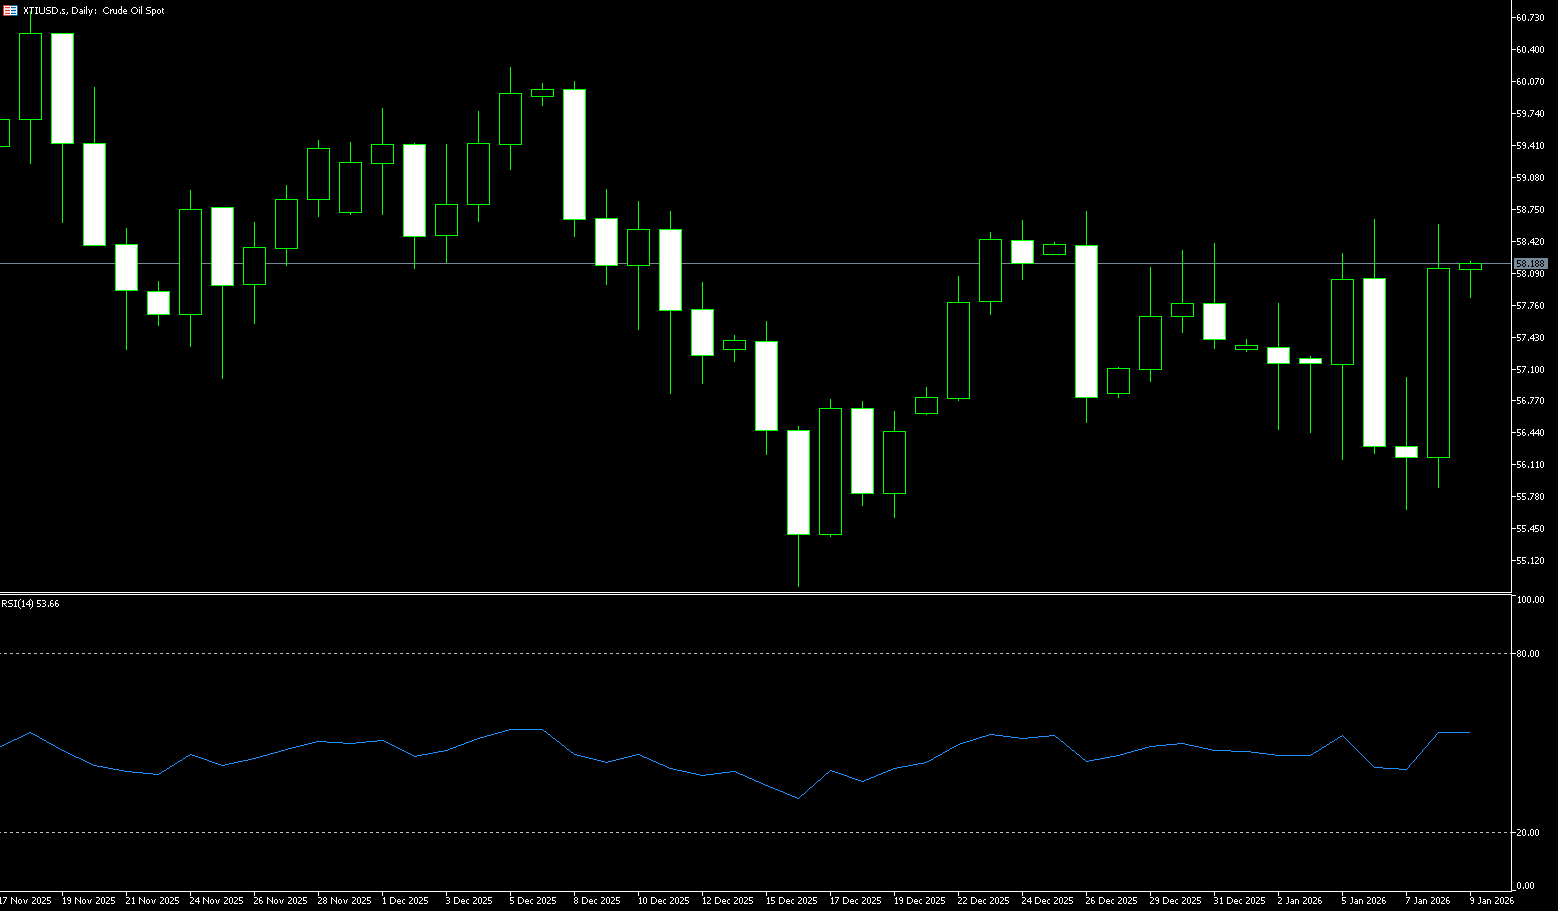
On Tuesday, US crude oil surged nearly 2.5% to $61.23 per barrel, a 12-week high, as heightened geopolitical risks fueled concerns about supply disruptions. US President Trump's comments on Iran increased investor caution, with Trump announcing the cancellation of meetings with Iranian officials until protests ceased and warning of "imminent aid." This move came shortly after imposing a 25% tariff on Iranian-related goods, exacerbating concerns that regional tensions would impact oil flows. Disruptions at the United Caspian Pipeline terminal in Kazakhstan also supported prices, where severe weather, maintenance, and drone attacks reduced loadings by nearly half, to approximately 900,000 barrels per day.
From a technical perspective, the main trend remains upward. Oscillators and moving average trend indicators support a potential rebound. If the upward momentum continues, it is expected to test key target levels, including $61.20 (the high of November 11th last year) and the 200-day moving average at $61.97 per barrel. Conversely, if the 50-day moving average at $58.40 is breached, oil prices may experience a deep pullback to the support level of $57.50 (last Friday's low). WTI has recently retreated slightly from last Friday's settlement price of $59.12 per barrel, reflecting a short-term digestion of market concerns about supply disruptions. The upward technical targets of key trend indicators remain unchanged. Overall, the oil market is expected to maintain wide fluctuations in 2026. The OPEC+ production halt provides a short-term buffer, but non-OPEC growth will dominate the long-term bear market trend.
Today, consider going long on spot crude oil around 60.70; Stop loss: 60.55; Target: 61.80; 62.00
Spot Gold
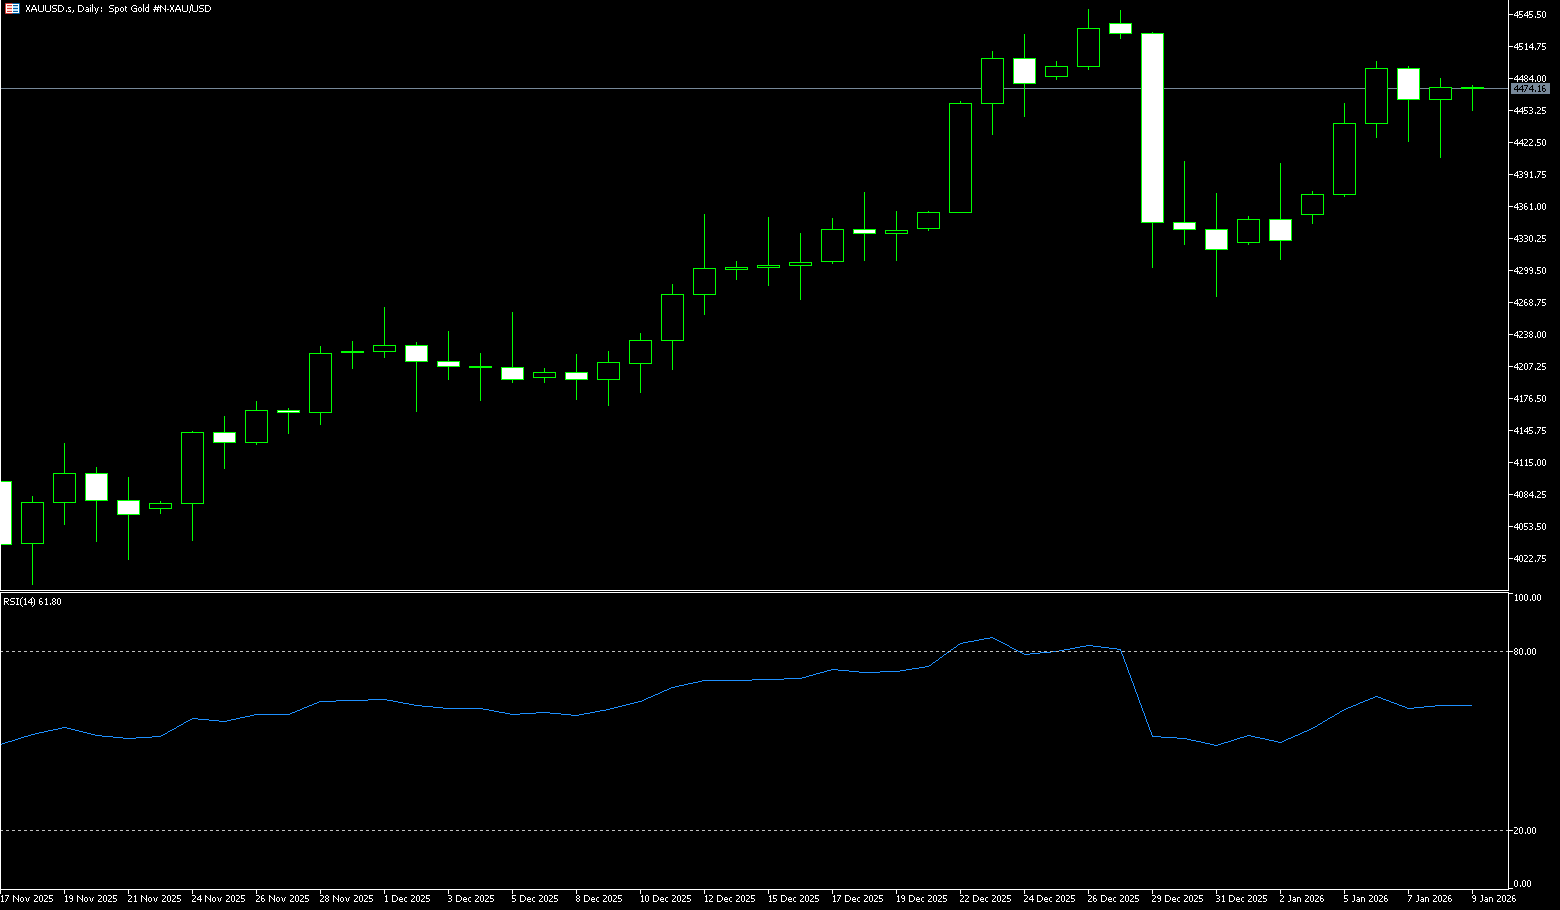
On Tuesday morning in Asian trading, spot gold was around $4,590 per ounce. Gold prices hit a new all-time high of $4,630.30 per ounce on Tuesday, driven by uncertainty surrounding the Trump administration's criminal investigation of Federal Reserve Chairman Powell, prompting investors to turn to safe-haven assets. The investigation into Powell exacerbated market uncertainty, and the factors supporting gold prices in the short term are unlikely to change. Furthermore, market expectations of further interest rate cuts by the Federal Reserve later this year have also increased demand for non-yielding assets such as gold. Geopolitical tensions also provided support for gold prices. The Trump administration is considering a response to Iran's crackdown on protests, having previously ousted Venezuelan President Maduro and expressed interest in acquiring Greenland. Looking back over the past year, gold prices have surged more than 64%, marking their best annual performance since 1979, thanks to a sustained low-interest-rate environment and a surge in safe-haven demand.
Gold quickly reached its first all-time high at the start of 2026, breaking through $4,600 per ounce for the first time. The key question now is: will this year continue to break new highs like last year, or is this rally just a flash in the pan? However, for now, the path of least resistance for gold remains upward. From a technical perspective, the trend for gold remains very positive. Although momentum indicators suggest the market is overbought, this in itself is not enough to justify selling. On the downside, the first support zone for spot gold is between $4,500 and $4,550. This area is the previous all-time high from last December and has significant psychological value. On the upside, there are no obvious resistance levels, which naturally brings the next round-number targets of $4,625, $4,687, and the $4,720 Fibonacci retracement level into view. These areas may attract Fibonacci traders to take profits.
Today, consider going long on spot gold around 4,585; Stop loss: 4,580; Target: 4,620; 4,630
AUD/USD
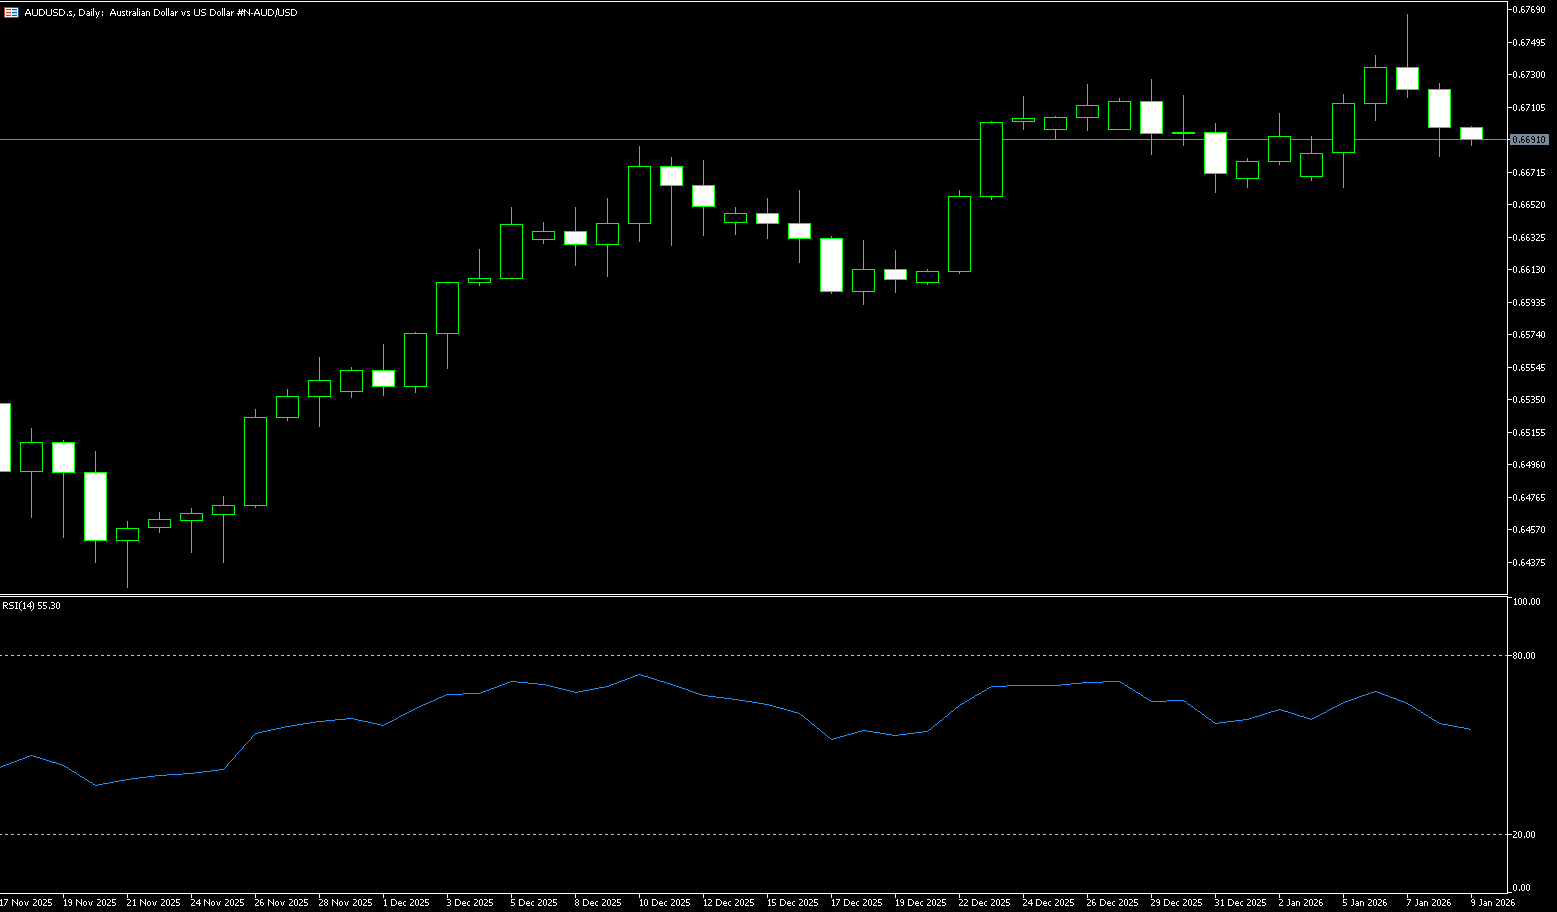
The Australian dollar held steady near US$0.6700 on Tuesday, with the market continuing to anticipate a rate hike by the Reserve Bank of Australia (RBA) later this year. RBA Deputy Governor Andrew Hauser recently stated that inflation remains “too high,” suggesting the easing cycle may have ended. Last month, RBA Governor Michelle Bullock warned that the next policy step could be a rate hike after inflation again exceeded the RBA’s 2-3% target range. These hawkish comments were digested along with data showing that household spending rose 1% month-on-month in November 2025, slowing from 1.4% in October but exceeding the forecast of 0.6%. Meanwhile, ANZ-Indeed job advertisements in Australia fell 0.5% month-on-month in November 2025, marking the sixth consecutive month of decline. Externally, the Australian dollar was supported by a weaker dollar due to reports of a criminal investigation into Federal Reserve Chairman Powell, while US non-farm payroll data fueled expectations of further easing this year.
The daily chart shows AUD/USD trading slightly below 0.6700, with bullish momentum improving. The 14-day Relative Strength Index (RSI) is at 59.77, indicating a mild bullish trend, while the MACD line has crossed the signal line, highlighting the improved momentum. The pair is approaching key resistance at the 0.6725 area (the high from December 26th last year). A break above this level would increase the upward momentum towards 0.6766, the highest level since October 2024. Following that is the psychological level of 0.6800. On the downside, a break below 0.6663 (last Friday's low) would lead to AUD/USD testing the 34-day simple moving average at 0.6651. A break below this level would target 0.6600, a psychological level for the market.
Consider going long on the Australian dollar around 0.6670 today; Stop loss: 0.6660; Target: 0.6720; 0.6730
GBP/USD
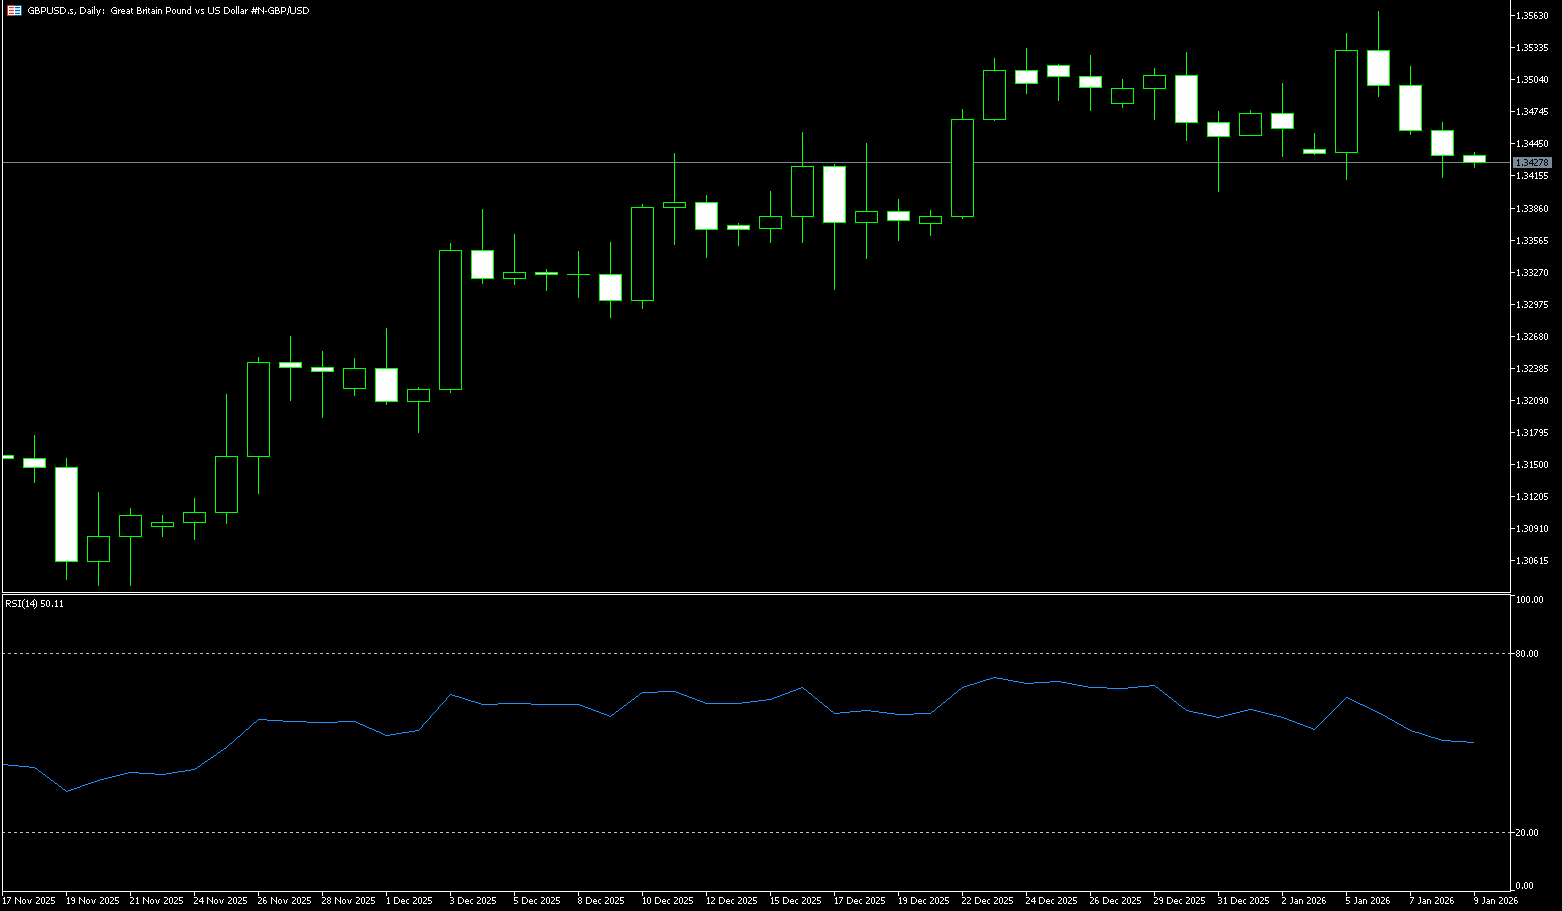
GBP/USD retreated to the 1.3430 area on Tuesday. Amid growing concerns about the independence of the Federal Reserve, the dollar struggled to attract any significant buying, becoming a key support factor for the GBP/USD pair. In fact, prosecutors have launched a criminal investigation into Fed Chairman Powell. Despite these negative developments, the downside for the dollar remains limited due to reduced bets on more aggressive policy easing by the Fed, which in turn could limit the gains for GBP/USD. Meanwhile, rising market bets on two more rate cuts by the Bank of England in 2026 could put pressure on the pound and limit any significant gains for the GBP/USD pair. Traders will also face the US Producer Price Index release on Wednesday this week. Additionally, Thursday's UK monthly GDP report will provide some meaningful impetus for the pair.
The daily chart shows GBP/USD trading at 1.3430, with the 14-day Relative Strength Index (RSI) in the 53 zone, recovering within bullish territory. A break above 1.3500 (the psychological level) would pave the way for a test of the yearly high of 1.3567, followed by the psychological level of 1.3600. On the other hand, a corrective pullback is possible in the short term. A break below 1.3427 (the 30-day simple moving average) would expose the psychological level of 1.3400, and a break below that would target the 200-day simple moving average at 1.3390. Any further decline to 1.3350 could be seen as a buying opportunity.
Today, consider going long on GBP/USD around 1.3415; Stop loss: 1.3405; Target: 1.3460; 1.3470
USD/JPY
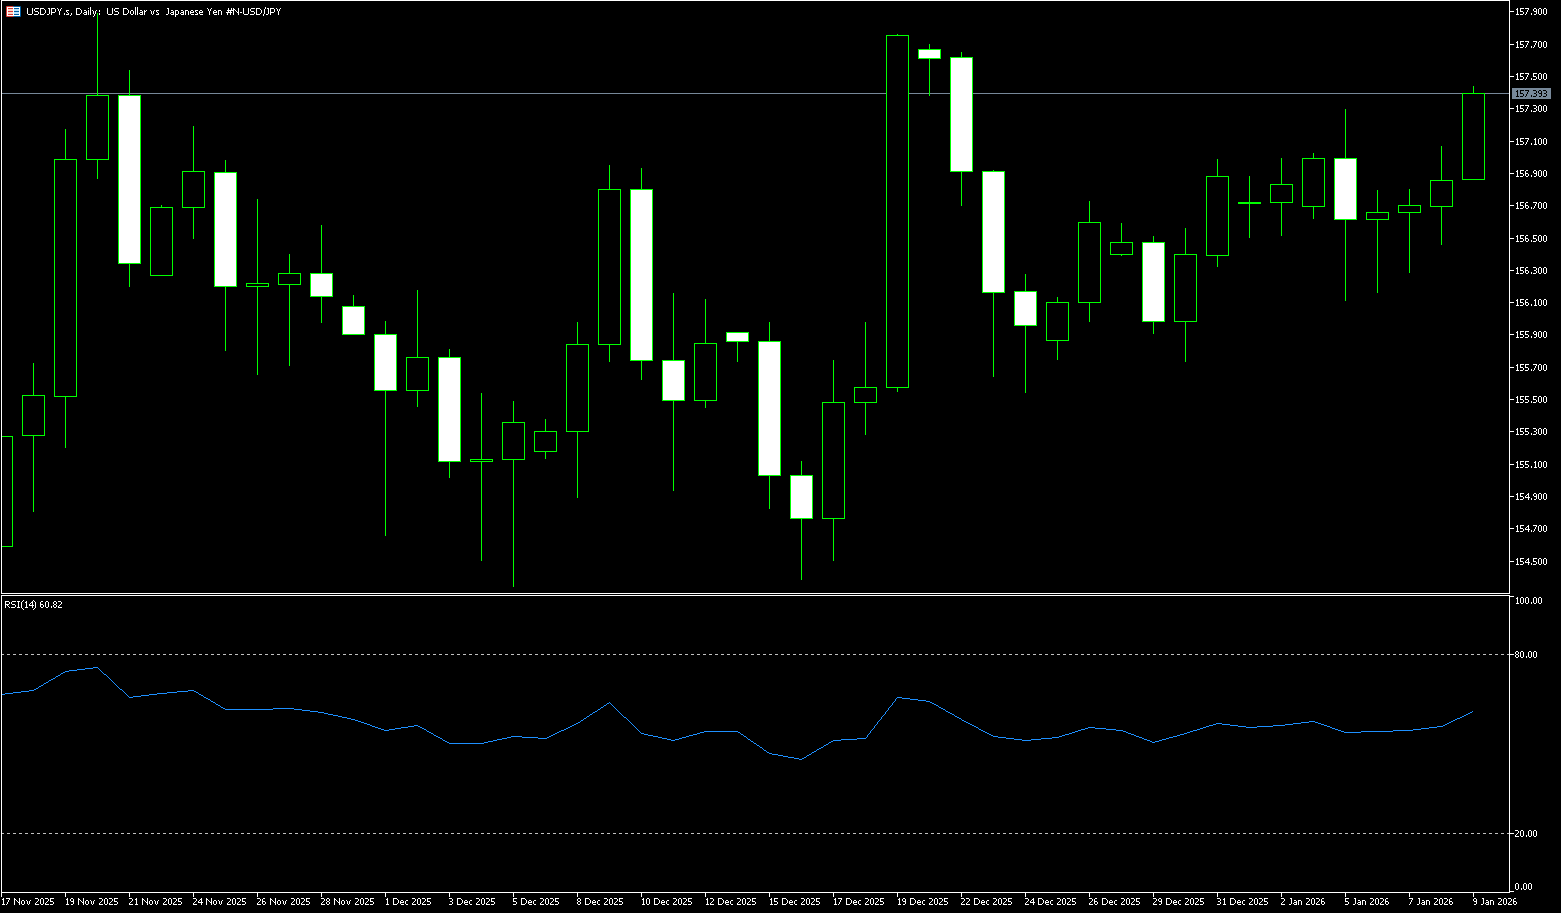
The yen weakened to above 159 yen per dollar on Tuesday, its lowest level since mid-2024, due to rising political uncertainty and rumors that Prime Minister Sanae Takashi might dissolve parliament as early as next month. Takashi is expected to leverage her strong public support to push forward with expansionary fiscal policies. Meanwhile, Japanese Finance Minister Satsuki Katayama stated in May that she and US Treasury Secretary Scott Bessenter expressed concern about the yen's "unilateral depreciation" during a bilateral meeting on the sidelines of this week's multilateral finance ministers' meeting. Katayama also pointed to Beijing's export restrictions on items crucial to Japan's military, including key minerals. On the currency front, the market remains divided on the timing of the Bank of Japan's next interest rate hike, as the latest economic data continues to present a complex picture.
Overall, USD/JPY is in a "catalyst-awaiting" phase. An upward breakout requires stronger drivers, such as a rebound in inflation or expectations of the Bank of Japan further delaying interest rate hikes; a downward correction depends on a convergence of weakening US data and improved yen fundamentals. In the absence of a clear direction, the 159.50 level and the 160.00 (psychological level) will be important anchors for short-term trading. Technically, the USD/JPY daily chart structure remains bullish. The price has repeatedly tested the previous high area, with the most recent high marked at 158.48 (Tuesday's high), indicating that this level has become a clear psychological and technical resistance zone. Support is concentrated around the 158.00 level, a crucial watershed. If the price retraces but does not break this level, the bullish trend remains intact; however, a decisive break below this level followed by further declines could lead to a pullback to 157.50 or even lower.
Consider shorting the US dollar around 159.35 today; Stop loss: 159.50; Target: 158.30, 158.10
EUR/USD
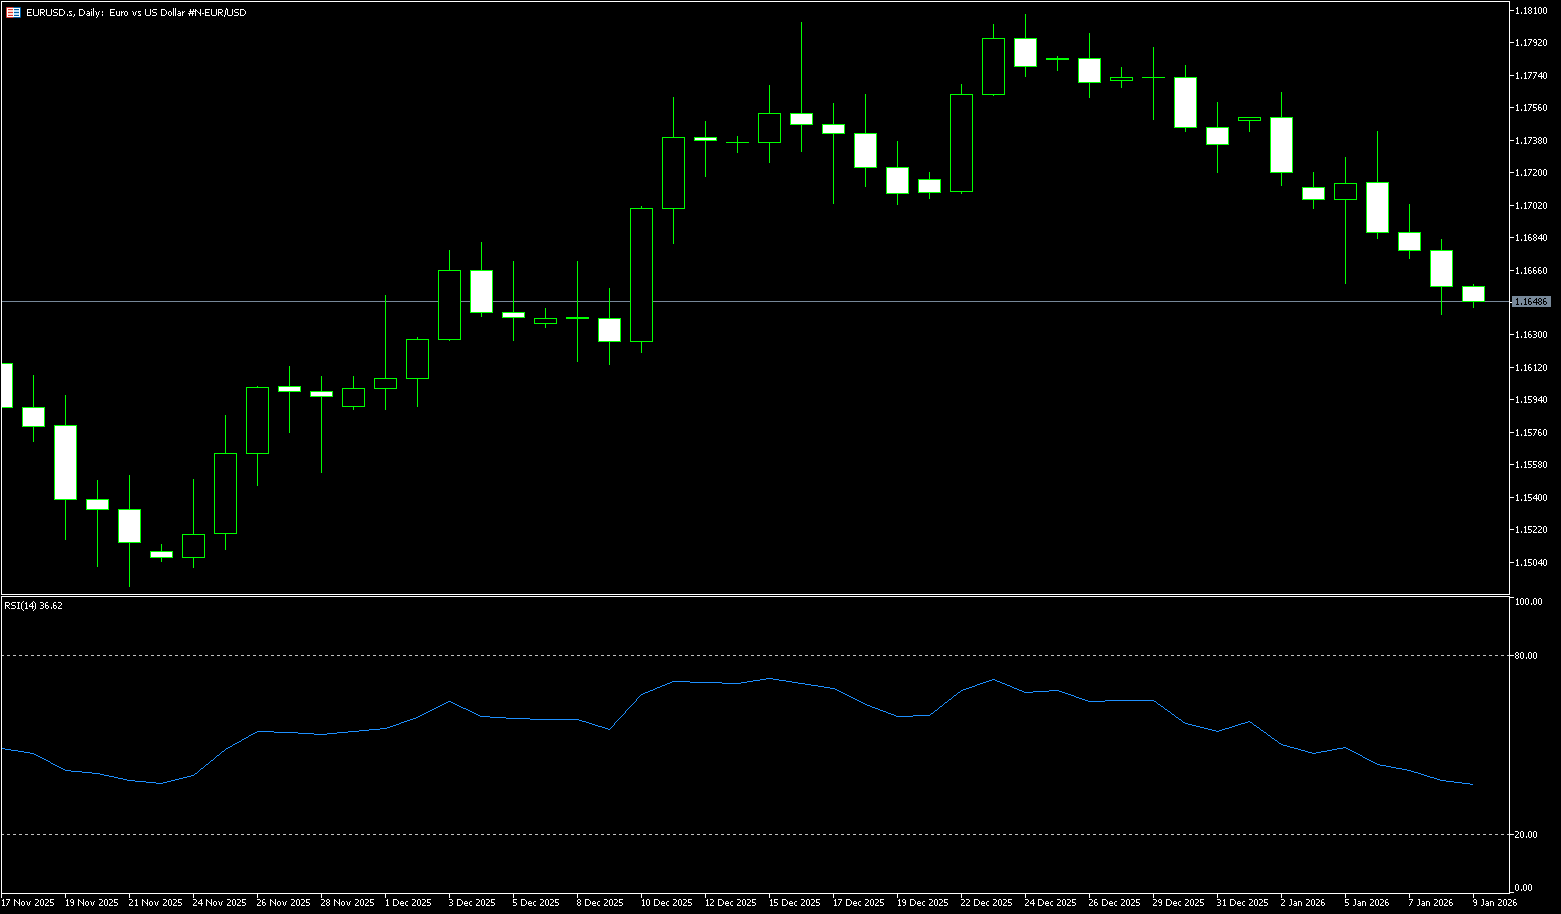
On Tuesday, the EUR/USD pair remained stable around 1.1650. Traders digested news that the Trump administration had threatened to sue the Federal Reserve, after Fed Chairman Powell stated on Sunday that he was facing a criminal investigation. Political risks surrounding the US central bank could put pressure on the dollar and create tailwinds for the pair. The open war between the Fed and the US government is clearly not a good sign for the dollar. Signs that the European Central Bank seems to be nearing the end of its rate-cutting cycle could provide some support for the euro. ECB Vice President Louis de Guindos stated last week that interest rates were at an appropriate level, but warned of “significant uncertainty” due to geopolitical risks. Financial markets currently have limited room for immediate action, and rates are expected to remain unchanged at the next meeting, although a rate hike is considered unlikely given the weak inflation backdrop.
From a technical perspective, the EUR/USD pair retreated after reaching a high of 1.1807 on the daily chart, hitting a low of 1.1617 before rebounding. Strong resistance lies at 1.1750; a hold above this level could lead to a retest of previous highs. Support is seen at last week's low of 1.1617; a break below this level could lead to a return to lower levels. The MACD indicator shows a DIFF of 0.0002, a DEA of 0.0018, and a histogram of -0.0032, indicating that downward momentum has not completely subsided. The RSI is around 42.37, in a slightly bearish zone, suggesting a higher probability of range-bound trading in the short term. The first support level for EUR/USD is 1.1600 (a psychological level). A break below this level would expose the 200-day simple moving average support at 1.1578, which is the last line of defense for the bulls, after which the pair would turn bearish. Additionally, if the price breaks through the psychological level of 1.1700, the next resistance level is 1.1762 (this year's high).
Today, consider going long on the Euro around 1.1630; Stop loss: 1.1620; Targets: 1.1675, 1.1685
Disclaimer: The information contained herein (1) is proprietary to BCR and/or its content providers; (2) may not be copied or distributed; (3) is not warranted to be accurate, complete or timely; and, (4) does not constitute advice or a recommendation by BCR or its content providers in respect of the investment in financial instruments. Neither BCR or its content providers are responsible for any damages or losses arising from any use of this information. Past performance is no guarantee of future results.
Lebih Liputan


Pendedahan Risiko:Instrumen derivatif diniagakan di luar bursa dengan margin, yang bermakna ia membawa tahap risiko yang tinggi dan terdapat kemungkinan anda boleh kehilangan seluruh pelaburan anda. Produk-produk ini tidak sesuai untuk semua pelabur. Pastikan anda memahami sepenuhnya risiko dan pertimbangkan dengan teliti keadaan kewangan dan pengalaman dagangan anda sebelum berdagang. Cari nasihat kewangan bebas jika perlu sebelum membuka akaun dengan BCR.
BCR Co Pty Ltd (No. Syarikat 1975046) ialah syarikat yang diperbadankan di bawah undang-undang British Virgin Islands, dengan pejabat berdaftar di Trident Chambers, Wickham’s Cay 1, Road Town, Tortola, British Virgin Islands, dan dilesenkan serta dikawal selia oleh Suruhanjaya Perkhidmatan Kewangan British Virgin Islands di bawah Lesen No. SIBA/L/19/1122.
Open Bridge Limited (No. Syarikat 16701394) ialah syarikat yang diperbadankan di bawah Akta Syarikat 2006 dan berdaftar di England dan Wales, dengan alamat berdaftar di Kemp House, 160 City Road, London, City Road, London, England, EC1V 2NX. Entiti ini bertindak semata-mata sebagai pemproses pembayaran dan tidak menyediakan sebarang perkhidmatan perdagangan atau pelaburan.

 English
 简体中文
简体中文
 繁體中文
繁體中文
 Bahasa
Melayu
Bahasa
Melayu
 Tiếng
Việt
Tiếng
Việt
 ไทย
ไทย
 日本語
日本語
 한국어
한국어
 ភាសាខ្មែរ
 español