


0
US Dollar Index
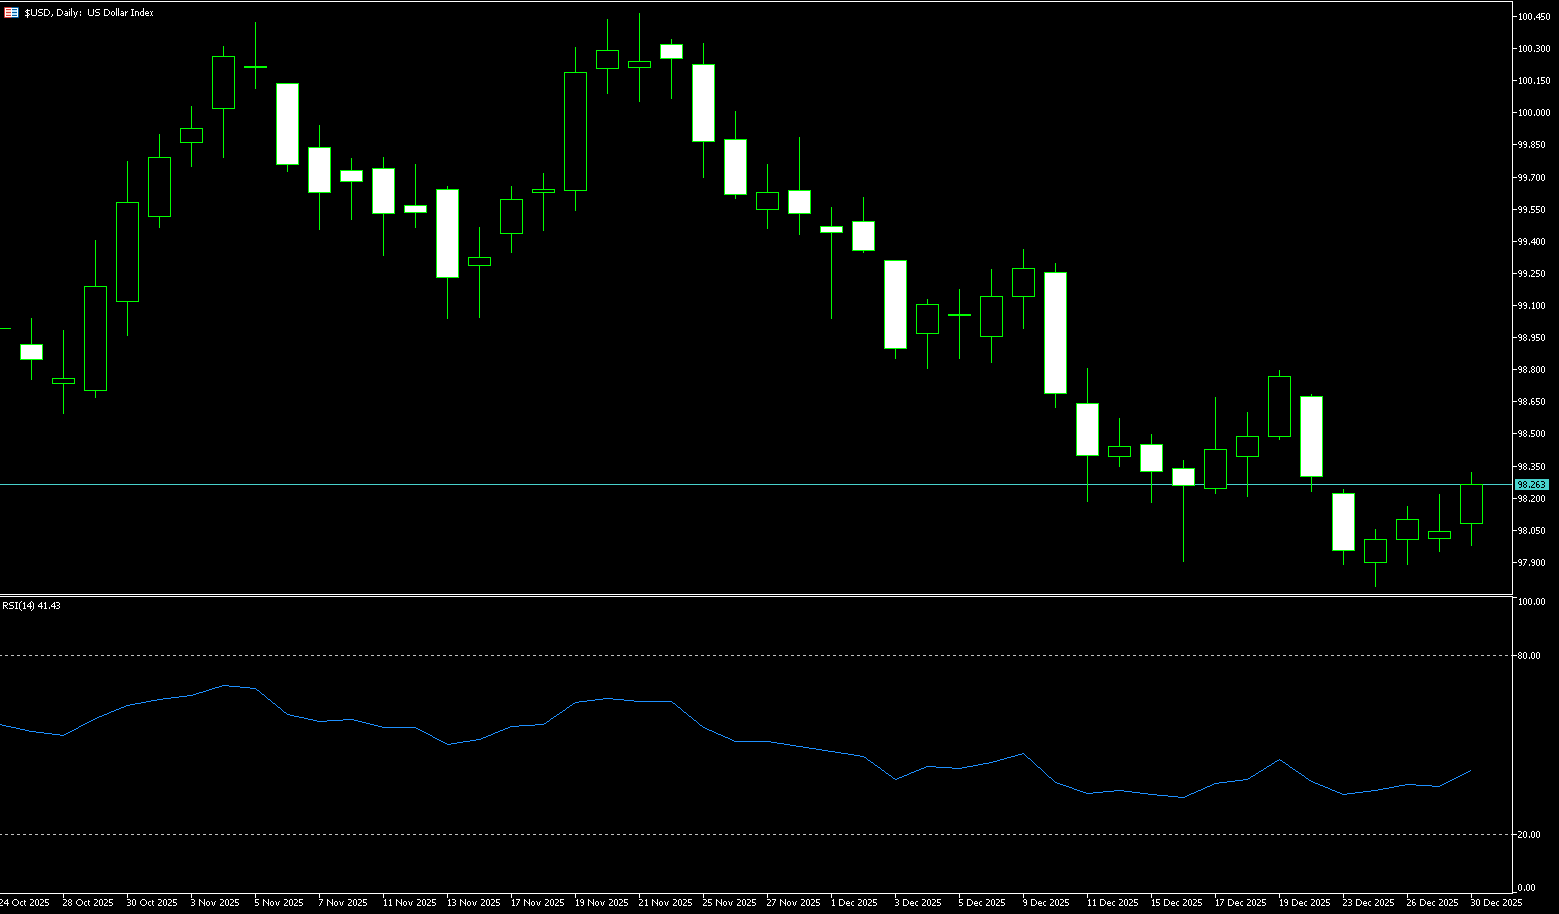
The dollar rose to around 98.20 on Tuesday, but remained near its lowest level since early October, as investors digested the minutes of the Federal Reserve's December meeting. The minutes showed that most Fed officials favored further rate cuts next year if inflation continued to slow, reinforcing expectations of an accommodative monetary policy stance. They also highlighted internal divisions within the Fed, underscoring the difficulty of the decision to cut rates by 25 basis points earlier this month. Political uncertainty added pressure to the dollar as President Donald Trump indicated he had a preferred candidate to replace Fed Chairman Powell and hinted at the possibility of removing him. Overall, the dollar has fallen about 9.6% this year, its steepest annual decline since 2017, driven by expectations of rate cuts, a narrowing yield advantage, trade policy uncertainty, fiscal concerns, and questions about the Fed's independence.
On Tuesday (December 30th), the dollar index fluctuated around 98.20. The dollar has clearly lost some of its luster. Momentum weakened, confidence wavered, and the Fed failed to provide traders with the clear roadmap they had been hoping for. However, the situation is not static. Some officials remain hawkish, which is enough to provide some short-term support for the dollar amid market jitters. Technically, after a brief break above 100.00 in November, the dollar index has entered a correction phase and is currently struggling to regain its footing. For the overall outlook to become clearly bullish again, the index first needs to reclaim the 200-day simple moving average at 98.99. After that, attention will turn to the December 9 high of 99.32. On the downside, initial support lies at the December 24 low of 97.75 (December 11). A sustained break below this level could open the way to the 97.46 (October 1) low.
Today, consider shorting the US Dollar Index around 98.35; Stop loss: 98.45; Target: 97.90; 97.85
WTI Crude Oil
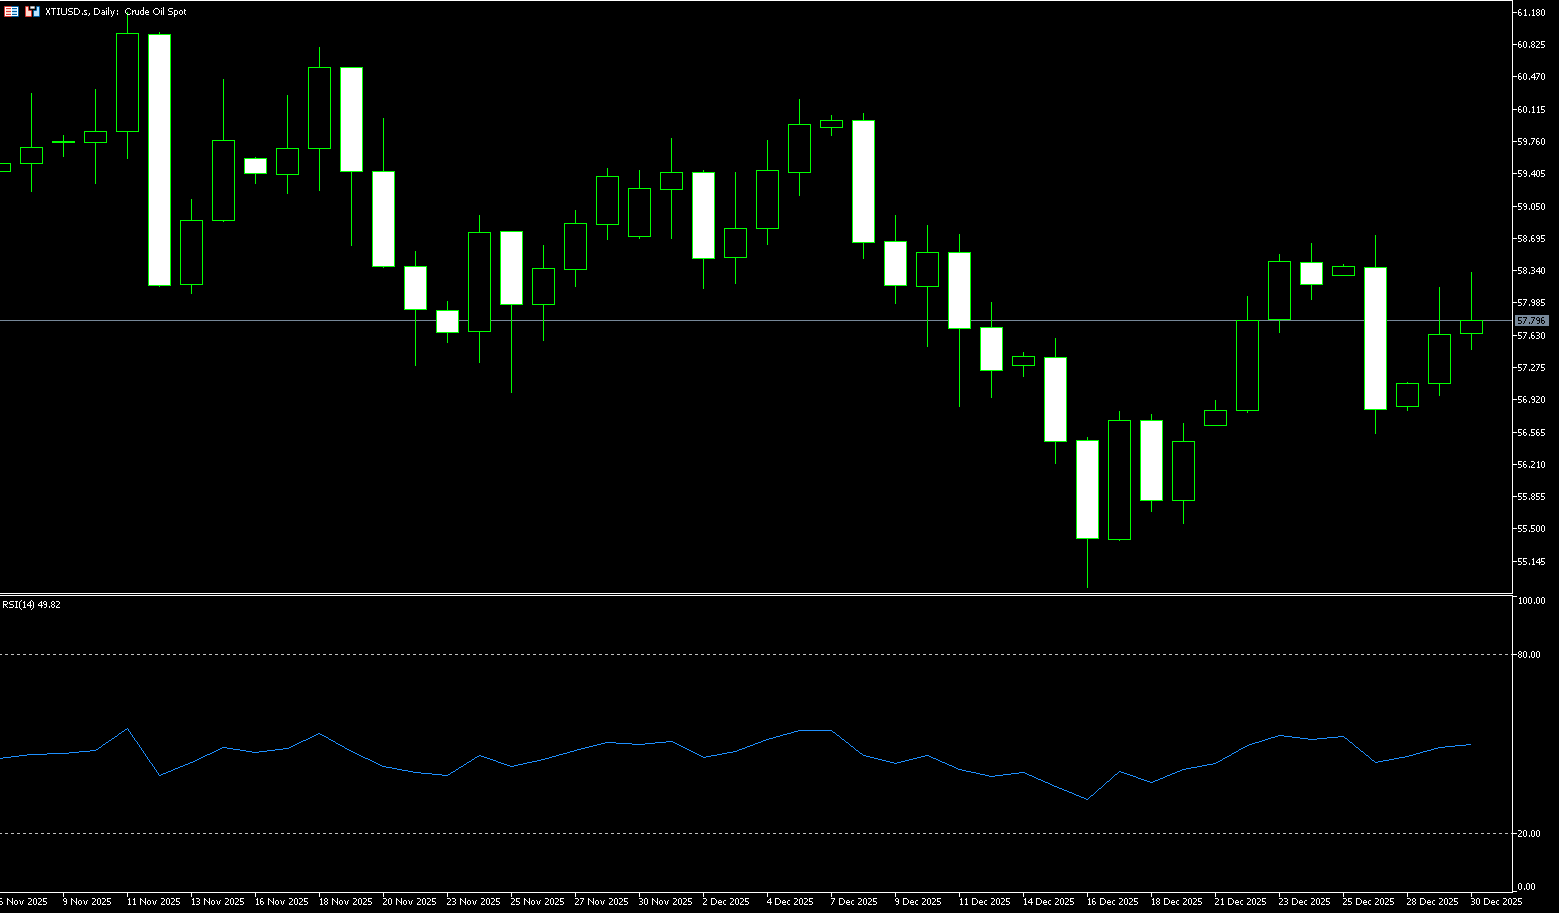
US crude oil is trading around $57.80 per barrel. International oil prices rose at the beginning of the week, with new developments in the conflict between Russia and Ukraine, and escalating tensions in Yemen raising concerns about Middle Eastern oil supplies, all contributing to a rise in market risk premiums. WTI prices have seen an upward trend. After a sharp drop in oil prices last week, the market chose to start this rebound from the low of $54.88, with bullish forces continuously entering the market. The current bottoming pattern of oil prices has solid structural support—the key 50% retracement level of $56.86 successfully stopped the decline in oil prices last Friday, directly driving the start of the rebound. However, it should be noted that the crude oil market is still under pressure from multiple resistance levels. Only by breaking through these resistance levels can the current downward trend be reversed and a strong breakout rally driven by oil prices be achieved.
From a technical perspective, the medium-to-long-term downtrend of WTI crude oil has not yet reversed, but short-term upward momentum has slightly picked up. Its short-term price range is between $54.88 (December 16th low) and $58.78 (last week's high). The key resistance levels for this rebound are concentrated at two points: $58.78 (last week's high) and $58.88 (the 50-day moving average). The 50-day moving average is not only a key level of market attention but also a core indicator for large institutional bullish positions. Due to the holidays this week, trading hours are shorter. For oil prices to stabilize above the 50-day moving average and initiate a medium-to-long-term rebound, substantial buying support is necessary; otherwise, this attempt to break through will likely fail. For bearish traders, if the buying power weakens, oil prices will break below the key support of $55.72 (December 18th low) and will likely retest the previous low of $54.88 in the short term.
Today, consider going long on crude oil around 57.68; Stop loss: 57.50; Target: 58.90; 59.20
Spot Gold
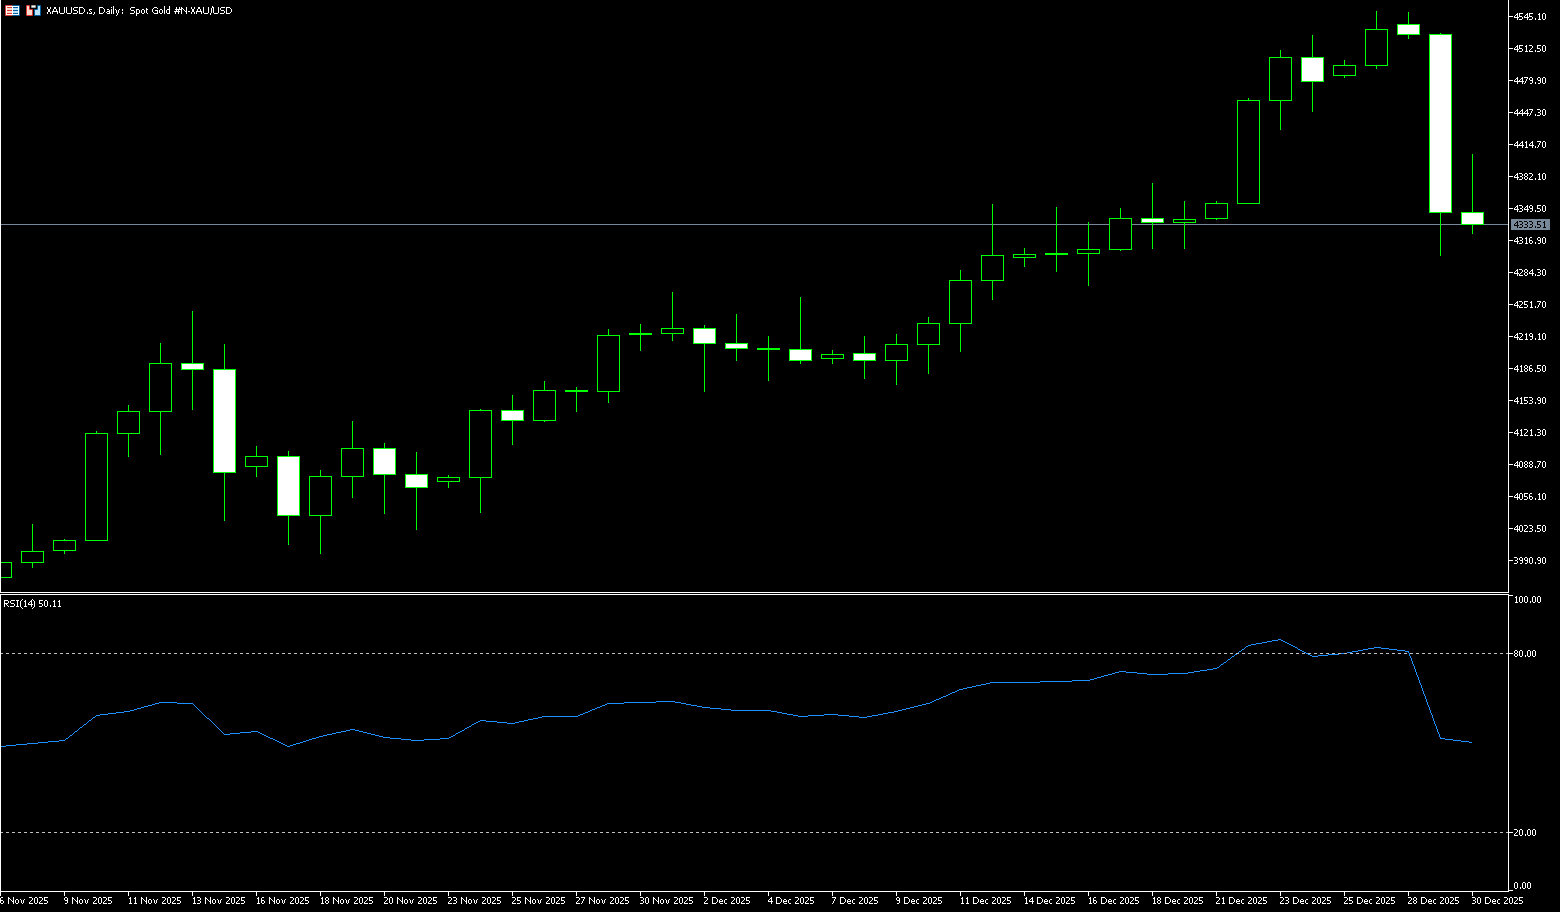
Gold prices rose above $4,350 per ounce on Tuesday after falling more than 4% due to profit-taking. Monday's sell-off marked the metal's biggest intraday drop since October and its second major single-day decline this year. Nevertheless, gold's appeal as a safe-haven asset remains strong amid ongoing geopolitical uncertainty. Peace talks between Russia and Ukraine were further questioned after reports that President Putin informed President Trump that Moscow would reassess its negotiating position, following a alleged attack on Putin's residence by Ukraine. Trump warned of further strikes against Iran if it continues its nuclear reconstruction efforts and announced that the US had attacked a drug-related facility in Venezuela. Gold bars continue to move toward their strongest annual performance since 1979, a rally supported by strong central bank purchases, continued ETF inflows, and expectations of further US interest rate cuts.
From a technical perspective, the decline in gold prices at the beginning of the week was a corrective pullback, and the overall upward trend remains unchanged. Although gold has suffered some short-term technical damage, the situation is not serious. However, if strong selling pressure emerges on Tuesday or Wednesday, it could lead to more severe technical damage, which would clearly suggest that the market may have reached a short-term top. From a technical perspective, for gold bulls in February, the next upside target is to push the contract price above the key resistance level of $4,549.80/oz (the all-time high); the short-term downside target for bears is to push the price below the key technical support level of $4,200.00. The first resistance level is currently at $4,394 (10-day simple moving average) and $4,400 (psychological level), with further resistance at $4,456 (5-day simple moving average). The first support level is at Monday's low of $4,303.00 and the $4,300 psychological level, with further support at $4,254 (30-day simple moving average).
Consider going long on spot gold today around $4,340; Stop loss: $4,335; Target: $4,380; $4,370
AUD/USD
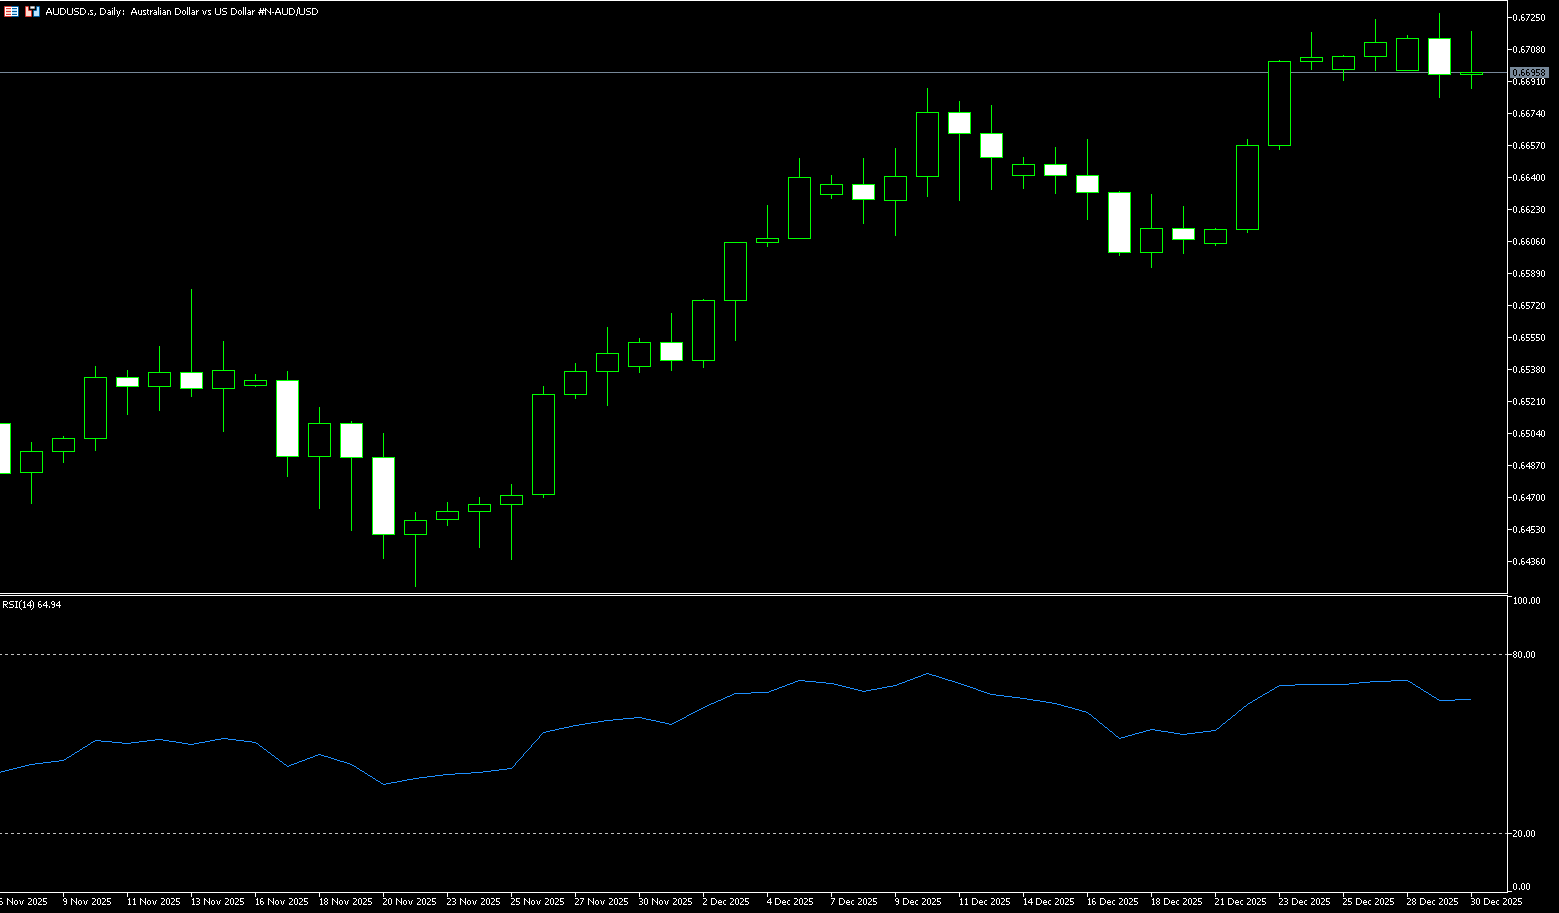
At the beginning of the week, the Australian dollar continued its strong upward trend against the US dollar, climbing to a 14-month high of 0.6727 on Monday. It maintained high-level consolidation on Tuesday, consolidating its year-end rebound. Looking back at recent performance, the Australian dollar recorded a significant 1.6% gain last week, not only reaching a high of 0.6727 but also marking its largest weekly increase since April. Its year-to-date gain has reached 8.5%, successfully ending a four-year losing streak and becoming a standout commodity currency in the 2025 foreign exchange market. The Reserve Bank of Australia's (RBA) December policy meeting minutes were the core catalyst for the exchange rate's rise: board members' confidence in the current monetary policy being "sufficiently restrictive" weakened significantly, and they clearly stated that if inflation fails to fall as expected, policy tightening will be initiated at any time. This stance has pushed market expectations for interest rate hikes forward, and the industry is now widely focused on the fourth-quarter CPI data to be released on January 28th—if core inflation rises more than expected, it will provide direct evidence for an interest rate hike at the February 3rd meeting.
The Australian dollar/US dollar pair rose to a 14-month high of 0.6727 on Monday and maintained its strength on Tuesday, consolidating its year-end rebound. The pair remains above the rising 10-day simple moving average of 0.6669, maintaining a short-term upward trend and favoring higher lows. The 14-day Relative Strength Index (RSI) on the daily chart is near 65, confirming positive momentum. As long as the price remains above the moving averages, pullbacks will be manageable, and the bias remains bullish. Trend conditions remain solid, as the 10-day simple moving average {0.6669} continues to slope upwards, with support within the 30-day simple moving average range of 0.6603–0.6669. The RSI has not yet reached overbought levels, leaving room for an extension to 70. A close above this week's high of 0.6727 would open the door to further gains, targeting the October 7 high of 0.6810.
Consider going long on the Australian dollar today near 0.6680; Stop loss: 0.6670; Target: 0.6730. 0.6735
GBP/USD
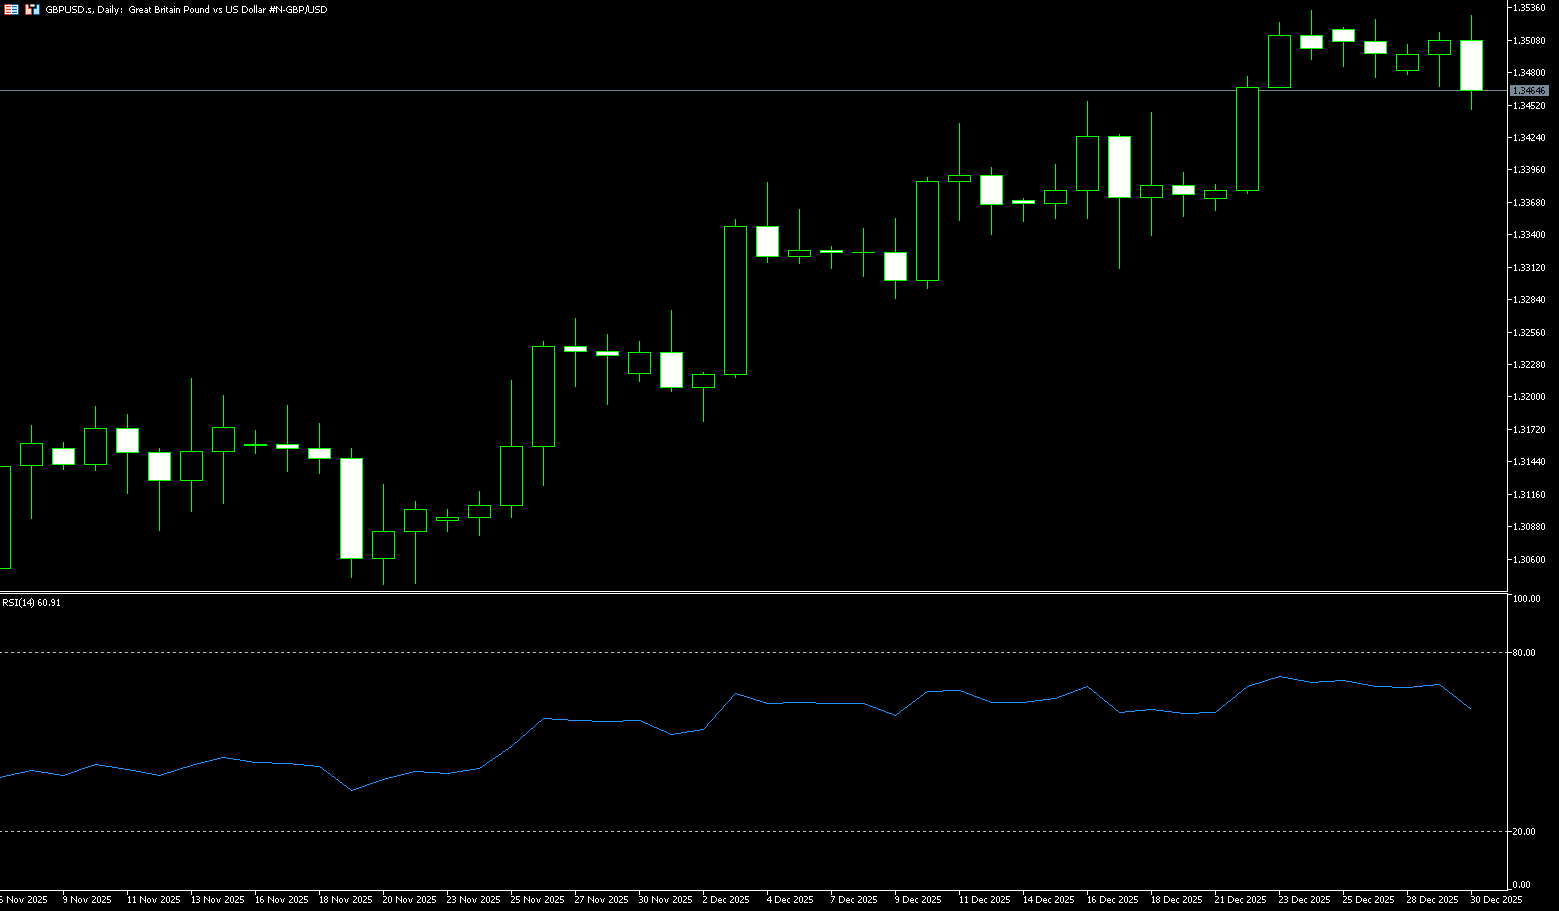
Amid thin trading due to the year-end holidays, the pound remained relatively stable against the dollar, holding steady slightly below the 1.3500 level. The market is focused on the latest guidance from the Federal Reserve meeting minutes regarding policy expectations, but insufficient liquidity may limit a directional breakout in the short term. As 2025 enters its final trading week, overall trading in the foreign exchange market has become thin, but the pound/dollar pair remains at a relatively high level. Currently, the exchange rate is stable above the 1.3500 level, showing a short-term bullish bias; however, the year-end holiday factor lacks sufficient momentum to drive further gains. Trading volume drove the exchange rate to break out clearly in either direction. From a fundamental perspective, UK macroeconomic data this week is relatively scarce, lacking key economic indicators with directional guidance; short-term movements depend more on changes in the US dollar. Market focus shifts to the upcoming release of the Federal Reserve meeting minutes. In an environment of weak liquidity, these minutes will be the last crucial window this year to observe the Fed's internal policy discussions.
The year-end movement of the pound against the dollar resembles a "patience game." Bulls hold a structural advantage, but insufficient liquidity limits upside potential. From a daily chart perspective, the pound against the dollar maintains a high-level consolidation pattern within a medium-term upward trend: The exchange rate continues to trade within an upward channel with limited pullbacks, indicating that the bullish structure remains intact. The price is firmly above the 20-day and 50-day moving averages, and the short-term moving averages are in a bullish alignment, providing support. The first support level is 1.3452 (the 61.8% Fibonacci retracement level from the high of 1.3726 to the low of 1.3010), followed by the 1.3400 level. A break below this level could trigger a deeper technical correction. On the upside, watch for resistance at the 78.6% Fibonacci retracement level at 1.3572, as well as the psychological level of 1.3600. Further resistance lies at 1.3650, near the year's high.
Today, consider going long on GBP around 1.3455; Stop loss: 1.3445; Target: 1.3500. 1.3510
USD/JPY
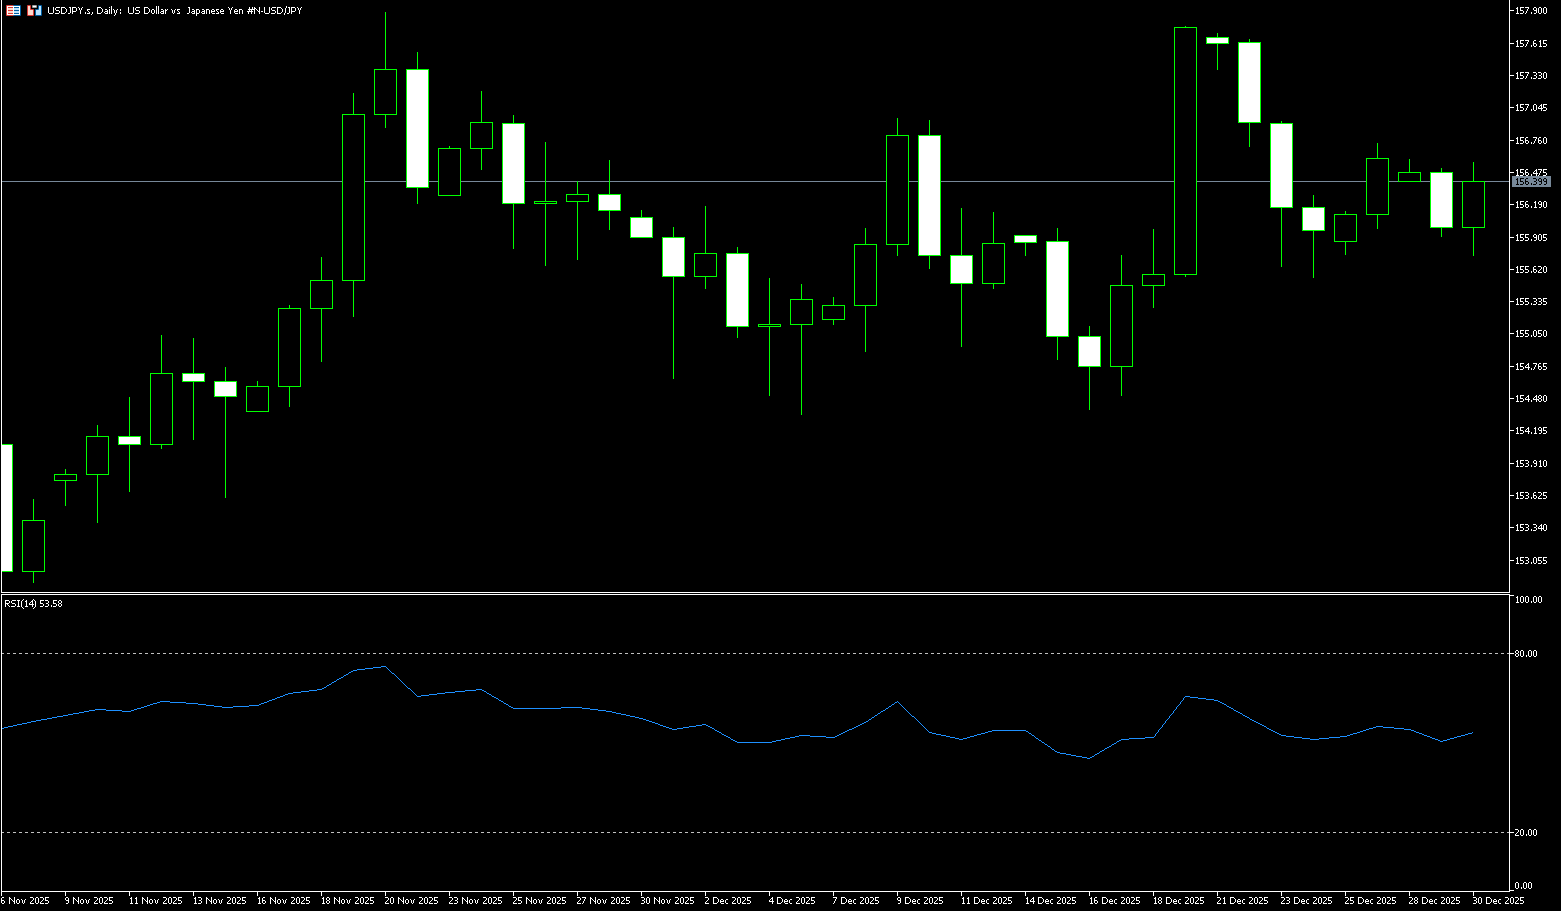
USD/JPY reversed direction in the final week of the trading year, falling back to the 156.00 area, reducing the bullish momentum from the end of last week. Increased overall volatility is expected in the final week of trading in 2025 and into early 2026, as reduced market volume due to holidays will impact overall market trends. The yen market has not yet reached a point requiring direct intervention, but the risk remains that the Bank of Japan will again directly intervene in the market to support the yen. Japanese Finance Minister Satsuki Katayama reiterated last week that the Bank of Japan has "free rein" in dealing with any "excessive volatility" in the yen market. The Fed's latest interest rate decision has sparked some exciting discussions as they implemented their third consecutive rate cut. According to their latest bitmap, policymakers expect interest rates to gradually ease. Two additional interest rate cuts are predicted within the next two years.
From a daily chart perspective, the USD/JPY pair entered a consolidation phase after a rapid rise, recently fluctuating repeatedly within the 155-158 range, with significantly weakened momentum. The candlestick pattern shows increasing upper shadows at higher levels, reflecting increased selling pressure. Regarding the moving average system, short-term moving averages are flattening and showing signs of turning downwards, while medium-term moving averages remain upward, suggesting the exchange rate is in a transitional phase from strong to weak. The RSI indicator has fallen from its high to around 53, moving out of the overbought zone, indicating that the bullish advantage is weakening. If it breaks below 155.44 (the 45-day moving average), it may open up further downside potential to the 155.00 level; conversely, only by regaining a foothold above the weekly high of 156.58 can the exchange rate resume its upward trend to the 157.00 level.
Today, consider shorting the USD near 156.62. Stop loss: 156.80; Target: 155.80; 155.60
EUR/USD
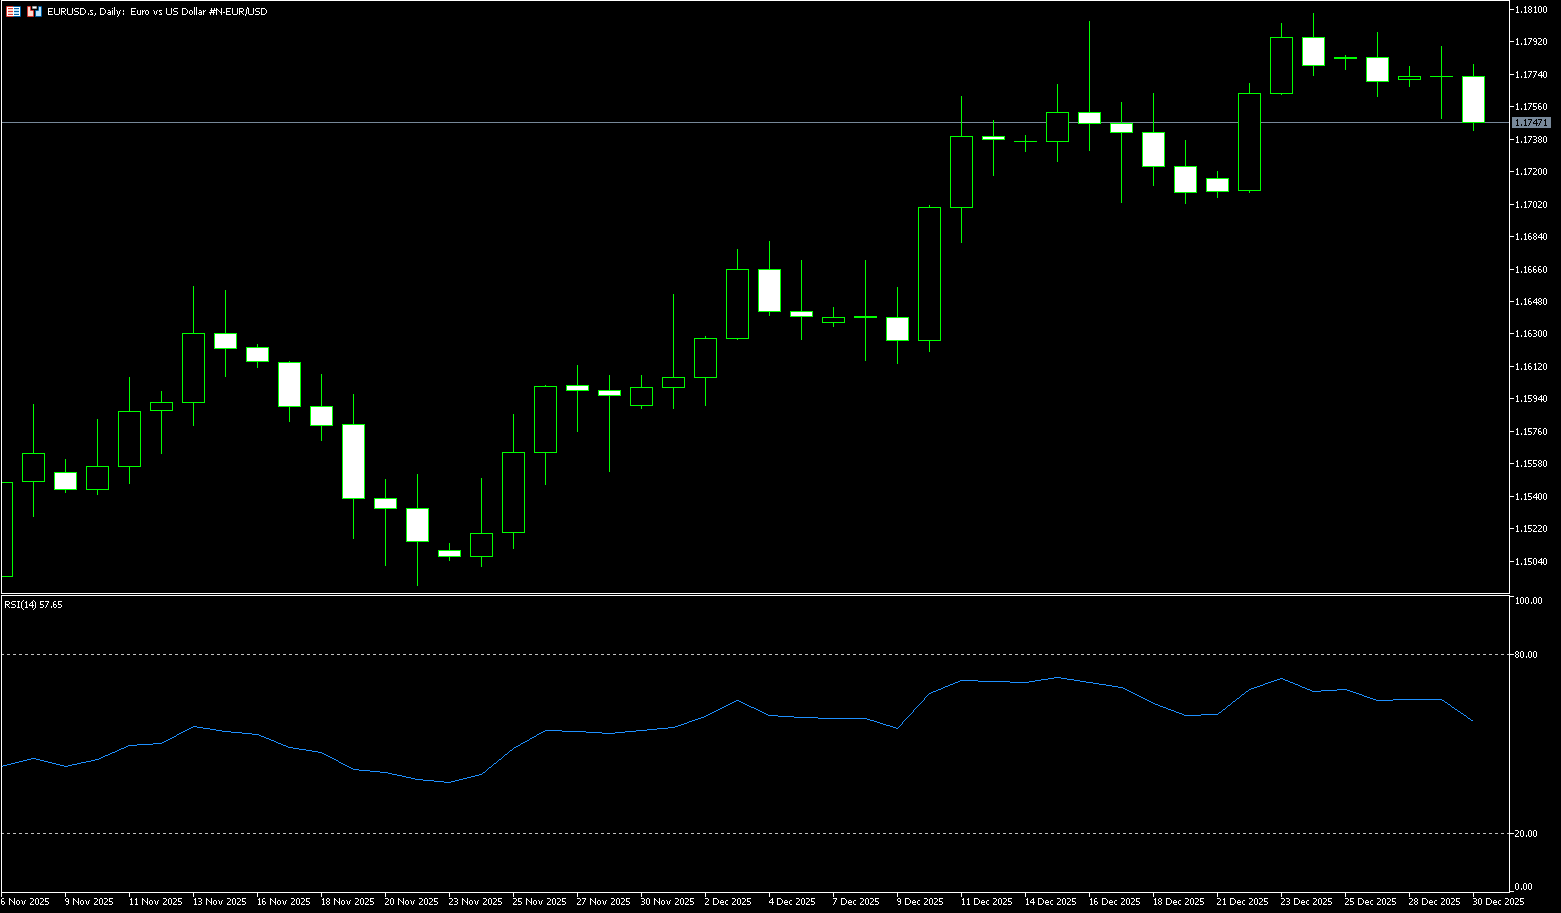
Early Week The euro continued its decline against the dollar, falling for the third consecutive trading day. Last week, the exchange rate briefly rose above 1.1800, reaching a new high, but subsequently experienced significant profit-taking, shifting from a "surge" to a "pullback" as the market repriced in event and policy expectations. The recent euro pullback is directly related to the dollar finding more stable buying support in a relatively thin liquidity environment. The market remains cautious about the future developments in geopolitical situations, and when risk appetite declines, the dollar tends to gain a safe-haven premium, thus suppressing the euro's upward momentum. The euro therefore lacks the fuel for further price increases. A more important variable is policy expectations. This week, the market focus is on the minutes of the Fed's December meeting. Meanwhile, the ECB's relatively cautious stance still provides some support for the euro in the medium term.
Observing the 240-minute candlestick chart, the euro/dollar pair has experienced a relatively smooth upward trend since stabilizing at a low of 1.1702, twice testing above 1.1800. The price formed two highs, 1.1803 and 1.1807 respectively. After failing to break through these highs effectively, the exchange rate entered a pullback and is currently around 1.1750. Structurally, the double top above 1.1800 resembles a short-term "double top" pattern, indicating concentrated supply above and a slowdown in buying pressure, shifting the price from an upward trend to a pullback. Key support lies at 1.1730, a level that coincides with a previous area of high trading volume and a potential pullback target. A break below this level would be crucial. The exchange rate may return to the low-level consolidation zone around 1.1715, and in extreme cases, a retest of the 1.1700 level cannot be ruled out. On the upside resistance front, the first short-term focus is on the 1.1800 level (a psychological level), above which lies the "double top" pattern formed by the previous highs of 1.1803 and 1.1807. Only if a subsequent breakout with significant volume or an engulfing pattern occurs and 1.1780 is recovered would the exchange rate appear to have completed a "second upward move after the pullback."
Today, consider going long on the Euro around 1.1735; Stop loss: 1.1725; Target: 1.1780; 1.1790
Disclaimer: The information contained herein (1) is proprietary to BCR and/or its content providers; (2) may not be copied or distributed; (3) is not warranted to be accurate, complete or timely; and, (4) does not constitute advice or a recommendation by BCR or its content providers in respect of the investment in financial instruments. Neither BCR or its content providers are responsible for any damages or losses arising from any use of this information. Past performance is no guarantee of future results.
More Coverage


Risk Disclosure:Derivatives are traded over-the-counter on margin, which means they carry a high level of risk and there is a possibility you could lose all of your investment. These products are not suitable for all investors. Please ensure you fully understand the risks and carefully consider your financial situation and trading experience before trading. Seek independent financial advice if necessary before opening an account with BCR.
BCR Co Pty Ltd (Company No. 1975046) is a company incorporated under the laws of the British Virgin Islands, with its registered office at Trident Chambers, Wickham’s Cay 1, Road Town, Tortola, British Virgin Islands, and is licensed and regulated by the British Virgin Islands Financial Services Commission under License No. SIBA/L/19/1122.
Open Bridge Limited (Company No. 16701394) is a company incorporated under the Companies Act 2006 and registered in England and Wales, with its registered address at Kemp House, 160 City Road, London, City Road, London, England, EC1V 2NX. This entity acts solely as a payment processor and does not provide any trading or investment services.

 English
 简体中文
简体中文
 繁體中文
繁體中文
 Bahasa
Melayu
Bahasa
Melayu
 Tiếng
Việt
Tiếng
Việt
 ไทย
ไทย
 日本語
日本語
 한국어
한국어
 ភាសាខ្មែរ
 español