


0
US Dollar Index
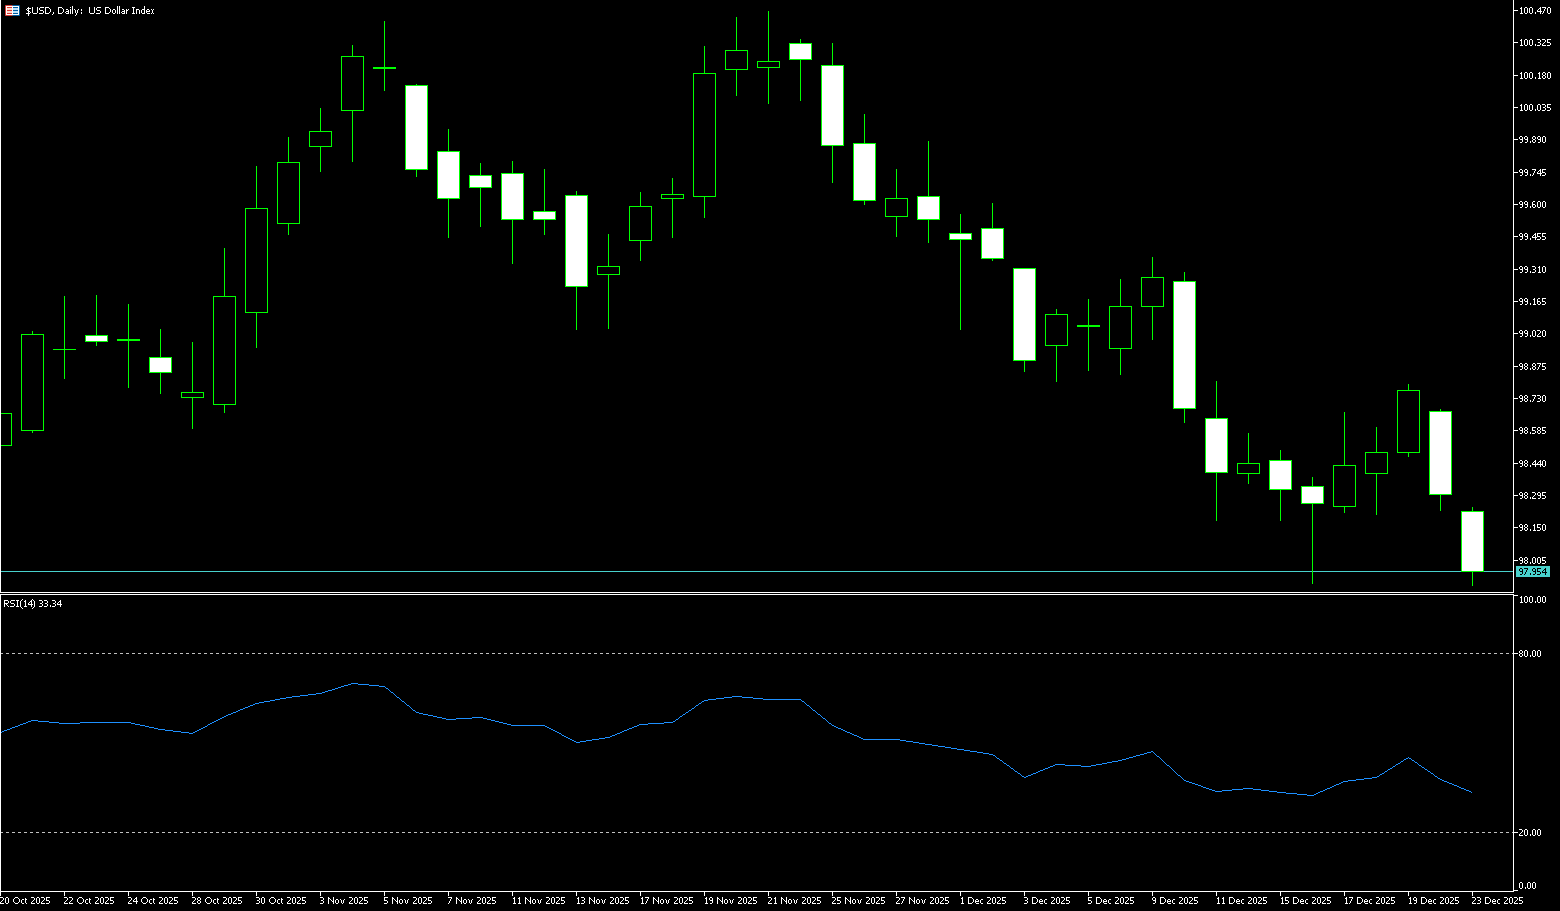
The US dollar index fell below 98 to around 97.80 on Tuesday, its lowest level since early October, influenced by rising market expectations of further interest rate cuts by the Federal Reserve. The yen rebounded technically against the dollar on Monday after strong signals of intervention from Japanese officials, ending its recent losing streak. The dollar index continued its decline, poised for its biggest annual drop since 2017. The dollar weakened overall, with the dollar index falling 0.4% to 98.30, mainly dragged down by declines against the yen and euro. This was primarily due to the continued escalation of market expectations for further interest rate cuts by the Federal Reserve next year, which dampened the dollar's appeal. In contrast, the euro and pound both rose against the dollar, with the pound gaining 0.6% to $1.3458. After three days of gains, the dollar index traded around 98.20 in Asian trading on Tuesday. The dollar may regain its lost position due to cautious sentiment regarding the Fed's policy outlook. Traders are also watching for further comments from US President Trump that the next Fed chairman will be someone who believes in significant interest rate cuts.
The US dollar index is currently trading slightly below 98.00, appearing to have halted its three-day winning streak, retreating from a one-week high reached last Friday. The 100-day simple moving average is flattening at 98.60, after previously rising, and the price is now below that level. This alignment maintains a slightly bearish bias, as the moving average acts as short-term resistance. A daily close above the 100-day simple moving average would ease pressure, while failure to return to that level would maintain downside risk. Meanwhile, the MACD line remains below the signal line and in zero, although it is gradually rising, suggesting easing bearish pressure. Furthermore, the Relative Strength Index (RSI) is at 33.60, below the 50 midline, reflecting weak momentum. A decisive break above the 100-day simple moving average at 98.61 would shift focus to the psychological level of 99.00. Failure to break through would maintain seller dominance until the US dollar index reaches 97.87 on December 16th, while a break below that level would target 97.46 on October 1st.
Consider shorting the US dollar index near 98.00 today; Stop loss: 98.10; Target: 97.60; 97.50
WTI Crude Oil
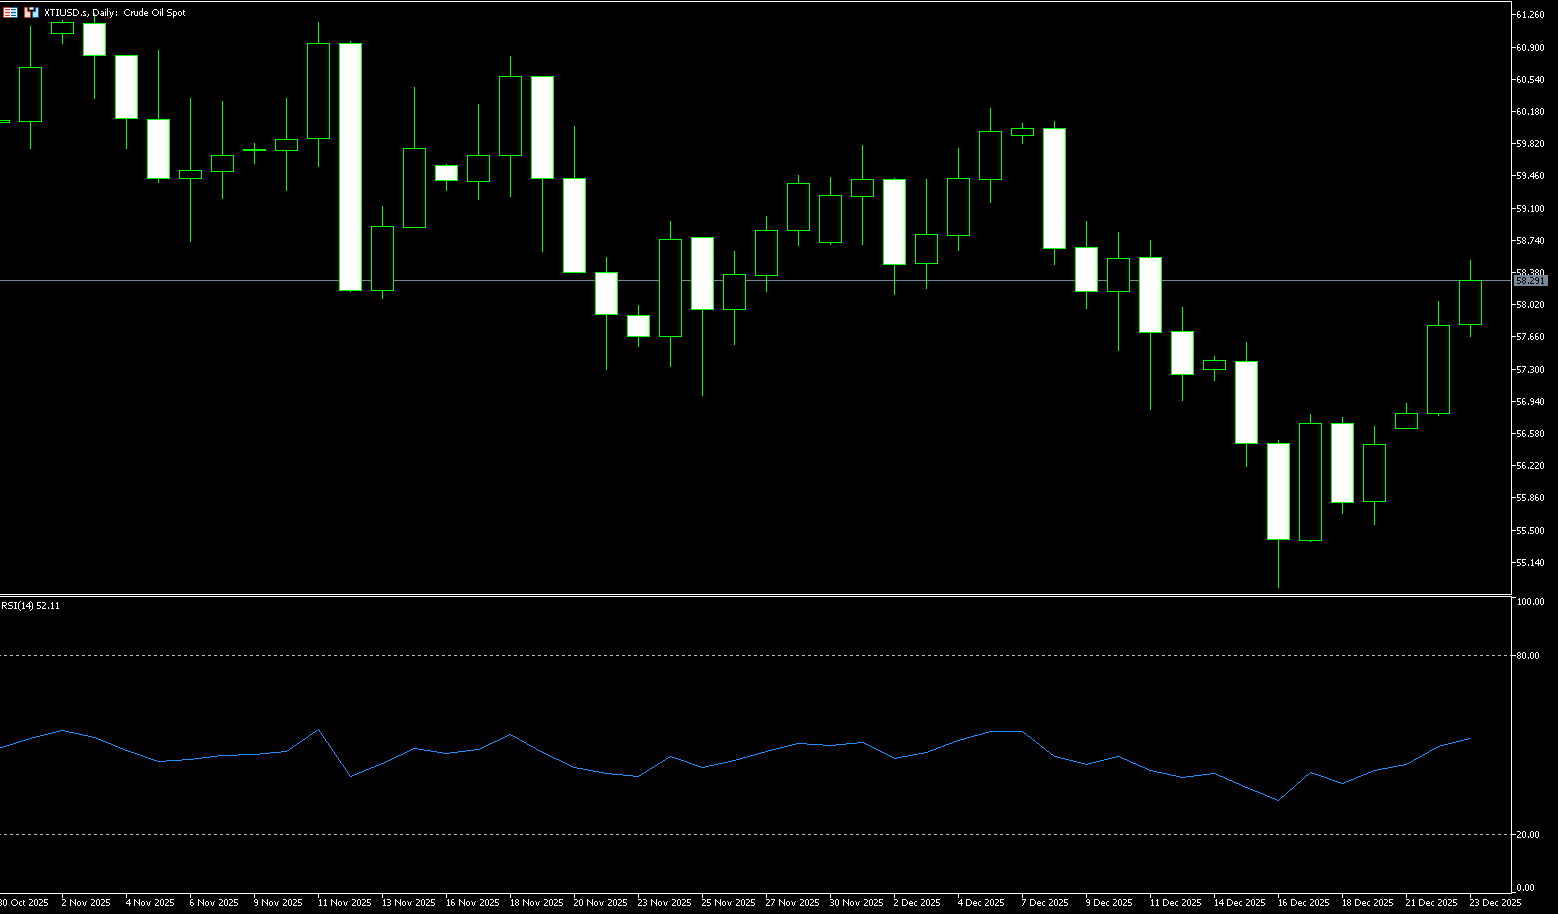
WTI crude oil is trading around $58.30 per barrel. Prices have risen nearly 4.5% this week, with rising geopolitical risks providing key support. International oil prices closed sharply higher on Monday due to escalating geopolitical tensions. The US Coast Guard attempted to intercept a sanctioned oil tanker in international waters near Venezuela on Sunday, the third such action in nearly a month, exacerbating market concerns about potential disruptions to Venezuelan oil supplies. On the same day, Ukrainian drones attacked two ships and a port in Russia's Krasnodar region, posing a potential threat to Russia's energy exports from the Black Sea. The market had previously downplayed the risks of a US blockade, but the latest interception has prompted participants to take the possibility of disruptions to Venezuelan oil exports seriously. Analysts believe that rising geopolitical risks have provided key support for oil prices.
From a daily chart perspective, US crude oil remains in a weak and volatile pattern. Prices are currently trading near previous lows, with the $56 level forming a significant short-term support. A break below this level could lead to a test of the previous low of $54.88 (the low of December 16th). On the upside, the $58.84 (50-day moving average) – $59.00 (psychological level) area corresponds to short-term moving averages and a previous area of dense trading. A break above this level and a return to the $60.00 (psychological level) would exert significant downward pressure on oil prices. In terms of technical indicators, the daily MACD remains below the zero line. Although the green bars show signs of convergence, a golden cross has not yet appeared, indicating limited rebound momentum. The RSI indicator hovers in the 45-50 range, indicating weak market sentiment but gradually moving away from oversold conditions. Overall, given the fundamental news disturbances, oil prices have room for a technical rebound, but until the trend clearly reverses, the daily chart should still be viewed as a low-level consolidation with limited rebound potential.
Today, consider going long on oil prices around 58.25; Stop loss: 58.10; Target: 59.50; 59.80
Spot Gold
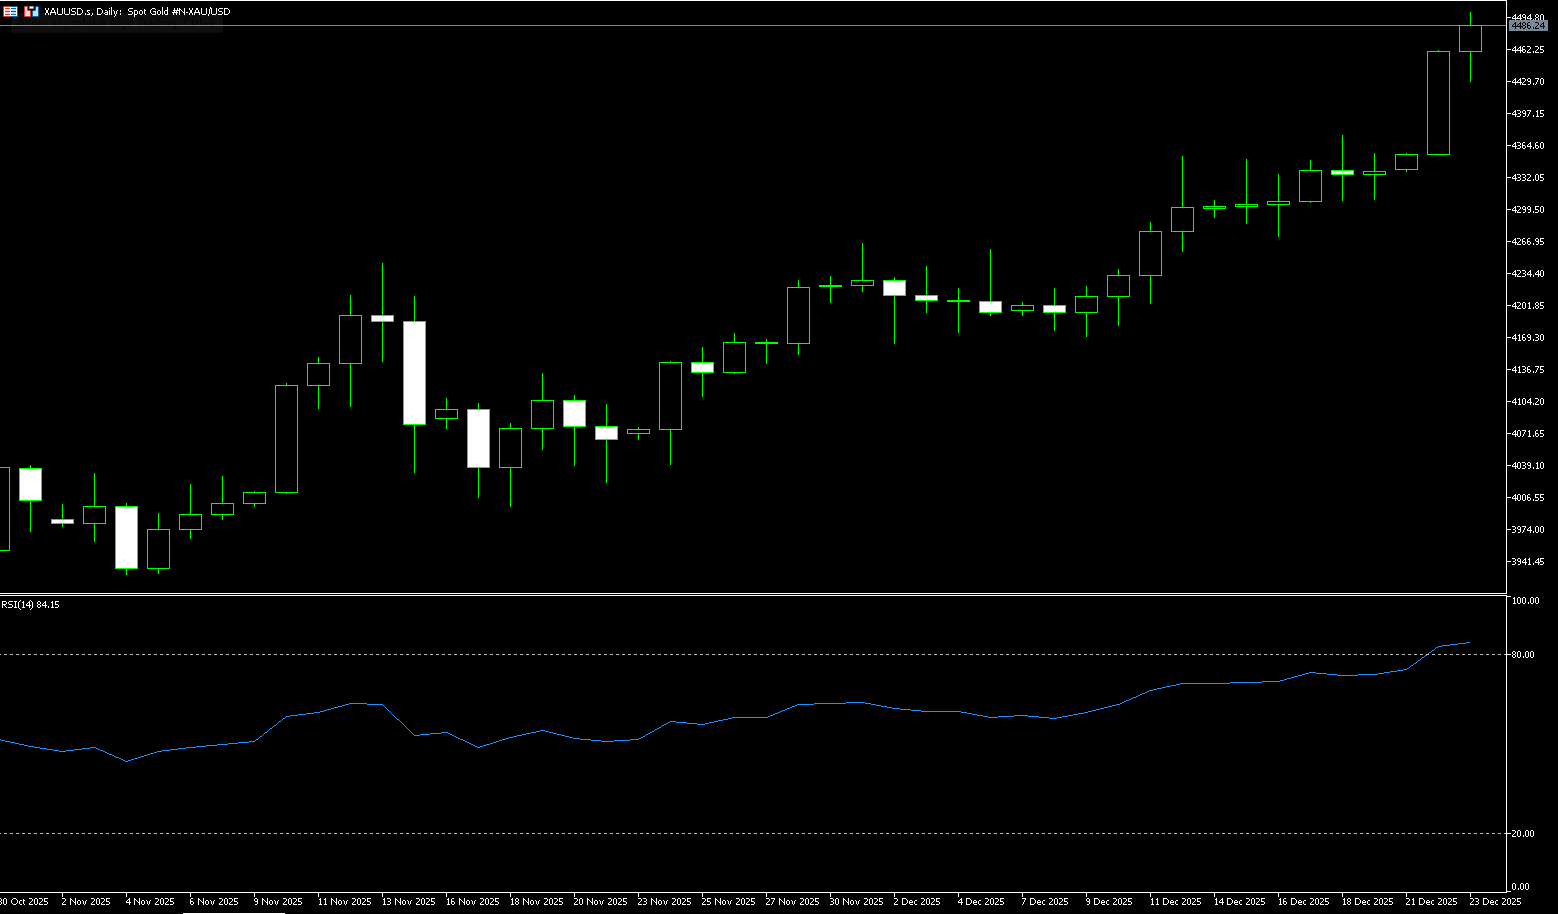
On Tuesday, spot gold traded around $4,490 per ounce. Driven by escalating geopolitical tensions and market expectations of further US interest rate cuts in 2026, gold and silver prices surged, both reaching new historical highs. This breakthrough rise in precious metals was mainly driven by two factors. First, safe-haven demand surged after US President Trump announced last week a blockade of all sanctioned oil tankers entering and leaving Venezuela, exacerbating market tensions. Second, market rumors suggest Trump may nominate a new Federal Reserve chair early next year, with the market anticipating a successor who might be more inclined to cut interest rates, a prospect that benefits non-interest-bearing assets like gold. Furthermore, a weaker dollar provided additional support for dollar-denominated precious metals. Against the backdrop of low trading volumes during the holiday season, this rally is a classic example of a "momentum breakout." With gold successfully reaching a new historical high, the market has set its sights on the $5,000 mark next year, and the core narratives driving this rise—central bank gold purchases, geopolitical risks, and expectations of interest rate cuts—are expected to continue.
From the daily candlestick chart, the price formed a classic "resistance-turned-support" structure after breaking through $4,400. In terms of pattern, if a subsequent pullback occurs but stabilizes within the $4,400 to $4,381.20 range (representing the mid-term bullish/bearish dividing line), it better fits the "post-breakout consolidation" pattern in a strong trend, and the bullish structure is expected to continue. Conversely, if it falls below this range and volatility increases, a false breakout leading to a deeper correction should be anticipated. At that time, the $4,350 level and the previous low of $4,300 will be the key support levels for a longer-term risk reference. The latest high near $4,550-$4,600 will serve as a short-term resistance reference. Regarding indicators, the MACD is in a strong range, indicating that the upward momentum is still expanding and the trend has not been broken; however, the RSI (14) reading is 78.61, entering a clearly overbought zone, suggesting that the marginal returns of short-term chasing the rally are decreasing, and the market is more likely to release congestion through "high-level consolidation or rapid pullback."
Consider going long on gold around 4,483 today; Stop loss: 4,478; Target: 4,520; 4,530
AUD/USD
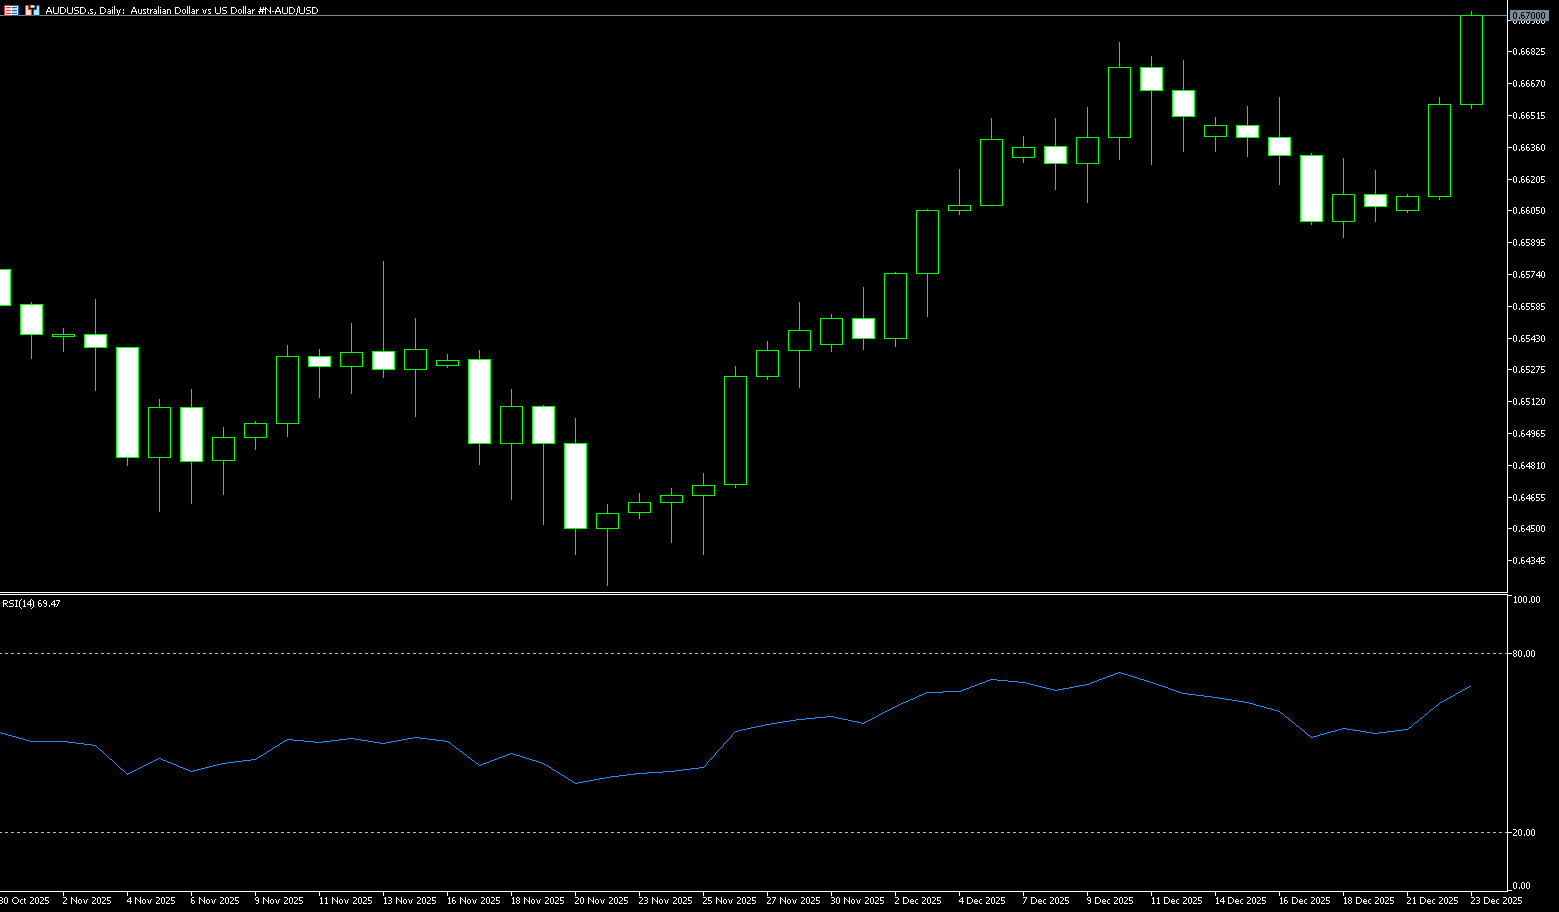
The Australian dollar rose to a near three-month high of US$0.6704 on Tuesday, extending gains from the previous session, as the Reserve Bank of Australia (RBA) discussed the conditions for potential future interest rate hikes. This followed the release of the minutes from the RBA's December monetary policy meeting. Additionally, the Australian dollar appreciated against the US dollar as the market anticipated continued easing by the Federal Reserve amid challenges to the US dollar. The RBA minutes showed that board members expressed less confidence in whether monetary policy remained restrictive, as mounting evidence suggested that inflationary pressures might be more persistent than previously expected. Policymakers also indicated they would evaluate policy at future meetings, noting that G4 inflation data had been released prior to the February meeting. They discussed whether a rate hike might be necessary sometime in 2026 and believed that assessing the persistence of inflation might require a longer period.
The Australian dollar/US dollar pair traded around 0.6700 on Tuesday. Technical analysis on the daily chart shows the currency pair is rising, having broken through the lower boundary of the descending ascending channel, indicating a strengthening bullish bias. The 14-day Relative Strength Index (RSI) is at 68.00, reflecting the accumulation of bullish conditions and momentum. A successful break above the 9-day simple moving average at 0.6640 improves short-term price momentum, targeting the pair's highest level since October 2024 at 0.6707. A break below this level would target 0.6760 (the high of October 11th). On the downside, immediate support is at the 9-day simple moving average at 0.6640, aligning with the descending ascending channel boundary near 0.6630. A break below this channel would expose the psychological level of 0.6600. A break below this level could increase downside pressure, exposing the 100-day moving average at the 0.6552 level.
Consider going long on the Australian dollar around 0.6690 today; Stop loss: 0.6680; Target: 0.6730; 0.6740
GBP/USD
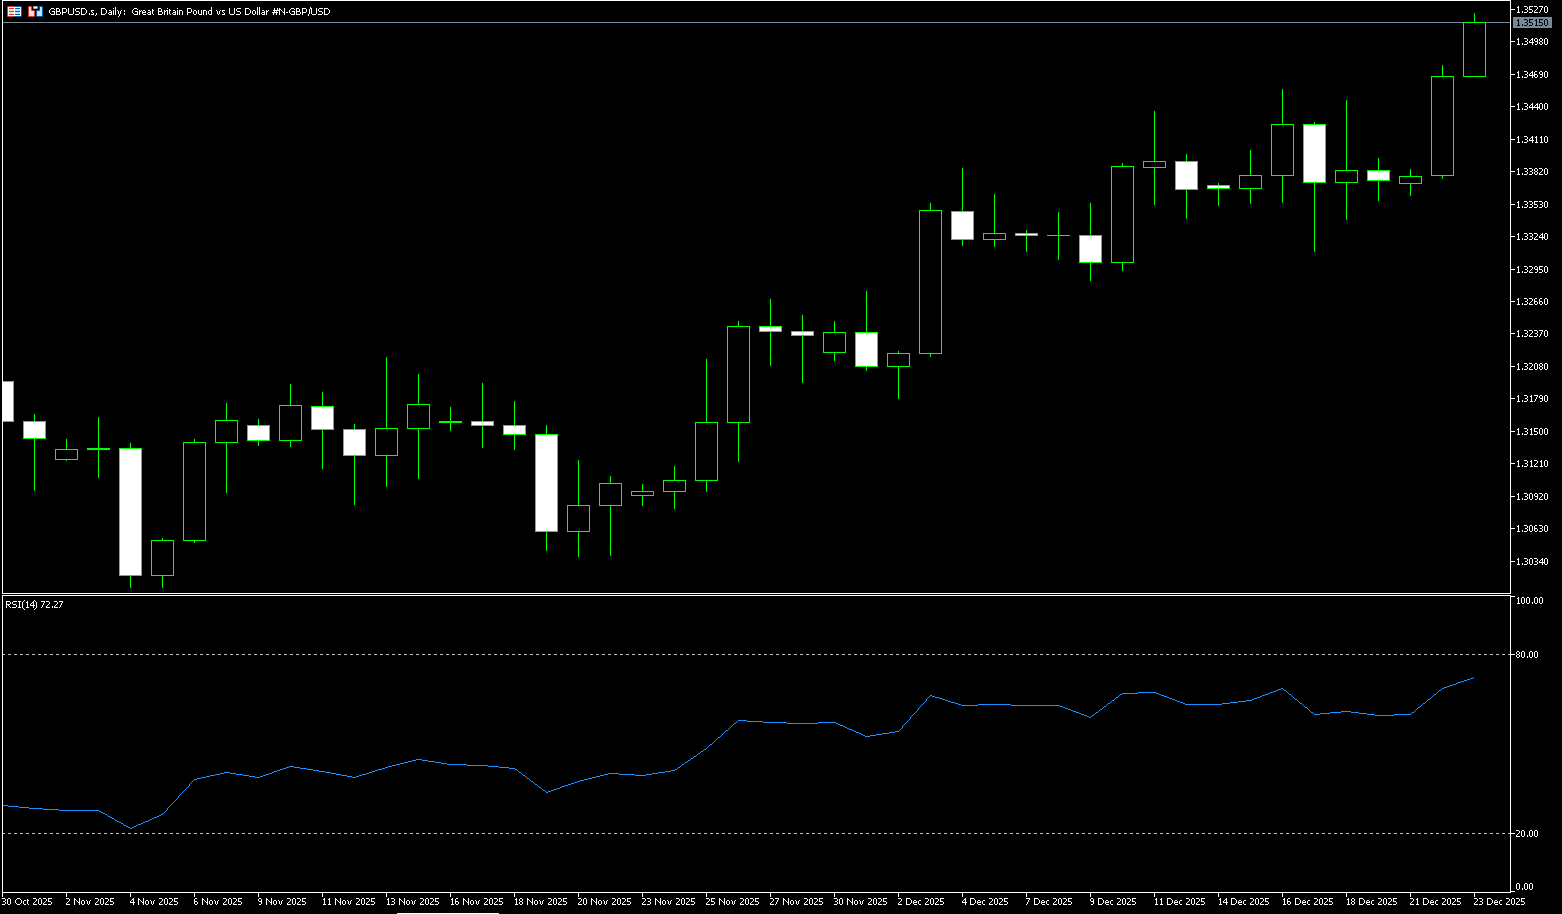
GBP/USD found room to rise this week, starting a shortened holiday trading week, with recent volatility amid a weaker dollar pushing the pound to a 12-week high of 1.3525. Pound traders largely ignored the Bank of England's latest rate cut, as the Bank of England's policy strategy has clouded the outlook for rate cut observers. The Fed's recent third consecutive rate cut weakened dollar support, leading to a broad decline in the dollar in markets that closed early this week for the holidays. The Bank of England's recent policy approach emphasizes "alternative scenarios" rather than direct economic and policy outlooks, which will put pressure on future rate watchers. Compared to its more modern counterpart, the Fed, the Bank of England is known for its differing opinions, or at least loud policy views, among its members, who appear to tend towards policy consensus in their statements.
In summary, the current rebound in GBP/USD is more of a technical correction before data releases than a trend reversal. The expectation of a Bank of England rate cut has been fully priced in, weakening the pound's medium-term appeal; while the dollar has found support after short-term policy uncertainty decreased. Technically, the GBP/USD daily chart shows the pair finding support around 1.3406 (the 9-day simple moving average) and 1.3400 (the psychological level), and has regained its position above the short-term moving averages. Resistance is concentrated in the 1.3550-1.3600 psychological zone; failure to break through this level will limit further upside. On the downside, watch 1.3455 (Tuesday's low) and 1.3406 (the 9-day simple moving average). Technically, the 14-day Relative Strength Index (RSI) is at 68 and continuing to rise, maintaining a positive tone and suggesting further highs. The MACD histogram is converging, indicating a slowdown in bullish momentum, but the overall trend has not yet weakened.
Consider going long on GBP/USD around 1.3505 today; Stop loss: 1.3495; Target: 1.3550; 1.3560
USD/JPY
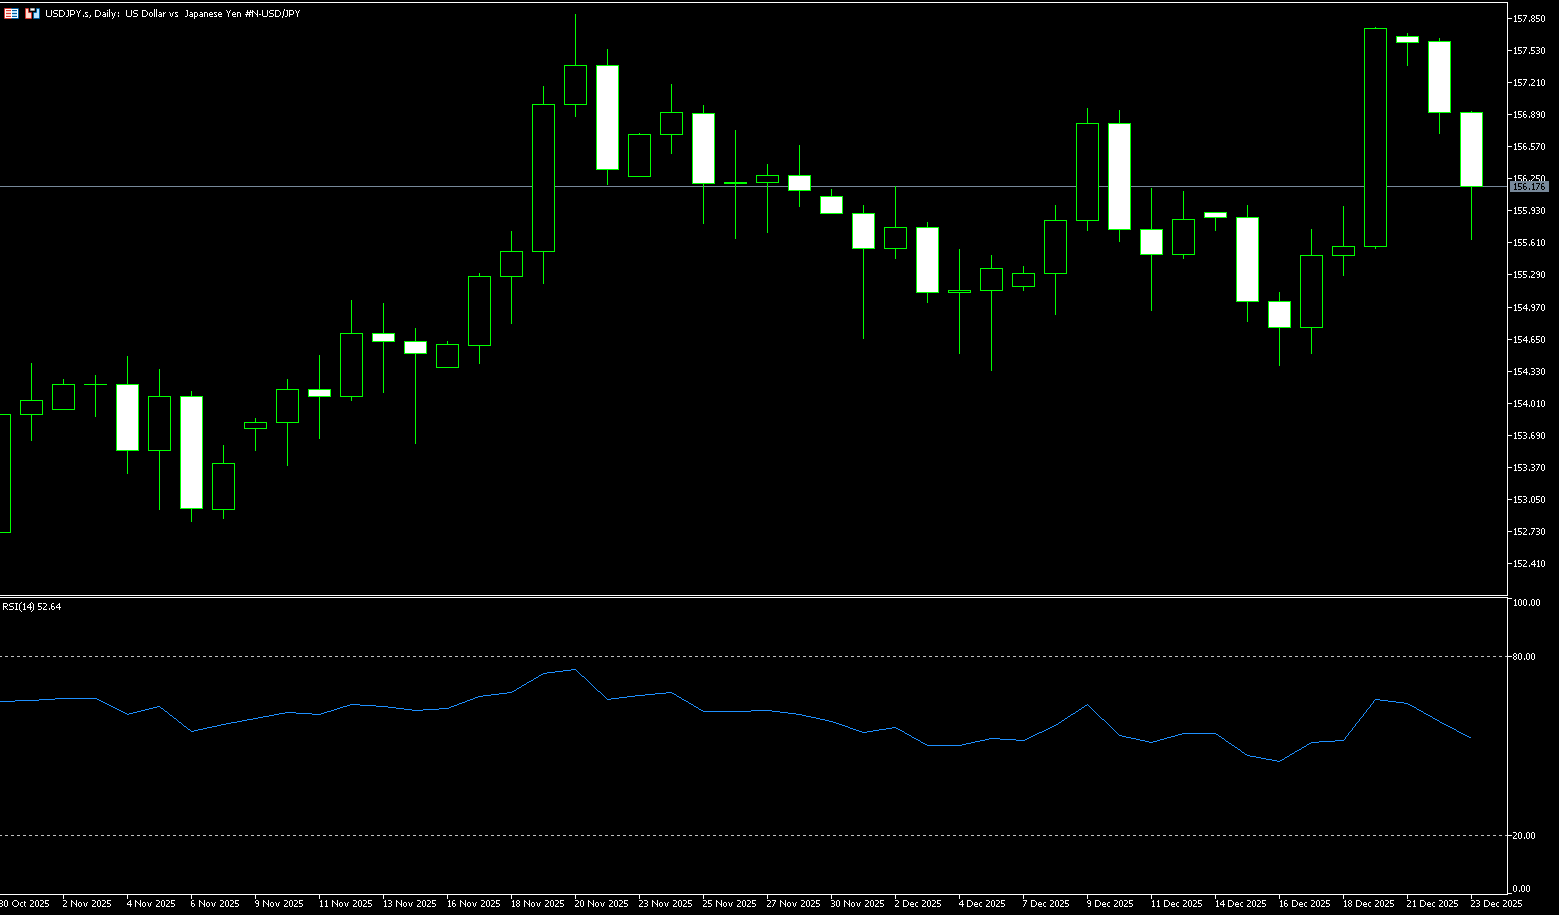
The USD/JPY pair attracted some selling pressure in early Asian trading on Tuesday, near 156.00. The yen strengthened after Japanese officials warned of “one-sided and sharp” currency volatility, fueling market concerns about intervention. Jun Mimura, head of foreign exchange at Japan, said on Monday that recent currency volatility has been one-sided and sharp. Mimura added that he was concerned about the volatility and that the government would take appropriate measures against excessive behavior. The government is “absolutely prepared” to act, adding that Japan can act under the US-Japan joint agreement and has “freedom of action” to take bold measures to stabilize the yen. Some verbal intervention by Japanese authorities may provide some support for the yen and create resistance for the pair. Financial markets are pricing in a near 21.0% probability of a rate cut by the Federal Reserve at its next meeting in January, following three previous 25 basis point cuts at its last three meetings.
From a technical analysis perspective, USD/JPY is currently at a critical juncture. The current price is below the psychological level of 157.00, indicating weakening short-term momentum. The 40-day simple moving average (SMA) at 155.35 provides initial support. The MACD indicator shows both the DIFF and DEA lines above the zero line, but the DIFF (0.161) is below the DEA (0.222), forming a potential bearish crossover, suggesting that upward momentum may be waning. The 157.60-157.90 range represents the 11-month high reached last month and serves as both psychological and technical resistance. A decisive break above this area is necessary for further upward movement. Close attention should be paid to market reactions as the price approaches this range, especially any unusual trading volume from Japanese official accounts. Initial support lies near the 40-day SMA at 155.36, with stronger support seen at 155.00 (psychological level) and 154.62 (50-day moving average).
Today, consider shorting the US dollar around 156.45; Stop loss: 156.65; Target: 155.50; 155.30
EUR/USD
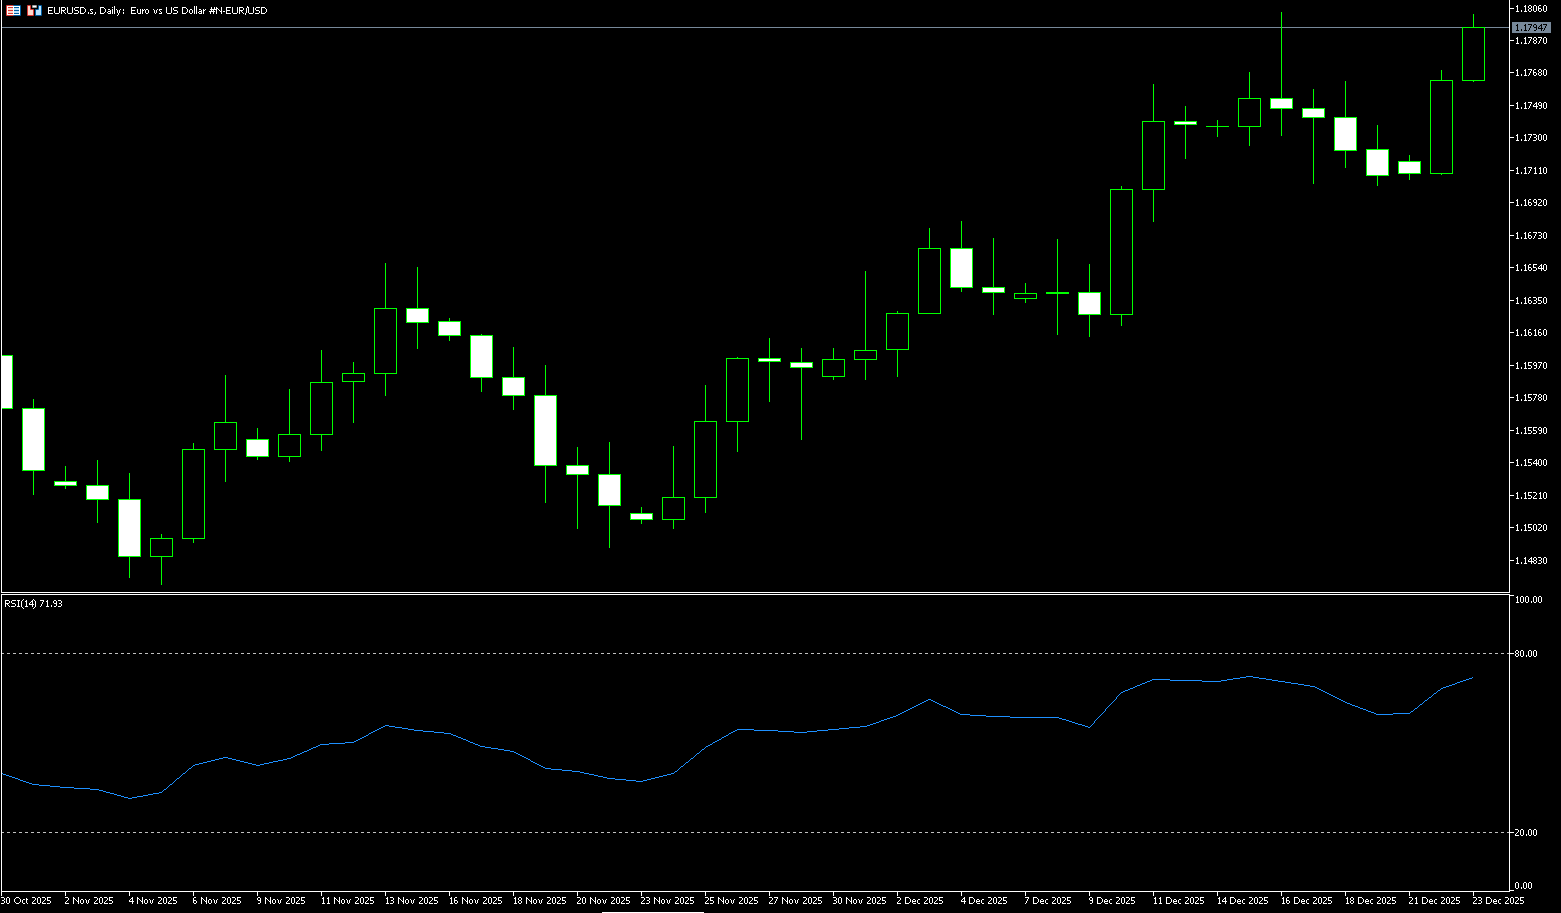
The forex market experienced significant volatility this week, with the euro/dollar pair recording losses for four consecutive trading days. However, it has since risen steadily, stabilizing above 1.1780 in the early morning session and reaching the psychological level of 1.1800. From an overall market perspective, traders are reassessing the Federal Reserve's policy path, while potential escalation in geopolitical tensions adds uncertainty. The US November Consumer Price Index rose 2.7% year-on-year, lower than the market's previous expectation of 3.1%, marking the slowest pace since 2021. This inflation data appears to be bearish for the dollar. After last week's consecutive declines, the euro/dollar pair has recently shown signs of renewed buying interest. Since its strong rebound from a low of around 1.0359 at the beginning of the year, the pair has accumulated considerable gains. After hitting a high of 1.1918, prices pulled back and subsequently entered a relatively wide trading range.
On the daily chart, the risks for EUR/USD are skewed to the upside. The 20-day simple moving average (SMA) at 1.1682 is above the 100-day SMA at 1.1657, and both are trending upwards, providing immediate dynamic support. Meanwhile, momentum indicators are trending upwards within neutral levels, and the 14-day Relative Strength Index (RSI) is at 71 and continuing to rise, maintaining a positive tone and suggesting higher highs in the future. The short-term bias will remain positive as long as the pair holds above the mentioned 20-day and 100-day SMAs. On the upside, the 1.1800 level and the 1.1804 area (the 12-day high from the 16-day high) are considered short-term resistance zones. Then come 1.1848 (the September 18 high) and the 1.1900 level.
Consider going long on the Euro today around 1.1782; Stop loss: 1.1770; Target: 1.1830, 1.1840
Disclaimer: The information contained herein (1) is proprietary to BCR and/or its content providers; (2) may not be copied or distributed; (3) is not warranted to be accurate, complete or timely; and, (4) does not constitute advice or a recommendation by BCR or its content providers in respect of the investment in financial instruments. Neither BCR or its content providers are responsible for any damages or losses arising from any use of this information. Past performance is no guarantee of future results.
More Coverage


Risk Disclosure:Derivatives are traded over-the-counter on margin, which means they carry a high level of risk and there is a possibility you could lose all of your investment. These products are not suitable for all investors. Please ensure you fully understand the risks and carefully consider your financial situation and trading experience before trading. Seek independent financial advice if necessary before opening an account with BCR.
BCR Co Pty Ltd (Company No. 1975046) is a company incorporated under the laws of the British Virgin Islands, with its registered office at Trident Chambers, Wickham’s Cay 1, Road Town, Tortola, British Virgin Islands, and is licensed and regulated by the British Virgin Islands Financial Services Commission under License No. SIBA/L/19/1122.
Open Bridge Limited (Company No. 16701394) is a company incorporated under the Companies Act 2006 and registered in England and Wales, with its registered address at Kemp House, 160 City Road, London, City Road, London, England, EC1V 2NX. This entity acts solely as a payment processor and does not provide any trading or investment services.

 English
 简体中文
简体中文
 繁體中文
繁體中文
 Bahasa
Melayu
Bahasa
Melayu
 Tiếng
Việt
Tiếng
Việt
 ไทย
ไทย
 日本語
日本語
 한국어
한국어
 ភាសាខ្មែរ
 español