


0
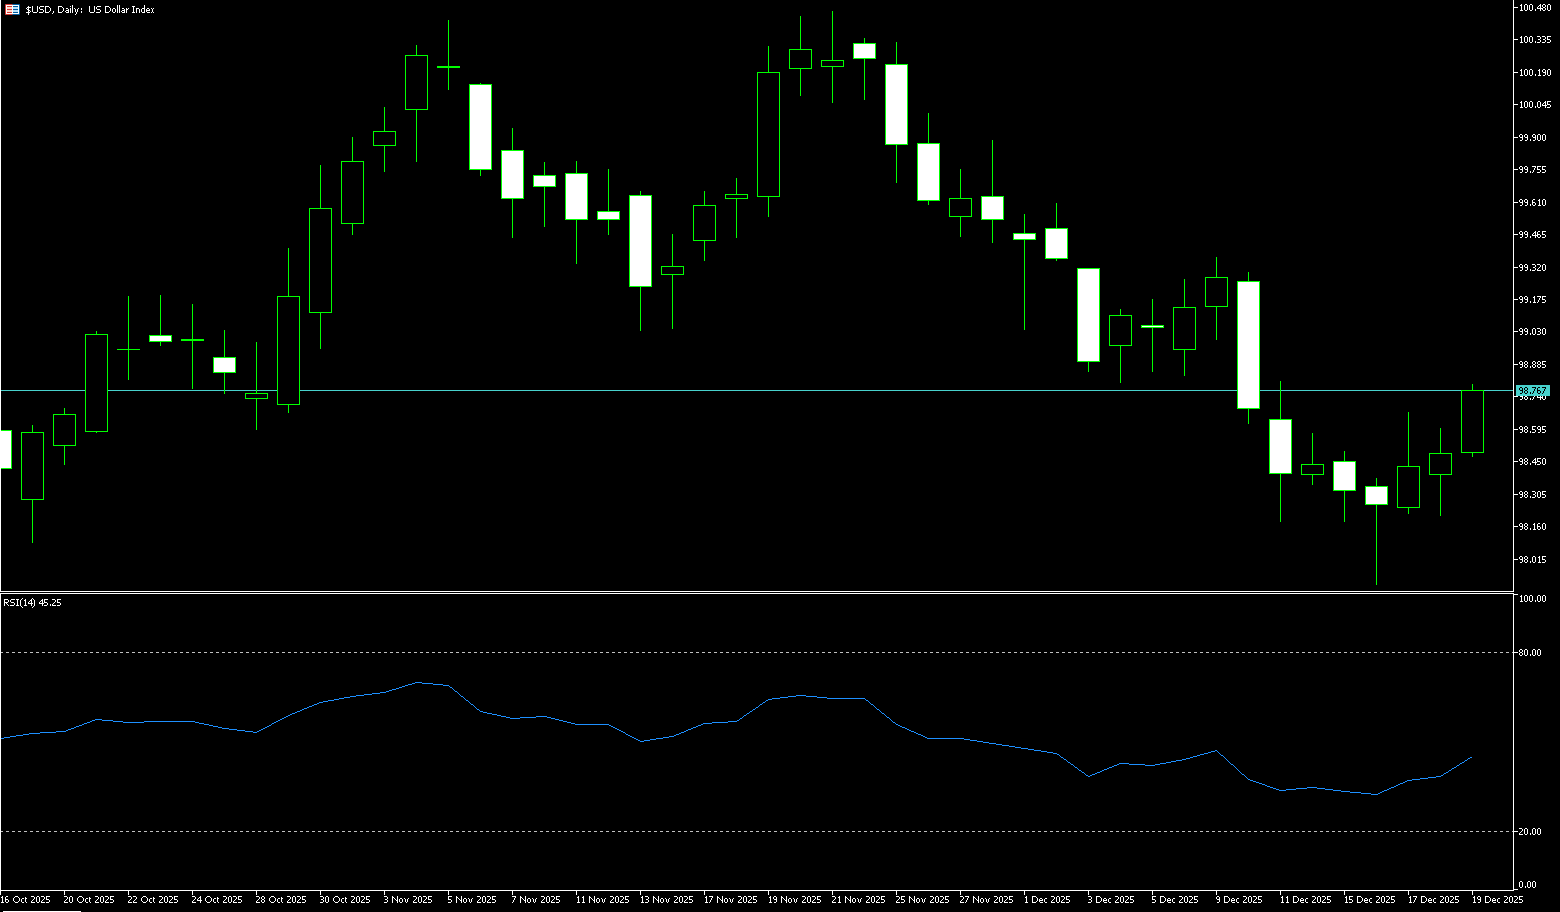
The US Dollar Index
The US dollar index hovered around 98.00 before the end of last week, poised to remain largely unchanged as investors weighed the prospect of further Fed rate cuts next year, driven by weak inflation and labor market signals. The November CPI report showed headline inflation at 2.7%, the lowest since July and below market expectations of 3.1%, while core inflation fell to 2.6%, the slowest pace since early 2021. Meanwhile, data released earlier this week showed the unemployment rate rose to 4.6% in November, the highest level since 2021. The US dollar index continued its weak trend last week, fluctuating within a range of approximately 97.80–98.80 under the dual pressure of rate cut expectations and weak economic data. Overall, the US dollar index showed a relatively stable trend last week, closing higher on three out of five trading days, indicating a struggle between bullish and bearish forces. This was mainly due to the digestion of the positive impact of hawkish comments following the Fed's rate cut. In the long term, the challenges facing the US dollar index come not only from technical factors but also from changes in fundamentals. Factors such as slowing US economic growth, easing inflationary pressures, and a shift in Federal Reserve policy may all exert sustained pressure on the US dollar. Investors need to examine the investment value of the dollar from a broader perspective and formulate corresponding investment strategies.
The US dollar index has released several important technical signals in the short term, which corroborate each other and point to a weaker trend. This week's rebound was again met with resistance near the upper channel line at 98.80 (the 38.2% Fibonacci retracement level of the 96.22 to 100.39 range), confirming the technical validity of the channel. As long as the US dollar index fails to break through the upper channel line, the downtrend will continue. Secondly, the test results of key support levels show the fragility of the support. Although the US dollar index found support at 97.87 on December 16 and rebounded, the subsequent rebound was clearly insufficient and failed to recover the lost ground. This pattern of "effective support but weak rebound" indicates that while the 97.50 support is temporarily effective, the pressure is increasing, and a break below it will trigger a new round of declines. Thirdly, the divergence of technical indicators warrants attention. Although the price found support around 97.50, several indicators did not show clear bullish divergence; instead, some indicators showed bearish divergence. This divergence between indicators and price suggests that even if a rebound occurs, it may be technical and unlikely to change the overall weak trend. The technical picture clearly shows bearish dominance: a descending channel, a bearish crossover of key moving averages, and weak technical indicators across the board. A decisive break below the key support level of 97.87 would trigger a new round of deep correction, targeting 97.11 (78.6% Fibonacci retracement level) and then 97.00 (psychological level). Resistance is at 98.80 (38.2% Fibonacci retracement level); a break above this level would raise the rebound potential to 99.00 (psychological level), followed by 99.41 (23.6% Fibonacci retracement level).
Today, consider shorting the US Dollar Index around 98.80; Stop loss: 98.90; Target: 98.40; 98.30
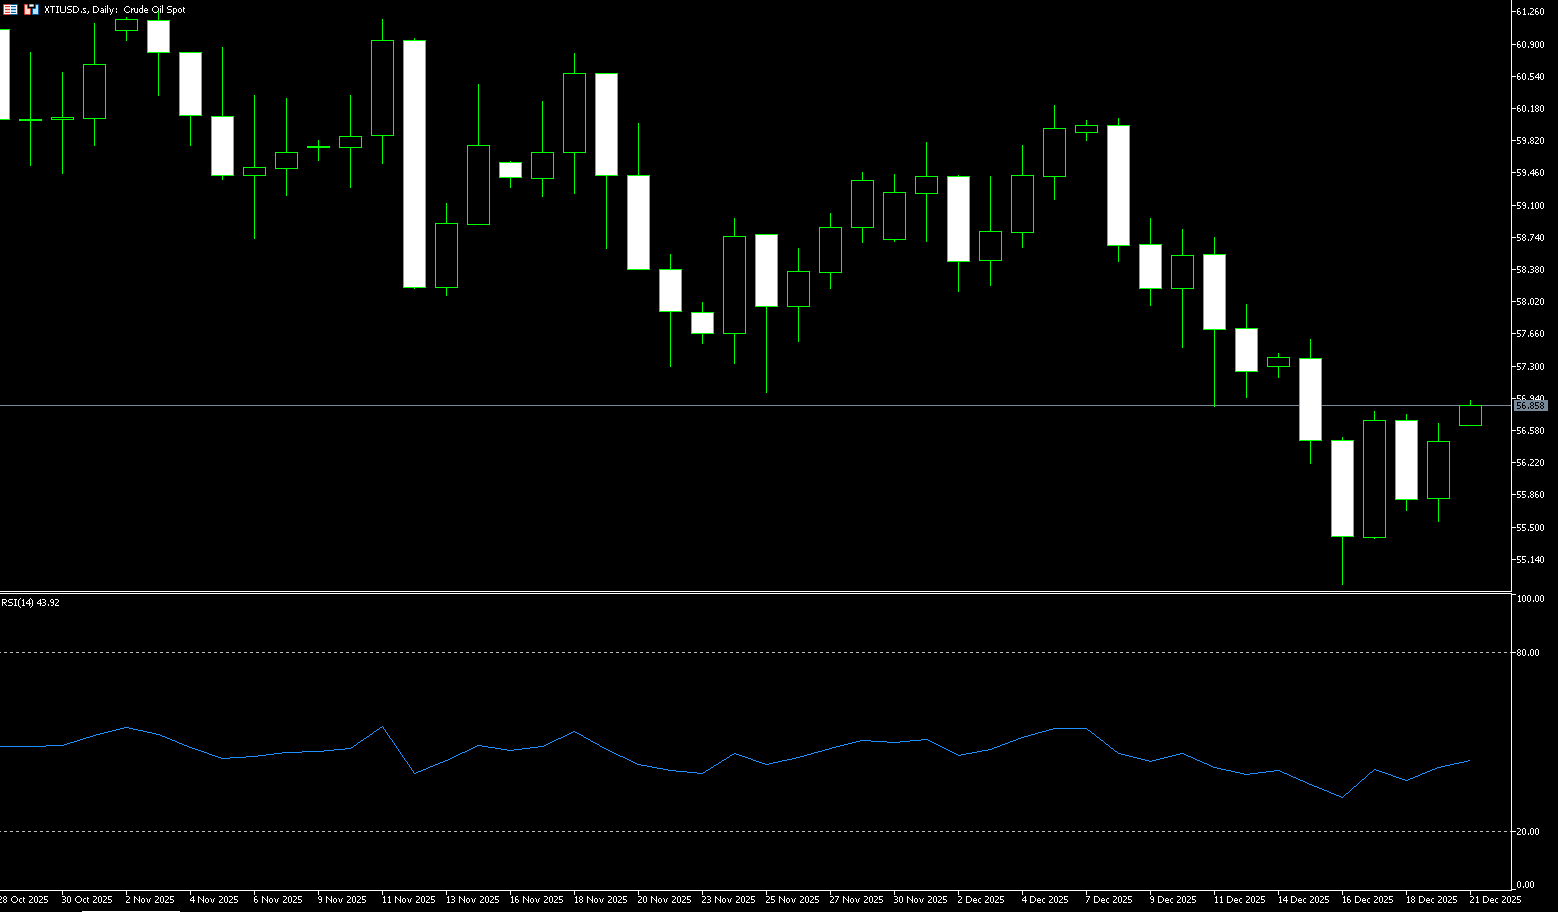
WTI Crude Oil
WTI crude oil experienced a breakdown and subsequent low-level consolidation last week, hitting a new low since April of this year. Technically, the market weakened across the board, while fundamentals showed a worsening oversupply and easing geopolitical risks, resulting in a confluence of multiple negative factors. WTI crude oil experienced a breakdown and subsequent low-level consolidation last week, with extremely weak price performance. It is worth noting that December 16th was dubbed "Black Tuesday" by the market, as WTI crude oil broke below the key support level of $55/barrel. This break has significant technical implications, confirming the medium-term downtrend. From a longer-term perspective, from December 11th to 16th, crude oil prices fell for four consecutive days, with a cumulative decline of 5.29%, and European and American crude oil futures prices respectively hitting new lows since March 2021, nearly five years ago. OPEC+'s production policy for December 2025 is characterized by "cautious production increases and a pause in expansion." However, this adjustment has failed to effectively support oil prices, primarily due to persistent market concerns about oversupply. Easing geopolitical risks are a significant factor contributing to the recent decline in crude oil prices. Positive progress in the Russia-Ukraine peace talks has become a focus of market attention.
WTI crude oil underwent a deep correction in mid-December 2025, hitting a new low of $54.88, the lowest in 24 months, exhibiting a comprehensive bearish technical pattern. From a technical analysis perspective, the weekly chart clearly shows a bearish alignment, with the 14-day Relative Strength Index (RSI) in negative territory (42.27) without a reversal signal, and the MACD below the zero line, indicating that bearish momentum dominates the market. The daily chart also shows a typical bearish pattern for WTI crude oil. The moving average system is diverging downwards across the board, with the 5-day, 10-day, and 20-day moving averages successively suppressing the price, forming a strong resistance zone. The price has moved far away from the medium- and long-term moving averages, indicating a strong trend. Technically, the MACD indicator continues to operate below the zero line, with bearish momentum dominating the market. Although a golden cross appeared on Thursday, the volume was clearly insufficient, casting doubt on the sustainability of the rebound. The RSI (Relative Strength Index) remains below the neutral level of 50, reflecting weak upward momentum. This week has seen consecutive negative closes; although a small positive rebound occurred on Thursday, its strength was weak and failed to change the overall weak pattern. This candlestick pattern typically indicates a continuation of the downtrend. After breaking below the strong support of $56, WTI crude oil's next important support level is at $54.88 (recent low), with a break below targeting $53.86 (January 2020 low). On the upside, the first resistance level is $57.62 (last week's high), followed by $59.08 (the 9-week simple moving average).
Today, consider going long on oil around $56.36; stop loss: $56.20; target: $57.50; $57.70
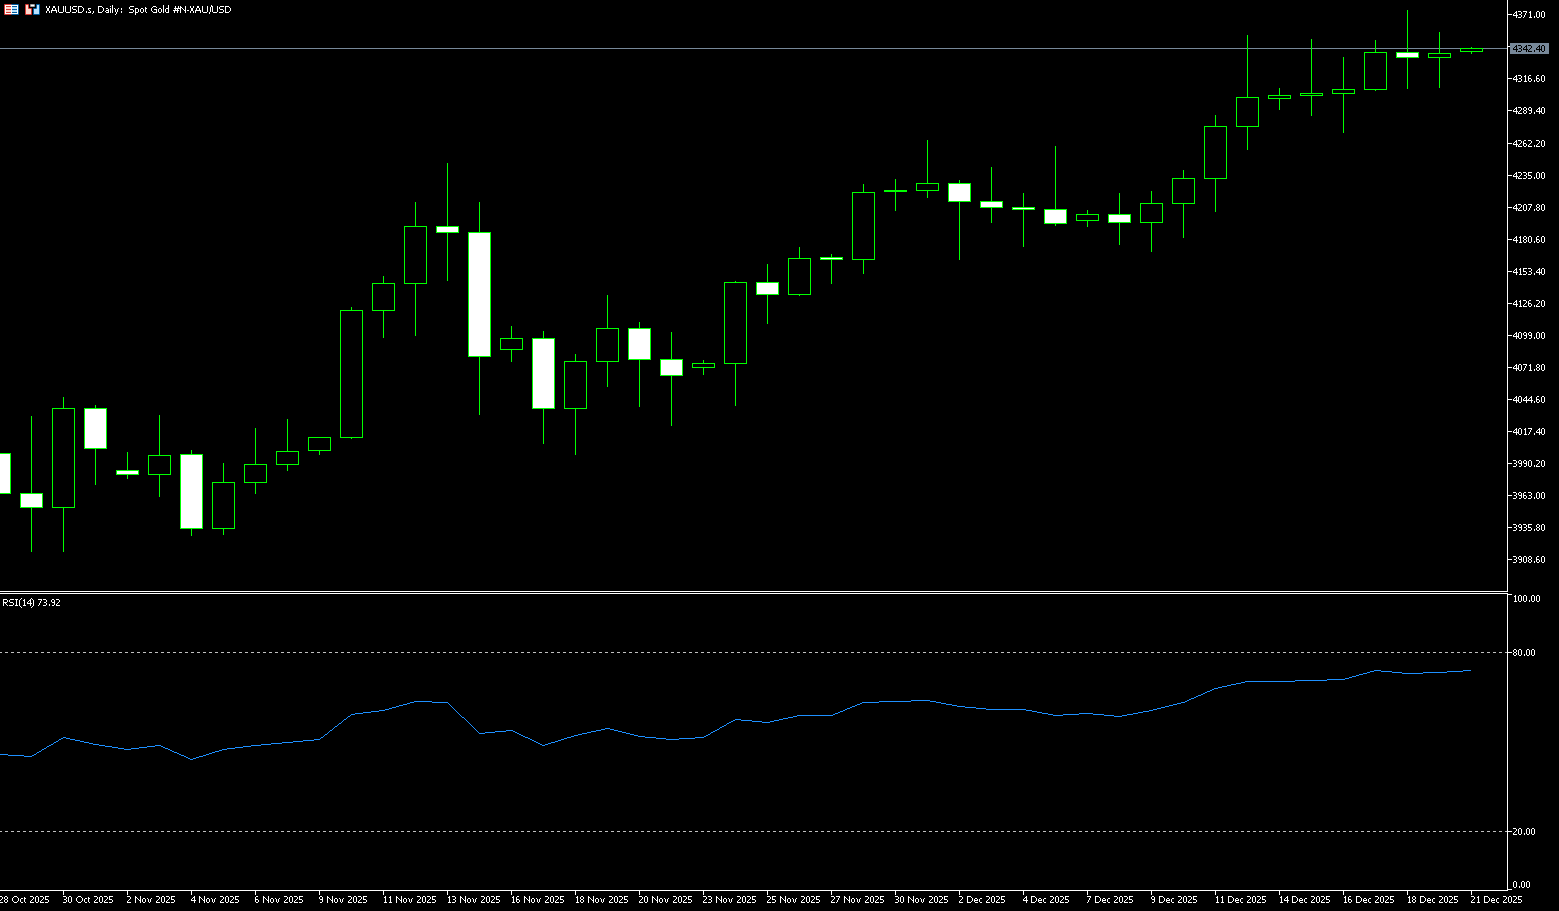
Spot Gold
Last week, spot gold consolidated above $4,300, exhibiting a high-level consolidation pattern. From a fundamental perspective, the Federal Reserve announced a 25 basis point rate cut to the 3.5%-3.75% range on December 10th, but the dot plot indicates only one rate cut is planned for 2026, indicating increased internal divergence. The Bank of Japan expects to raise rates to 0.75% on December 19th, a 30-year high. Global economic growth is slowing, with the IMF predicting 3.2% growth in 2025 and a further decline to 3.1% in 2026. Geopolitical risks continue to escalate, with the Russia-Ukraine conflict and the US-Venezuela standoff providing support for gold prices. On the other hand, in December 2025, the global geopolitical situation presented a complex picture of multiple outbreaks and overlapping risks, providing strong safe-haven support for gold prices. Simultaneously, the Trump administration designated the current Venezuelan government as a "foreign terrorist organization" and ordered the blockade of all sanctioned oil tankers entering and leaving Venezuela. This move provided support for gold prices. Therefore, factors such as the Federal Reserve's interest rate cut cycle, continued gold purchases by global central banks, and high geopolitical risks have provided strong support for gold prices. In particular, 95% of central banks plan to continue increasing their gold holdings, demonstrating a long-term bullish outlook on gold. However, attention should also be paid to risk factors such as increasing internal divisions within the Federal Reserve and the Bank of Japan's interest rate hikes.
From a daily chart perspective, gold prices have risen steadily from $2,650 at the beginning of 2025, with a cumulative increase of over 60% this year, reaching a record high of $4,381 in October. Currently, gold prices are fluctuating near these historical highs. The daily chart shows the 5-day, 10-day, and 20-day moving averages in a standard bullish alignment. This bullish pattern indicates the medium-term uptrend remains intact, especially with the 10-day moving average at {4,283} acting as a crucial support level, providing strong support for gold prices. Notably, gold prices repeatedly tested the $4,300-$4,283 psychological support level this week, showing significant support at this level. The daily MACD remains in a golden cross above the zero line, indicating intact medium- to long-term upward momentum. The 14-day RSI is in a bullish zone, but some data sources show it has broken through the 70 overbought zone. However, short-term overbought risks should be noted. Currently, the first resistance level is $4,345-$4,350 (a key high in recent fluctuations and a strong intraday resistance zone), followed by $4,381 (the historical high reached in October), while the ultimate resistance is at the $4,400-$4,450 psychological support level. The first support level is at $4,300 (a psychological level), followed by $4,283.40 (the 10-day moving average). A break below this level would test the $4,235 level (the Bollinger Band middle line).
Today, consider going long on gold around $4,335; stop loss: $4,330; targets: $4,360; $4,370.
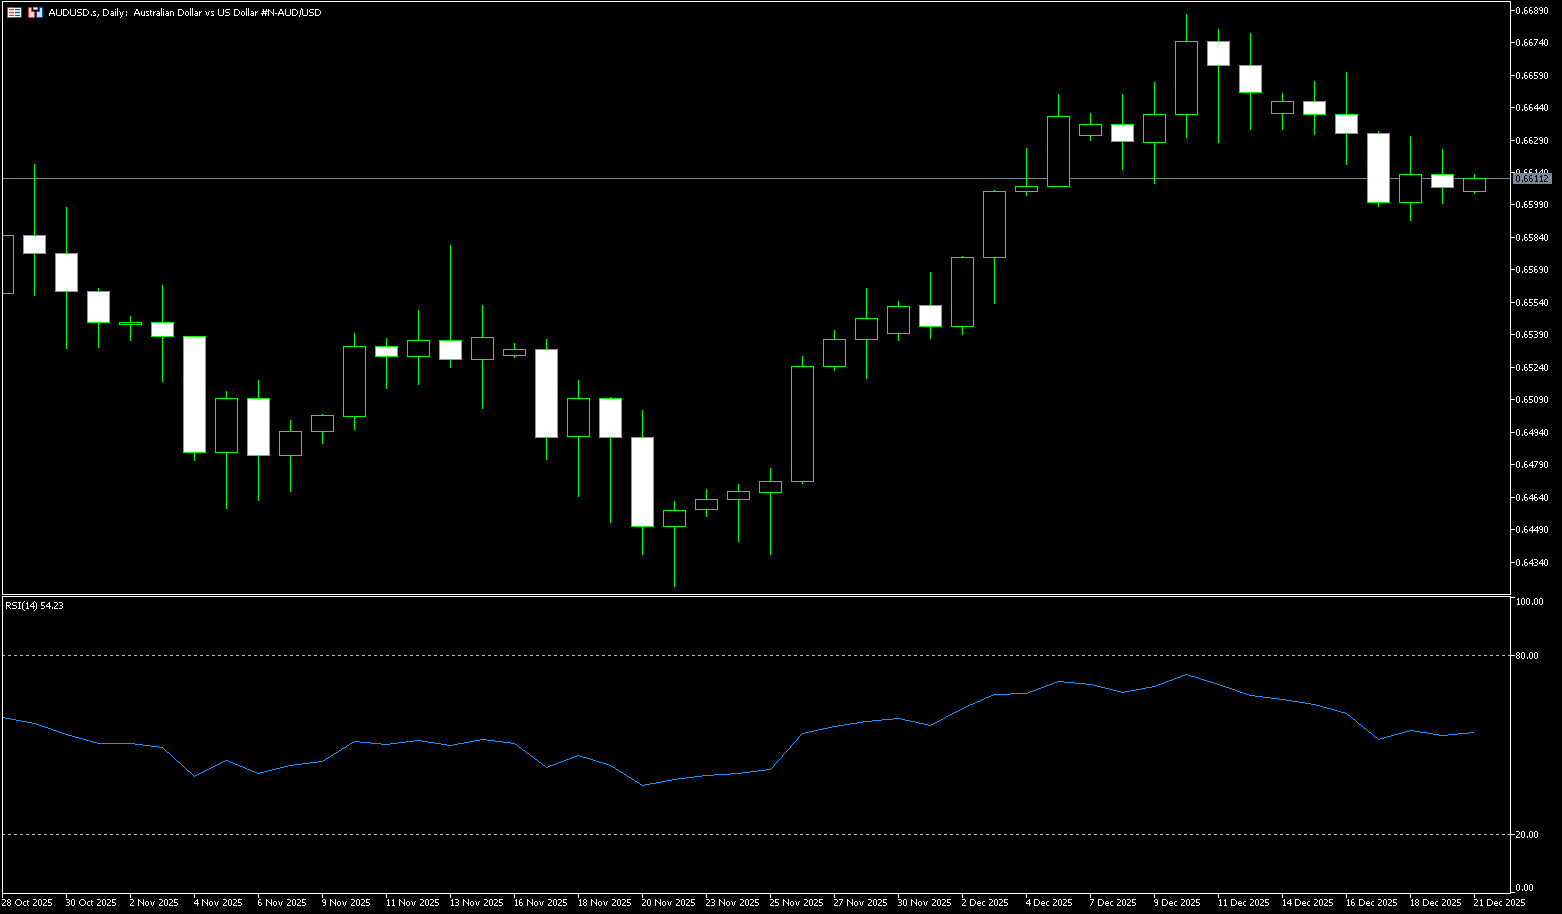
AUD/USD
The Australian dollar traded in a downward trend last week, consolidating at lower levels. It fell from around 0.6685 to a low of 0.6592, fluctuating around a two-week low near 0.6600 before the weekend. Short-term bears are in control, but the medium- to long-term bullish structure remains intact. It is poised for its first weekly decline in a month as investors await the Reserve Bank's December meeting minutes for a clearer policy outlook. The minutes, expected to be released next week, will provide insights into the board's discussions on potential future tightening and inflation concerns. Economists remain divided, with some expecting a rate hike in February, while others believe rates will remain unchanged unless there are unexpected inflation developments in the near term. The November CPI report will be released on January 7th, and more comprehensive data for December and the fourth quarter will be released on January 28th. A core inflation rate rising 0.8% or more quarter-on-quarter could prompt the Reserve Bank of Australia to raise rates at its February meeting. The market now expects a 25% chance of a rate hike in February, rising to 40% in March and 70% in May. Elsewhere, weak US inflation data and a cooling labor market have increased the likelihood of further rate cuts by the Federal Reserve.
Last week, the Australian dollar traded in a downward trend against the US dollar, fluctuating around the 0.6600 level, with short-term momentum neutral to weak. The currency pair continued its pullback from the high near 0.6685 last week, experiencing six consecutive days of decline. It touched a low of 0.6592 on December 18th and fluctuated within the 0.6600-0.6620 range before the weekend, exhibiting a pattern of "rising and falling back, consolidating at lower levels." The 14-day RSI (Relative Strength Index) is in the neutral 50-55 range, suggesting a possible technical rebound, but the bearish momentum has not yet weakened. The MACD histogram continues to show a bearish trend, with the fast and slow lines crossing downwards, indicating short-term bearish dominance. On the other hand, the 5-day and 10-day moving averages on the daily chart provide short-term resistance, while the 100-day moving average around 0.6548 provides medium-term support. The weekly moving average system remains bullish, and the medium-term trend has not reversed. If the price stabilizes above 0.6600 and breaks above 0.6636 (the 9-day moving average), it could further challenge 0.6685 (last week's high). A break above this level would indicate a continuation of the medium-term uptrend, with targets at 0.6700 (the psychological level) and 0.6707 (the year's high). A further break above this level would target 0.6750 (the high of October 14, 2024). Conversely, if the price falls below 0.6600 (the psychological level) and fails to recover quickly, the next strong support level is at the 100-day moving average at 0.6548. A breach of this level could lead to a test of the psychological level of 0.6500.
Consider going long on the Australian dollar around 0.6600 today; Stop loss: 0.6586; Target: 0.6640; 0.6650
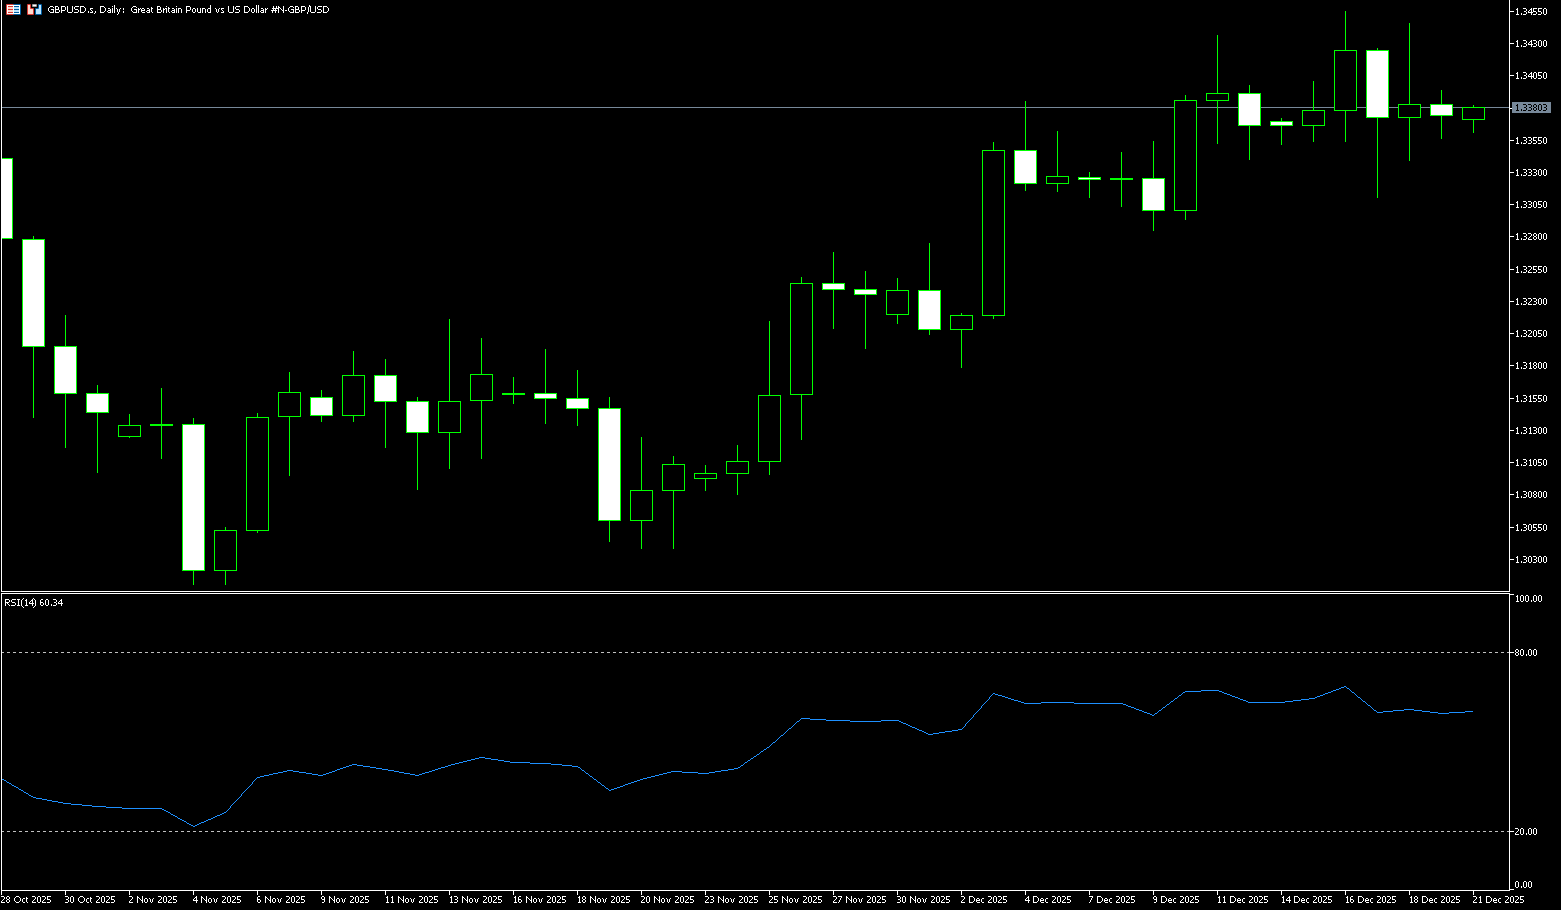
GBP/USD
GBP/USD struggled to bounce from the 1.3310 area, or a one-week low, during Thursday's session and has been trading within a narrow range. The spot price is currently trading around 1.3370. Meanwhile, the UK unemployment rate rose to its highest level since early 2021, providing room for the Bank of England to further ease monetary policy. However, sterling bears appear reluctant to make a significant bet, choosing to remain on the sidelines until they receive more clues about the Bank of England's policy path. In addition, the lack of sustained dollar buying also supported the GBP/USD pair. Despite the Federal Reserve's cautious stance, traders are still pricing in the possibility of two more rate cuts in 2026, given the clear signs of a slowdown in the US labor market. Furthermore, market expectations for a dovish successor to the Fed chair failed to help the dollar capitalize on its overnight rally. This, in turn, warrants caution when positioning for deeper losses on the GBP/USD pair.
The upside to neutral bias for GBP/USD remains intact, but inflation data prompted investors to push the pair to this week's low of 1.3311 before cutting some losses. While momentum is slightly bearish in the short term, the 14-day Relative Strength Index (RSI) on the daily chart remains bullish, suggesting further upside potential. If GBP/USD closes above 1.3400, it could move towards the 1.3472 (October 17 high) and the 1.3500 (psychological level). Conversely, if the pair breaks below 1.3327 (210-day simple moving average), it could fall towards 1.3311 (this week's low) and the 1.3300 area, followed by the 1.3258 (230-day simple moving average).
Consider going long GBP around 1.3358 today; Stop loss: 1.3345; Target: 1.3425; 1.3420
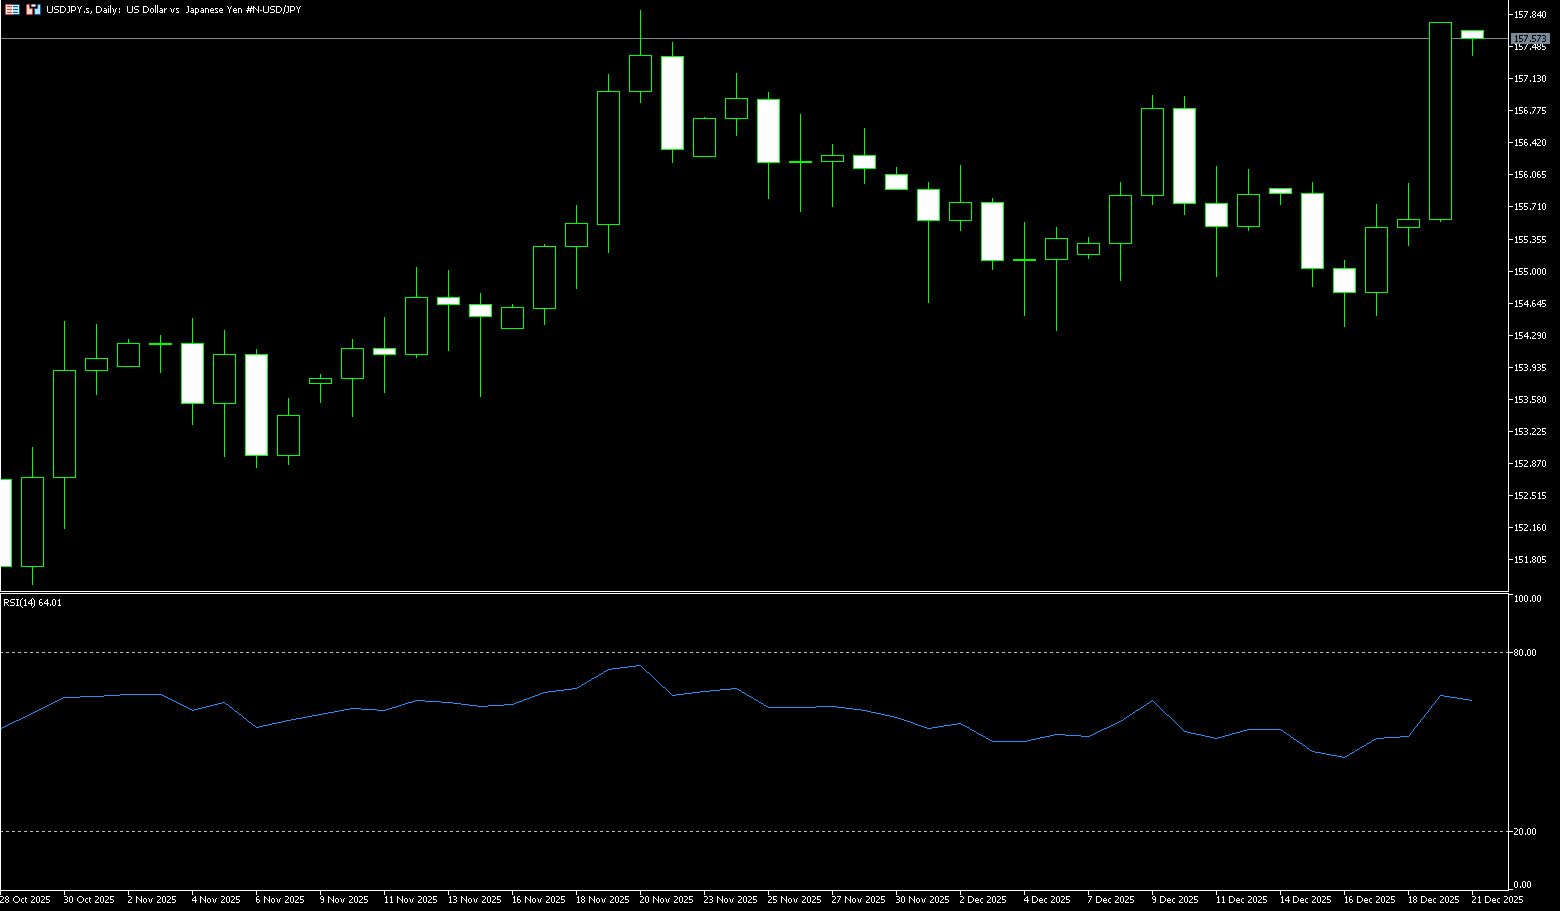
USD/JPY
USD/JPY rose to around 155.70 in early Asian trading on Thursday. The dollar edged higher against the yen due to cautious comments from Federal Reserve Governor Christopher Waller, who stated on Wednesday that the US central bank is in no hurry to cut interest rates. On the other hand, growing acceptance of the Bank of Japan's (BOJ) expectation of an interest rate hike could boost the yen and put downward pressure on the currency pair. The BOJ is expected to raise interest rates from 0.5% to 0.75% at its two-day policy meeting ending Friday. This move would bring the benchmark interest rate to its highest level in thirty years. BOJ Governor Kazuo Ueda reiterated last week that the likelihood of the central bank achieving its basic economic and price outlook is gradually increasing. Ueda added that the BOJ is getting closer to achieving its inflation target.
The USD/JPY pair will be primarily driven by the movement of Japanese government bond yields. As long as yields do not fall sharply, the USD/JPY will find support. From a daily chart perspective, the pair has gradually declined from its highs over the past week, forming a short-term bearish consolidation structure. Daily oscillators are beginning to show negative signals, indicating that downward pressure is gradually accumulating. The current price is finding support near the monthly low of 154.30. A decisive break below 154.00 would signal the start of a new downtrend, opening up further downside potential. On the upside resistance side, USD/JPY encountered resistance around 156.48 (the high of November 27th), where a short-term rebound may be limited. A break above this resistance level could trigger a short-term bullish correction, targeting the monthly high of 157.00. Overall, USD/JPY remains under pressure amid the Bank of Japan's policy announcement.
Today, consider shorting USD around 155.92; Stop loss: 156.10; Target: 154.90; 154.80
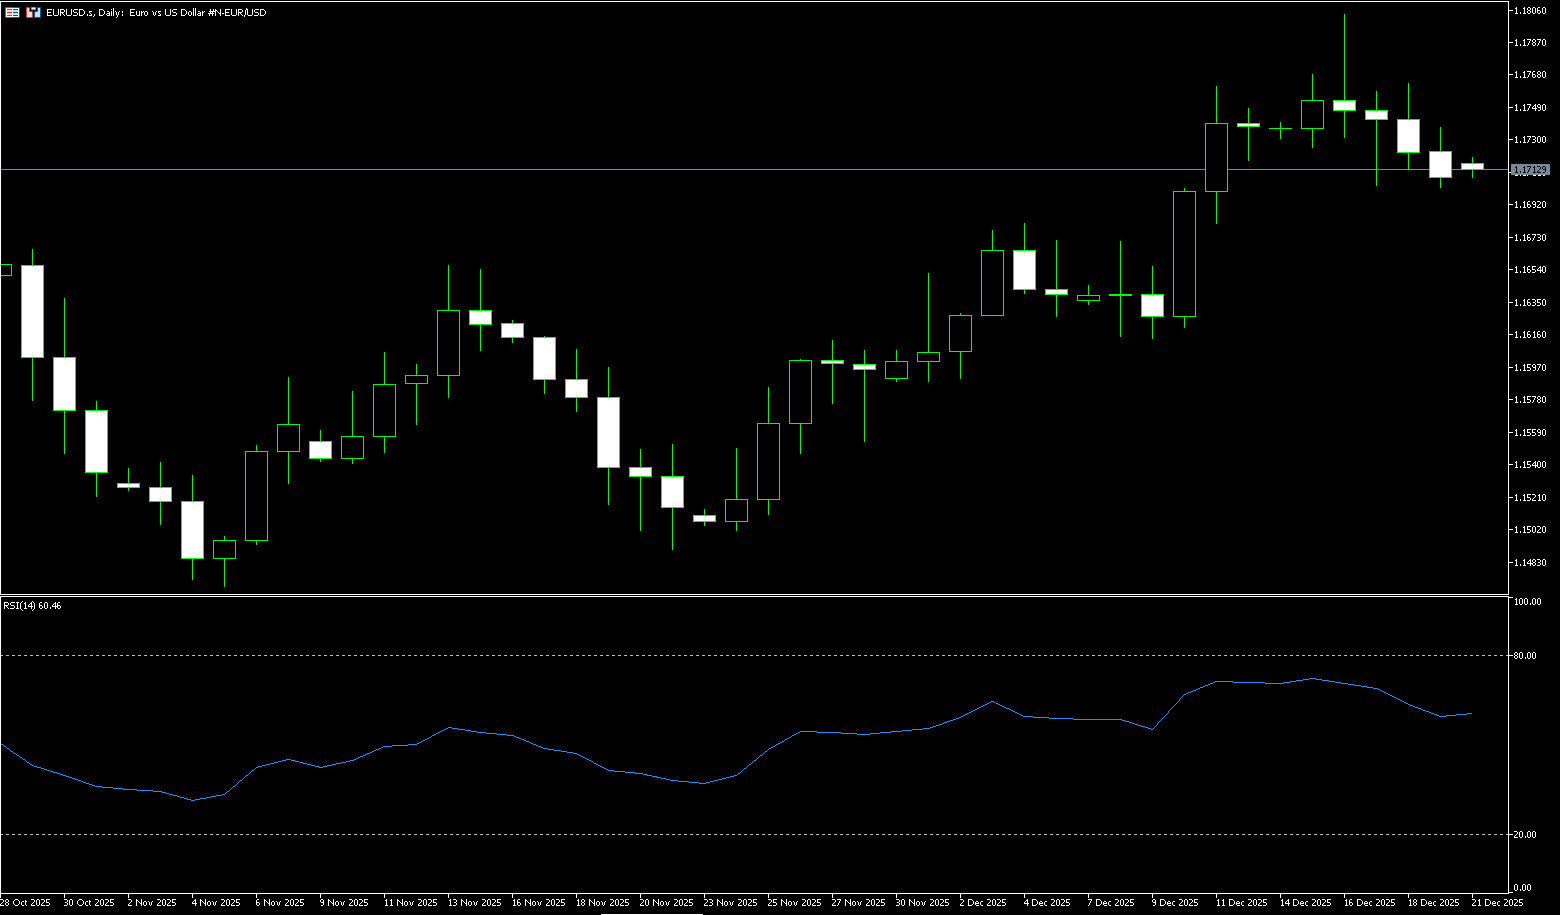
EUR/USD
This week, the euro briefly broke above 1.1800 against the dollar, reaching a relative high since late September, but momentum subsequently weakened, giving back gains. Currently, in early European trading, it has fallen back to around 1.1700. Short-term price movements appear to be driven by a "rise followed by a fall," but behind this lies a battle between two main themes: first, the recalibration of dollar interest rate expectations following US employment data; and second, the upcoming European Central Bank interest rate decision and updated macroeconomic forecasts, making euro bulls more cautious. The latest data shows that non-farm payrolls decreased by 105,000 in October and increased by 64,000 in November. On the surface, the significant decline in October could easily trigger market associations with an economic slowdown, thus depressing the dollar immediately after the data release. However, the subsequent rapid stabilization and rebound of the dollar indicates that traders are more focused on the "underlying components and sustainability of the data" rather than just the single-month result. In this narrative, the drag on the dollar from the employment data appears to be a short-lived shock rather than a trend reversal.
The euro/dollar is consolidating in the middle of the 1.1700-1.1800 range. The 14-day Relative Strength Index (RSI) on the daily chart is bullish, indicating that buyers are in control. However, if they fail to break through the 1.1800 level (a psychological barrier), it will pave the way for further declines. If EUR/USD breaks above 1.1800, it is expected to test the 1.1850 area, eventually reaching the yearly high of 1.1918. Otherwise, EUR/USD may fall below the 10-day simple moving average at 1.1705, and the psychological level of 1.1700, paving the way for a challenge of the 89-day simple moving average near 1.1654, followed by the 1.1600 level.
Consider going long on EUR/USD today near 1.1730; Stop loss: 1.1720; Target: 1.1780; 1.1785
Disclaimer: The information contained herein (1) is proprietary to BCR and/or its content providers; (2) may not be copied or distributed; (3) is not warranted to be accurate, complete or timely; and, (4) does not constitute advice or a recommendation by BCR or its content providers in respect of the investment in financial instruments. Neither BCR or its content providers are responsible for any damages or losses arising from any use of this information. Past performance is no guarantee of future results.
More Coverage


Risk Disclosure:Derivatives are traded over-the-counter on margin, which means they carry a high level of risk and there is a possibility you could lose all of your investment. These products are not suitable for all investors. Please ensure you fully understand the risks and carefully consider your financial situation and trading experience before trading. Seek independent financial advice if necessary before opening an account with BCR.
BCR Co Pty Ltd (Company No. 1975046) is a company incorporated under the laws of the British Virgin Islands, with its registered office at Trident Chambers, Wickham’s Cay 1, Road Town, Tortola, British Virgin Islands, and is licensed and regulated by the British Virgin Islands Financial Services Commission under License No. SIBA/L/19/1122.
Open Bridge Limited (Company No. 16701394) is a company incorporated under the Companies Act 2006 and registered in England and Wales, with its registered address at Kemp House, 160 City Road, London, City Road, London, England, EC1V 2NX. This entity acts solely as a payment processor and does not provide any trading or investment services.

 English
 简体中文
简体中文
 繁體中文
繁體中文
 Bahasa
Melayu
Bahasa
Melayu
 Tiếng
Việt
Tiếng
Việt
 ไทย
ไทย
 日本語
日本語
 한국어
한국어
 ភាសាខ្មែរ
 español