


0
Currency & Commodity Analysis:
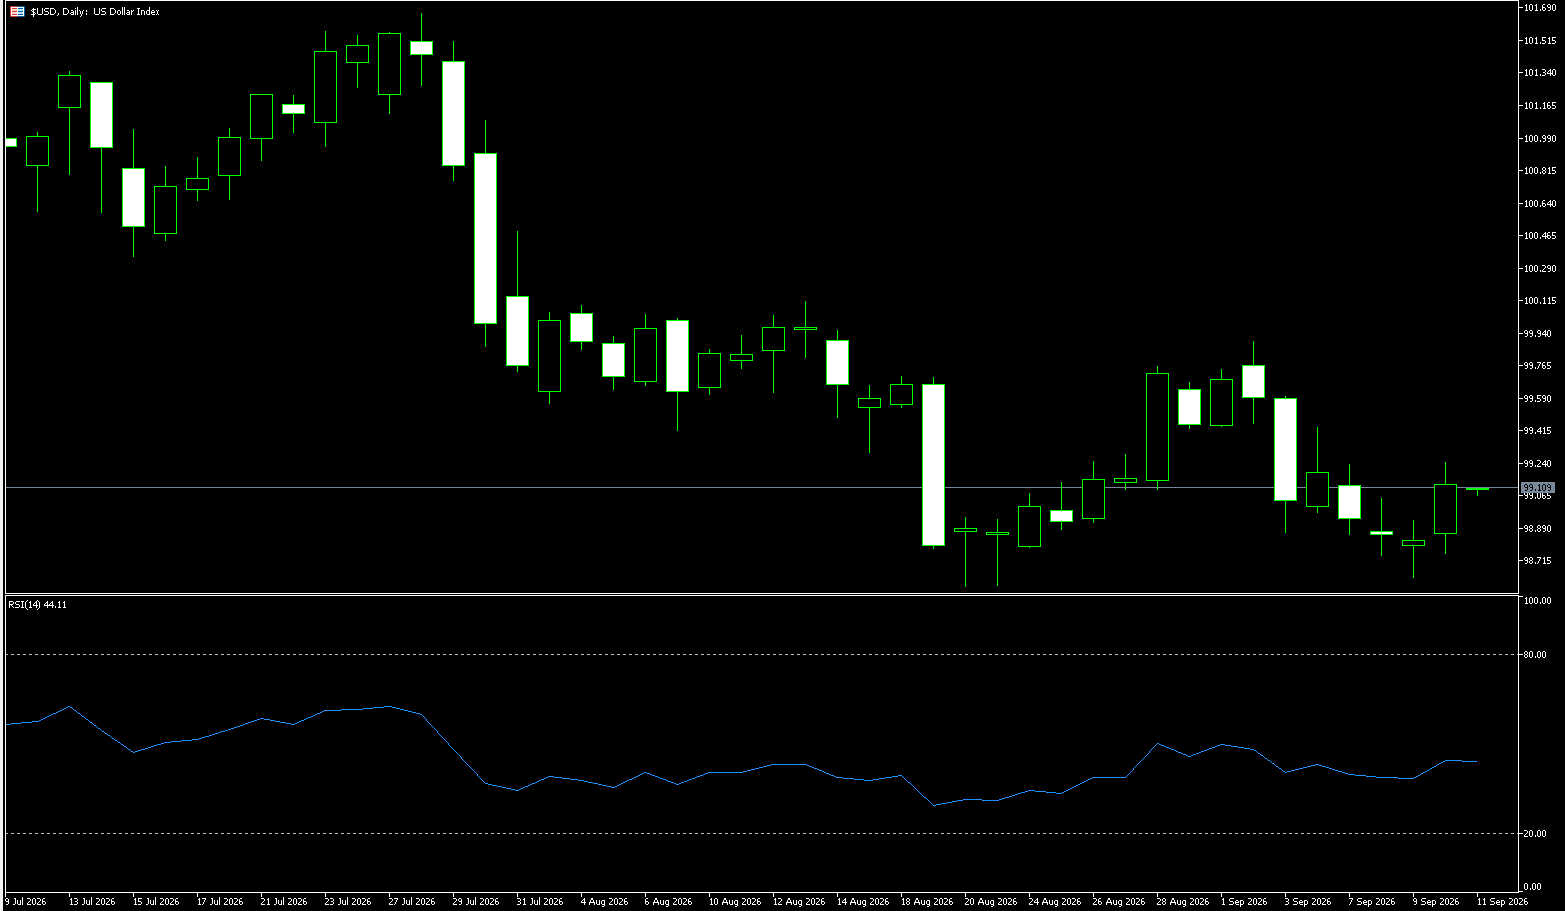
US Dollar Index
The US dollar strengthened in the foreign exchange market last week, with the index briefly hitting a two-month high; expectations for an October rate hike intensified, driven by hawkish rhetoric from the Federal Reserve and robust economic data. The Japanese yen remained under pressure due to the Bank of Japan's cautious stance on rate hikes; the USD/JPY pair briefly touched the 159 level before retreating sharply on Friday following comments regarding potential intervention. The euro and British pound faced downward pressure, while oil prices fluctuated in response to the evolving situation in the Middle East. Market trends are currently dominated by interest rate outlooks and geopolitical factors, suggesting potential for increased volatility ahead. On Monday, the US Dollar Index rebounded slightly to 101.16. Looking ahead, the market will continue to closely monitor speeches by Federal Reserve officials, US economic data, and any new developments in the Middle East. Should oil prices climb again or inflation data exceed expectations, the US dollar could resume its upward trend; regarding the yen, the risk of intervention remains a variable the market cannot ignore as long as the Bank of Japan fails to provide a clearer path for rate hikes. Amidst an environment characterized by both liquidity issues and policy uncertainty, currency market volatility may intensify, requiring investors to remain highly vigilant.
The central issue facing the market today is no longer "whether to raise rates," but rather how long financial markets can withstand a high-intensity monetary tightening environment. From a trading perspective, there is no need to blindly bet on the specific number of rate hikes; instead, focus should be placed on four key signals: whether the US dollar has already priced in rate hike expectations, the true drivers behind rising yields, whether policy divergence among global central banks is narrowing, and whether there are signs of easing geopolitical tensions or cooling inflation. A pullback in oil prices, weakening employment data, or cooling inflation could reverse current market pricing, whereas persistent geopolitical tensions would reinforce the narrative of high interest rates and a strong US dollar. On the upside, the immediate focus is the recent high near 101.40; a decisive break above this level could open the way for further gains toward 101.80 (the June 24 high) and the 102.00 psychological mark. Conversely, if the rally stalls and the price falls below the 100.70 area (near the 9-day moving average), attention will shift to the 100.00 psychological level and support from the 100-day moving average near 100.02. A daily close below the 100.00–100.02 zone could signal a shift from the current bullish structure into a deeper correction.
Consider shorting the US Dollar Index at 101.30; Stop-loss: 101.40; Targets: 100.90, 101.00.
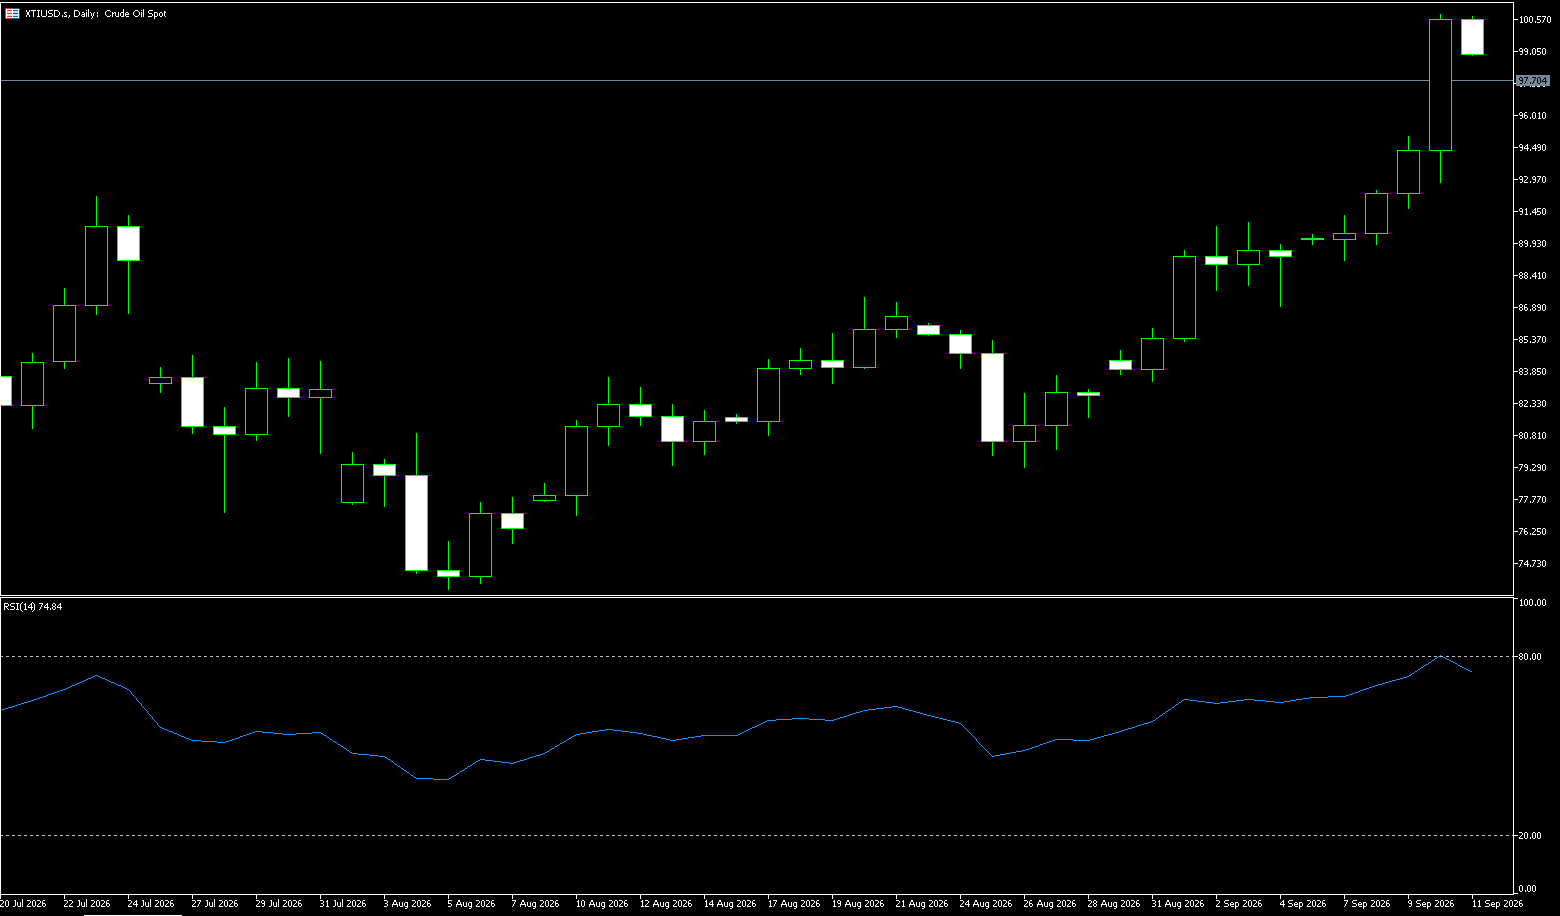
WTI Spot Crude Oil
Crude oil prices rose above $92.00 per barrel on Monday, recovering some of the losses from the previous trading session. This rebound followed President Trump's rejection of Iran's latest proposal regarding the reopening of the Strait of Hormuz, sparking concerns about potential further delays in restoring oil flows through this critical waterway. Trump also remarked that Tehran was being overconfident and anticipated that negotiations would resume this week. Meanwhile, Iran stated it was awaiting a clear response from the U.S. regarding its seven-day plan to reopen the strait and other demands, adding that it would not ease its conditions following Trump's rejection of the latest proposal. Elsewhere in the Middle East, tensions remain high; Saudi Arabia intercepted Houthi drones heading toward Riyadh and a missile targeting Khamis Mushait in the south. Alerts were also issued for energy facilities operated by Saudi Aramco in Abha and Jazan. In the U.S., Trump is considering a ban on diesel exports to address high fuel prices.
On the daily chart, the short-term bias for WTI crude oil is slightly bullish, as the price remains above the 50-day simple moving average of $86.88; despite a recent pullback from the $100 region, the broader uptrend remains intact. Last week's high of $96.57 sits just above the current spot price, acting as immediate resistance, with the psychological level of $100.00 serving as the next target. Meanwhile, the Relative Strength Index (RSI) stands at 56, having retreated from previous overbought levels, suggesting a bias toward consolidation rather than strong upward momentum in the short term. On the downside, intraday support lies in the current pivot zone near $91.47 (the 25-day moving average), with stronger structural demand found at the psychological support level of $90, followed by the 40-day moving average at $87.65; buyers are expected to defend the medium-term bullish structure at these levels in the event of a deeper pullback.
Consider going long on crude oil today at $91.85; stop-loss: $91.70; targets: $93.00, $94.00.
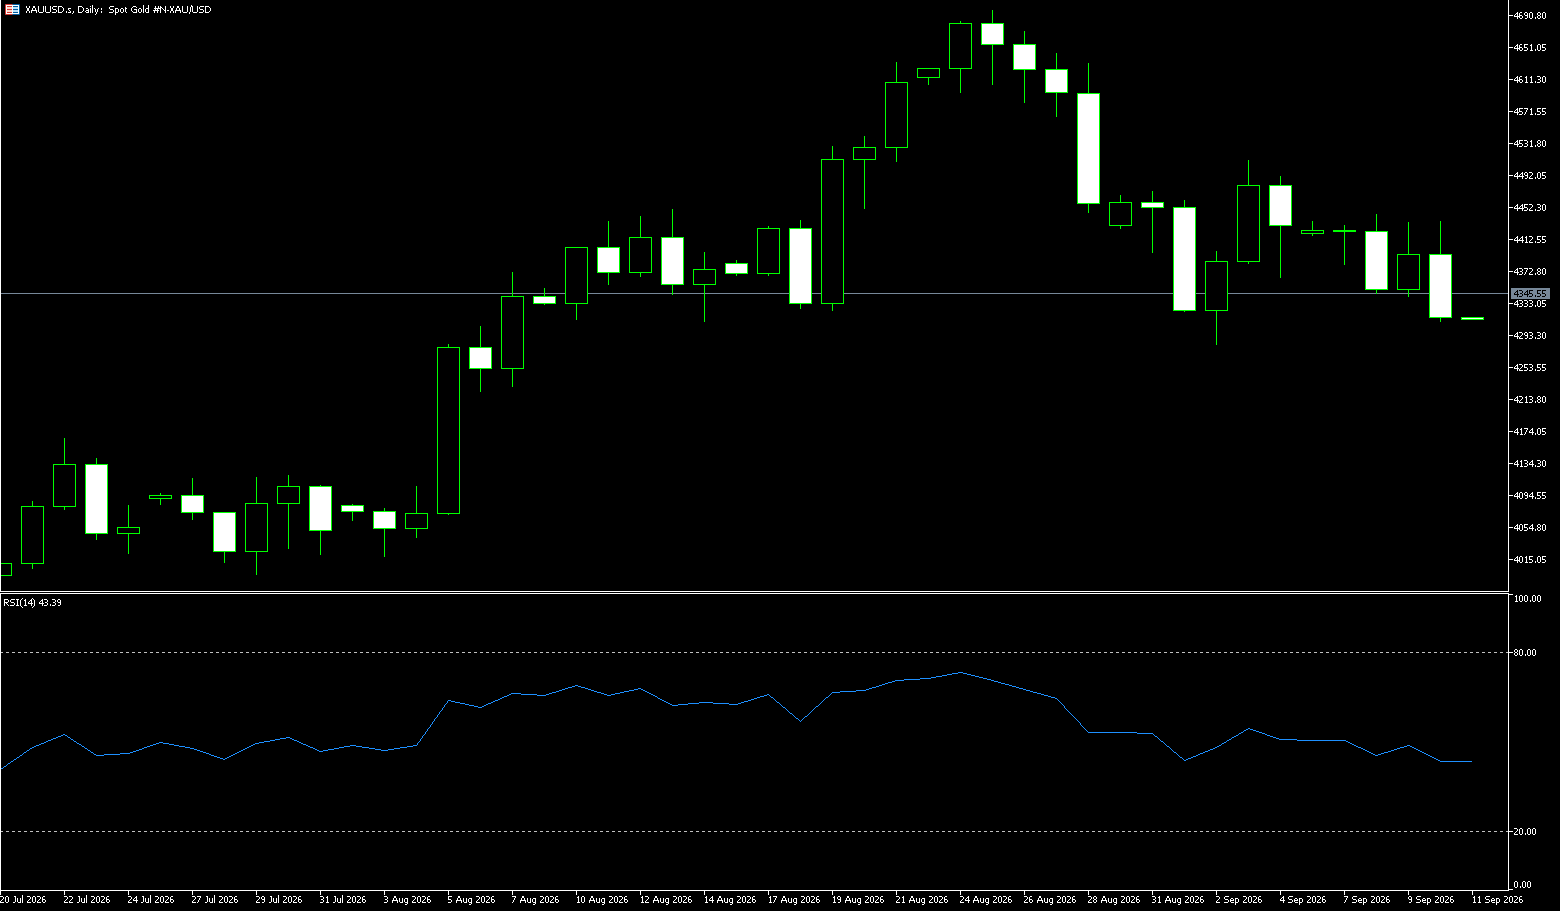
Spot Gold
Gold fell below $4,150 per ounce on Monday, plunging over 3.9% to $4,116—a seven-week low—as stalled negotiations between the US and Iran kept oil prices elevated and fueled expectations that the Federal Reserve would further tighten policy to curb inflation. President Trump rejected Iran's latest proposal regarding the reopening of the Strait of Hormuz, calling Tehran overconfident, though he stated he expected talks to resume this week. Meanwhile, Iran indicated it would not ease the conditions for reopening this strategically vital waterway. In the US, several Fed officials cited robust economic growth and a solid labor market as reasons why further rate hikes might be necessary. Cleveland Fed President Beth Hammack noted that these factors, combined with concerns over government debt, are driving up long-term Treasury yields. Investors are now awaiting the Fed's preferred inflation gauge and US employment data due later this week, which could provide further clues regarding the future direction of monetary policy.
Momentum indicators on the 4-hour chart remain neutral-to-bearish, highlighting the fragility of current attempts at a rebound. The Relative Strength Index (RSI-14) is hovering just below the 50 midline, while the MACD indicator is approaching the zero line. Bulls remain capped below the $4,300 mark; initial resistance lies at $4,298 (100-day moving average) and the $4,300 psychological level—a zone that has repeatedly stifled bullish attempts this week. A confirmed break above these levels would alleviate downward pressure and shift market focus toward the early-September highs just above $4,500. On the downside, $4,100 serves as the week's critical pivot point; while tested multiple times, it has not yet been decisively broken. Gold has formed a series of small bearish candles with long lower wicks, indicating a pause in the decline but lacking clear signals of stabilization or reversal—suggesting weak resistance rather than a trend reversal. Consequently, last week was a period of retracement following a rebound, characterized by a bearish bias within a broad consolidation range. The $4,100 level is the key line of defense for this pullback; holding it maintains the range-bound trade, whereas a decisive break would open the way for a deeper decline toward the $4,000 psychological mark.
Consider going long on gold today at $4,112, with a stop-loss at $4,108 and targets at $4,160 and $4,170.
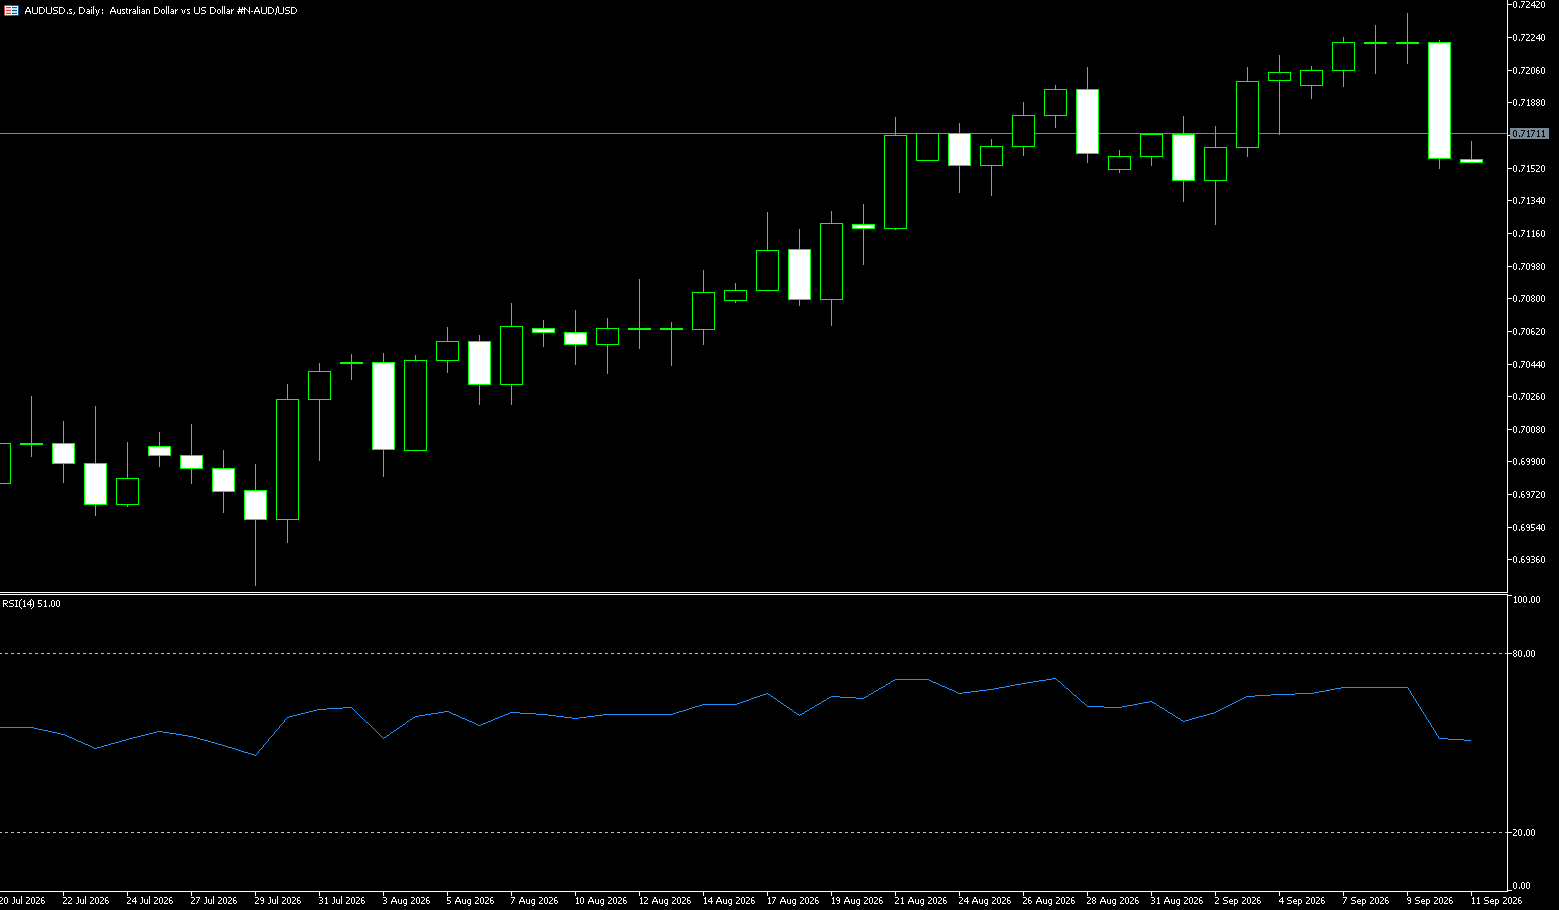
AUD/USD
At the start of the new week, AUD/USD is struggling to hold above the 0.7000 psychological level, trading near the lows seen last Friday—levels not visited since August 4—as traders await the Reserve Bank of Australia's (RBA) pivotal meeting on Tuesday. The RBA is expected to announce a 25-basis-point (bps) rate hike, prompting investors to look for clues regarding the future policy trajectory. Ahead of this key central bank event, a two-month extension of the US-China trade truce is providing support to the Australian dollar, which often serves as a proxy for the Chinese economy. However, the US dollar maintains a bullish tone as markets ramp up bets on another Federal Reserve rate hike in October, driven by inflation concerns linked to oil prices and persistently high US bond yields; meanwhile, geopolitical uncertainty stemming from the US-Iran standoff is also capping gains for AUD/USD.
From a technical perspective, the spot price has settled below the crucial 200-day simple moving average (SMA) at 0.7025, although it has managed to hold the 61.8% Fibonacci retracement level at 0.7007 and the psychological 0.7000 mark. Despite nearby support, the AUD/USD pair retains a short-term bearish bias. Momentum indicators reinforce this negative outlook, suggesting persistent downward pressure and supporting the view that the pair could eventually break below the aforementioned levels. The MACD remains below the zero line with negative histogram bars. Consequently, a decisive break below the 0.7000 round figure would expose deeper support near the 78.6% Fibonacci retracement level at 0.6945, while the previous cycle low of 0.6866 would serve as a more significant structural bottom. On the upside, initial resistance lies at the 50.0% retracement level of 0.7051. A sustained break above these levels would pave the way for further gains toward the 38.2% level at 0.7094 and the 23.6% retracement level at 0.7148.
Consider going long on AUD at 0.7010 today; Stop-loss: 0.7000; Targets: 0.7050, 0.7060.
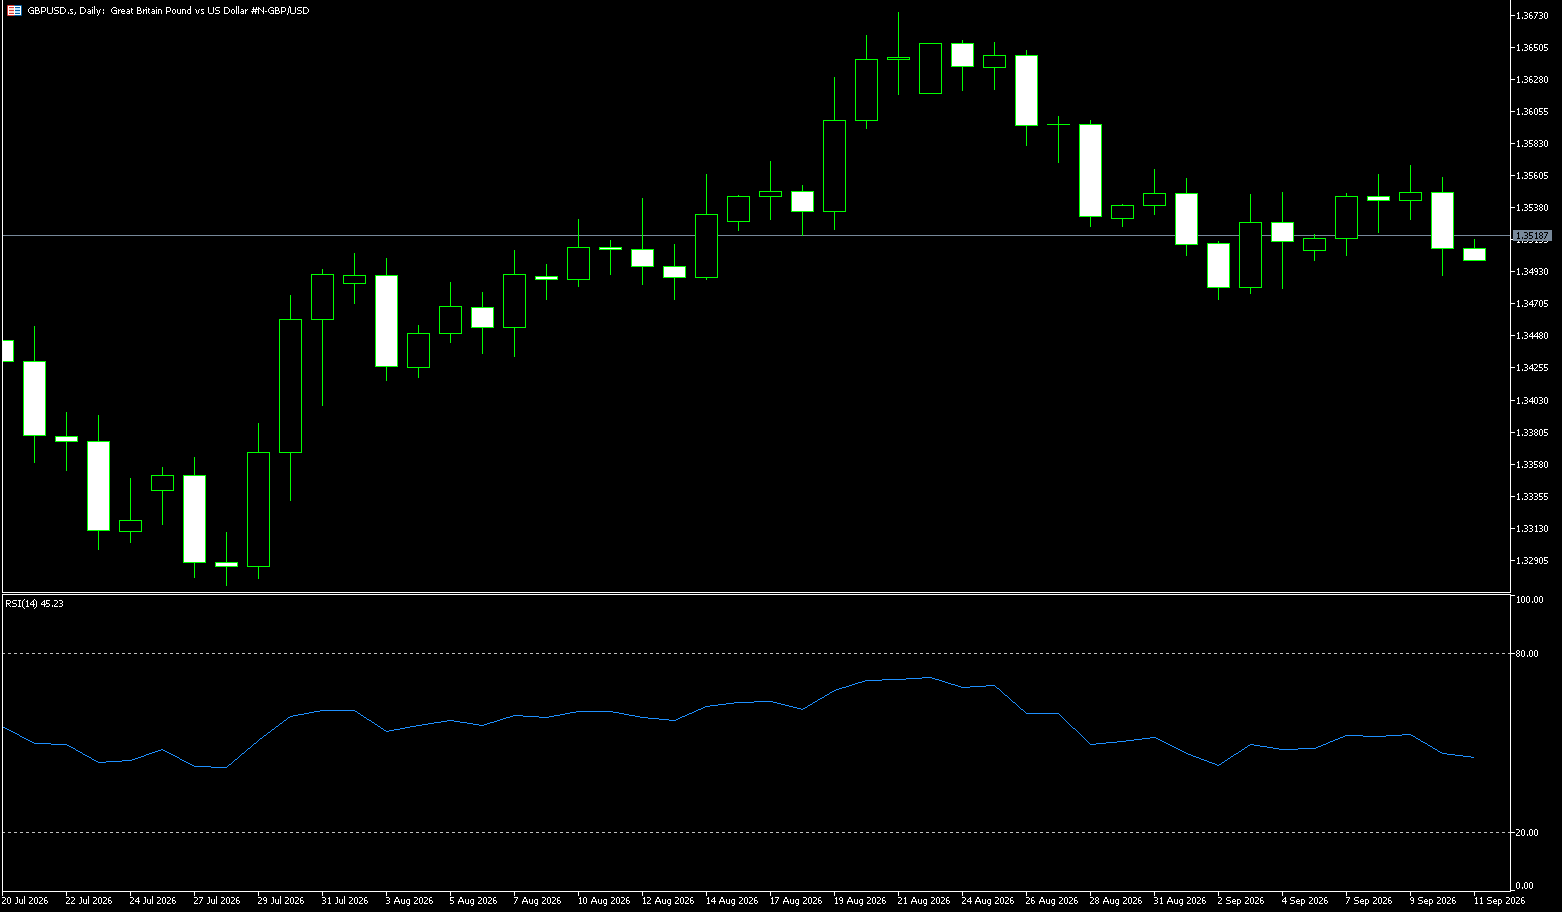
GBP/USD
GBP/USD rebounded from recent lows near the 1.3200 support level last Friday and retested the 1.3250 area on Monday, trading with solid gains. The pair has thus temporarily snapped a multi-day losing streak, gaining upward momentum driven by a weaker US dollar. Sterling has been under pressure, having briefly approached a three-month low against the dollar; while hawkish remarks from Bank of England Governor Bailey provided some support on Friday, the currency has struggled to shake off its overall weakness. Oil price volatility has emerged as a key factor influencing risk sentiment this week. Fluctuating statements from Iran and the US regarding the Strait of Hormuz and ceasefire negotiations caused oil prices to fall, rise, and then retreat. While Trump stated at the UN that US and Iranian officials held productive meetings, he also hinted that a deal might not be reached until after the November midterm elections; meanwhile, Iran maintained that the Strait would not be reopened unless its conditions were met. A drop of over 2% in oil prices on Friday eased inflation concerns to some extent, yet prices remain above $100 per barrel, continuing to exert pressure on global central bank policies.
On the daily chart, GBP/USD remains below both the 20-day and 100-day simple moving averages, maintaining a bearish short-term bias as the price stays capped by a dense resistance zone overhead. The lower Bollinger Band sits just above the current price, highlighting that the recent decline is approaching a lower volatility range, while the 14-day Relative Strength Index (RSI) near 27 indicates oversold conditions—a factor likely to slow the immediate downside rather than trigger an outright reversal. To the upside, initial resistance lies at 1.3308 near the 9-day simple moving average, a minor pivot point slightly above the current price. Further up, the next hurdle is the 1.3350 level, followed by the 1.3400 psychological resistance, which forms a broader zone of overhead pressure. On the downside, initial support for the major currency pair lies at the 1.3200 mark, followed by the June 24 low of 1.3140. A break below this level, accompanied by sustained selling pressure, could pave the way toward the November 21, 2025 low of 1.3038.
Consider going long on GBP at 1.3243 today; stop-loss: 1.3230; targets: 1.3290, 1.3300.
USD/JPY
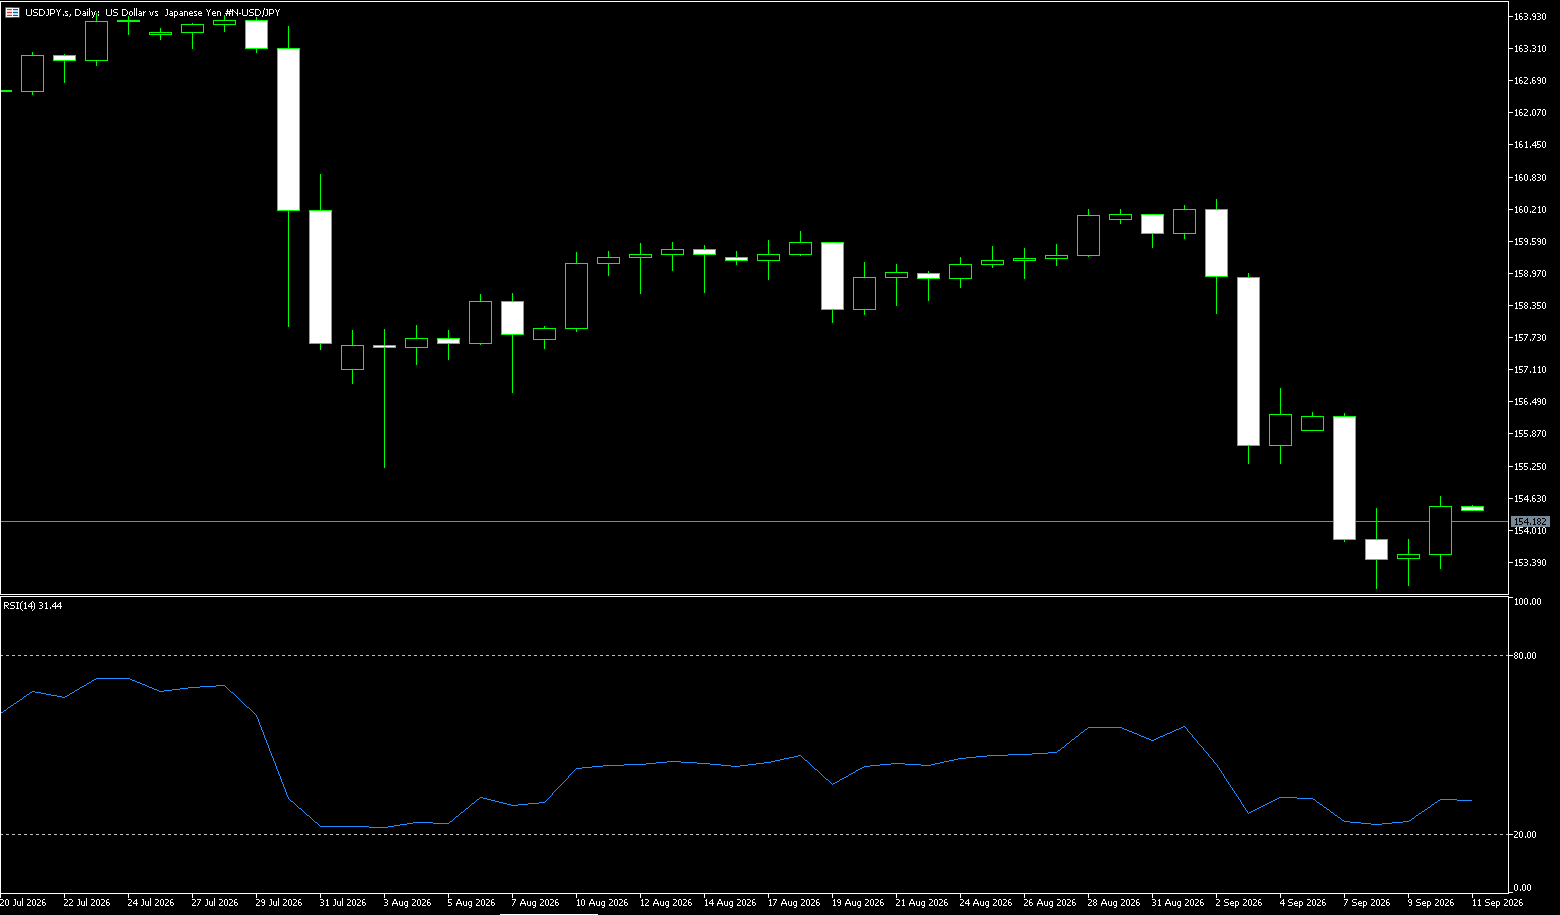
USD/JPY attracted some dip-buying at the start of the new week, recovering a portion of the losses sustained last Friday—a drop driven by speculation that authorities would intervene again to support the yen. However, the Bank of Japan's (BoJ) relatively dovish tone has capped the yen's upside. Meanwhile, the US dollar has regained momentum, providing further support to the pair. The yen experienced significant volatility last week; while the BoJ raised interest rates to a 31-year high of 1.25%, two dissenting votes and a lack of clear guidance on future rate hikes left the market unconvinced regarding the central bank's policy path. USD/JPY climbed toward 157.48 and continued to rise over subsequent sessions, hitting 159.05—its highest level since September 2—and recording five consecutive days of gains. Reduced liquidity due to a three-day holiday in Japan amplified exchange rate fluctuations, with traders closely monitoring for any signs of intervention. A Nikkei report stating that Japanese officials were conducting "rate checks"—often viewed by the market as a precursor to intervention—helped the yen stabilize slightly near its lows, though it remains generally weak. While direct intervention around the 157.00–157.50 range is considered unlikely by the broader market, sentiment remains notably tense. As long as US interest rates remain firm, the yen is likely to continue trading within a range.
On the daily chart, USD/JPY stands at 157.50, maintaining a short-term bearish bias as the spot price remains below the 55-day moving average (158.87) and the 159.05 area (last Thursday's high). Trading below this short-term trend proxy suggests that upside attempts will likely be limited given the weak momentum; the 14-day Relative Strength Index (RSI) hovers near 52, indicating weak demand without yet entering oversold territory. On the upside, immediate resistance lies at the 5-day moving average of 158.52, the first hurdle for any rebound attempt. The next levels are the 55-day moving average (158.87) and the 159.05 area (last Thursday's high); the price remaining consistently below these levels reinforces the bearish tone. With a lack of clear immediate downside support, market focus remains on whether sellers can sustain pressure below 159.59; the 157.00 round number is a level to watch, and a break below it would target the 20-day moving average at 156.22.
Consider shorting USD at 157.60 today; Stop Loss: 157.75; Targets: 156.80, 156.60.
EUR/USD
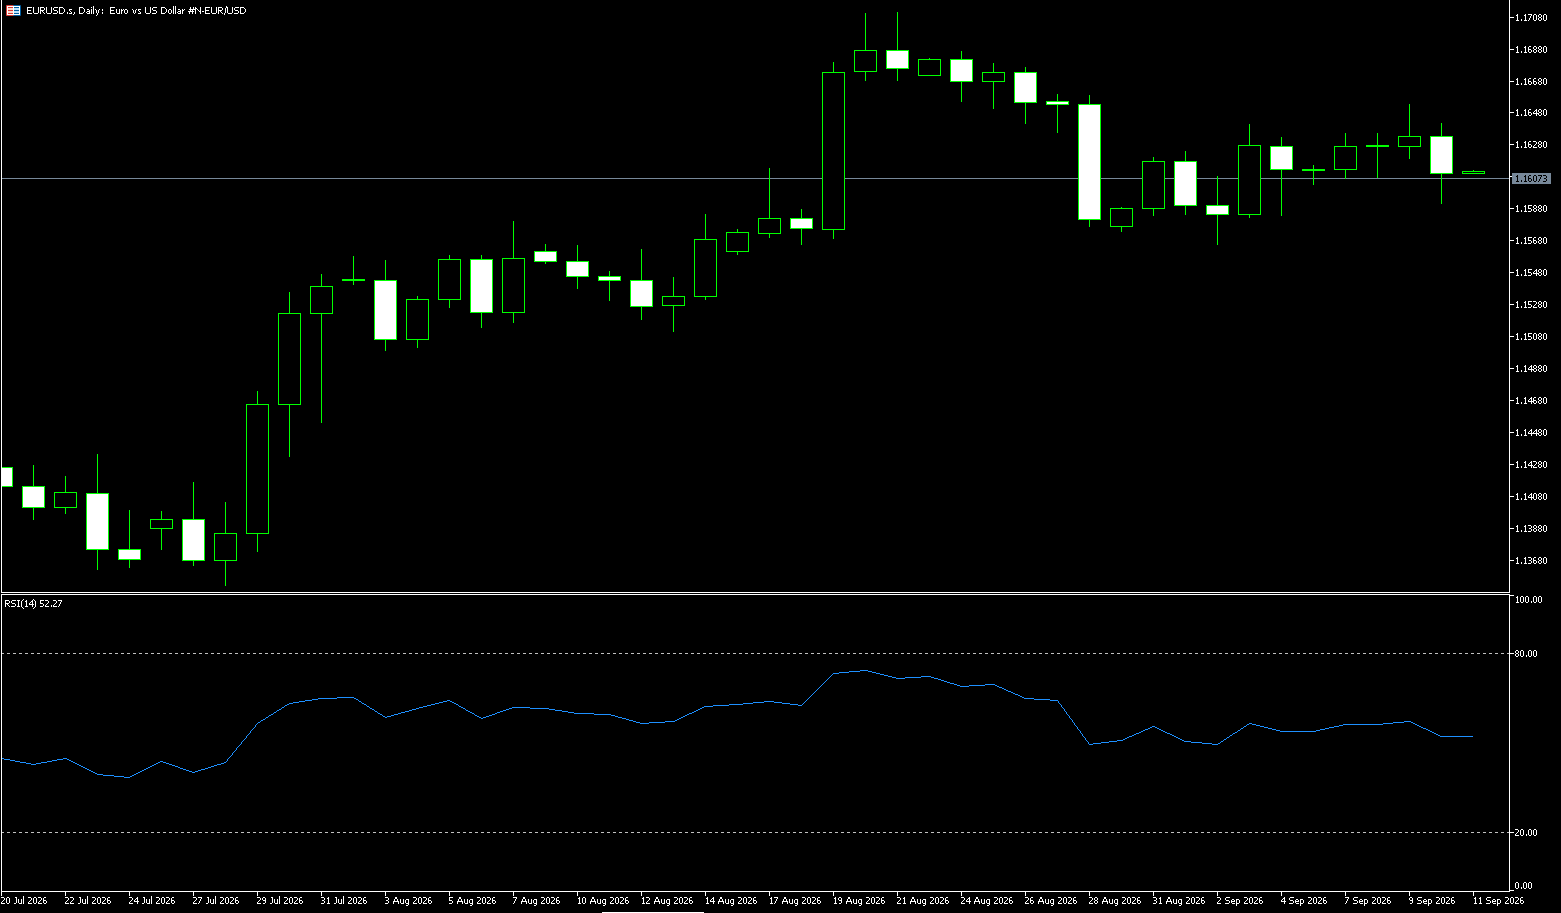
The EUR/USD exchange rate fell to 1.1370 during Monday's trading session. Over the past month, the pair has declined by 1.83%, and by 3.04% over the past 12 months. Historically, the EUR/USD exchange rate reached an all-time high of 1.87 in July 1973. The euro only began circulating as a currency on January 1, 1999; however, by considering the weighted averages of predecessor currencies, a synthetic historical price dating back much further can be modeled. The Euro performed weakly last week, declining for several consecutive days and briefly touching a low near 1.1359 against the US dollar—a level not seen since late July. Concerns regarding European political stability arose following the performance of a far-right party in a northeastern German state election, while personnel changes within the European Central Bank added uncertainty to the policy outlook. Although the Eurozone's preliminary composite PMI indicated continued economic resilience, persistent pressure from Middle East conflicts driving up energy costs contributed to the Euro's third consecutive weekly decline—marking its longest losing streak of the year.
On the daily chart, the EUR/USD pair remains under significant bearish pressure, trading well below the 100-day (1.1528) and 20-day (1.1523) simple moving averages; these levels are capping upside potential and reinforcing a short-term negative bias. The 14-day Relative Strength Index (RSI) sits near 27—in oversold territory—suggesting that while downward momentum is strong, the sell-off may be becoming overextended. To the downside, initial support lies near the lower Bollinger Band at 1.1340; sellers might hesitate to push the price further toward the 1.1300 psychological support level without a corrective rebound. On the upside, initial resistance is concentrated at the 1.1400 round-number mark, followed by resistance near the 9-day simple moving average at 1.1430. Only a recovery above these levels would alleviate the current bearish tone and allow for a challenge of the 100-day (1.1528) and 20-day (1.1523) simple moving average zone.
Consider going long on the Euro at 1.1360 today; stop-loss: 1.1350; targets: 1.1400, 1.1410.
Stock Analysis:
Australia ASX 200 Stock Index
Market Overview:
ASX 200 closes 0.2% higher ahead of RBA decision
The ASX 200 index rose 0.2% on Monday to close at 8,680 points, snapping a losing streak, as the utilities, industrials, and healthcare sectors boosted market sentiment. Sentiment improved after the government announced that the budget deficit for the 2025/26 fiscal year would be approximately $6 billion smaller than anticipated, driven by stronger investment and revenue. In China, industrial profits grew steadily from January to August, though the pace of growth slowed due to uneven activity. However, gains were capped as oil prices rose—following President Trump's rejection of Iran's ceasefire terms—and US stock index futures fell sharply; meanwhile, Treasury yields remained at multi-year highs amid expectations of further policy tightening by the Federal Reserve. Domestically, the Reserve Bank of Australia is expected to raise the cash rate for the fourth time this year to curb inflation.
Shares of Northern Star Resources rose 6.2% after rejecting a $38 billion takeover bid from Gold Fields. CSL climbed 2.8%, while shares of the "Big Four" banks gained between 0.5% and 1.6%. Stocks that declined included Genesis Minerals (-5.8%), Lynas Rare Earths (-3.2%), and NEXTDC (-2.7%). Sector Performance:
Top-performing sectors: Banking, Utilities, and Healthcare (defensive sectors led the gains); gold miner Northern Star surged following acquisition news.
Laggards: Certain mining stocks, rare earths, and tech growth stocks weakened; performance within the resources sector was mixed.
Technical Analysis:
The ASX 200 closed at 8,680 on Monday, posting a modest gain of 0.2%. The index recovered from an intraday low and briefly tested levels above 8,700; however, bullish momentum waned in the afternoon, causing a pullback that prevented it from holding the 8,700 mark. The resulting candlestick featured an upper shadow—a pattern typical of cautious positioning ahead of a major announcement. Daily chart: A small bullish candle; prices remain below the 20-, 50-, and 200-day EMAs, maintaining the bearish structure of medium-term moving averages. Trading range: Intraday low of 8,612 (holding the key support level of 8,602) and intraday high of 8,711 (with 8,736 remaining the primary short-term resistance). Monday's summary: Support at 8,602 held, providing a brief respite, but the rebound lacked strength and heavy resistance looms at 8,736. Market sentiment is one of "wait-and-see," with capital awaiting the RBA interest rate decision scheduled for Tuesday at 14:30 AEST.
Technical Outlook: With the RBA interest rate decision and policy statement approaching, the market consensus anticipates a 25bp rate hike to 4.60%. The market focus lies not on the hike itself, but on the wording of the post-meeting guidance (specifically, whether it hints at further rate hikes). Indicator outlook: If the RSI rebounds to the 45–50 range, it will act as a strong short-term resistance zone; bullish momentum will only truly improve if the RSI establishes itself above 50. Forecast for three scenarios on Tuesday—Baseline scenario (highest probability): 25bp rate hike with neutral-to-hawkish guidance. The index initially spikes to test the 8736 level, then faces resistance and pulls back; it fluctuates throughout the day, likely closing in the 8630–8720 range, maintaining low-level oscillation and a generally weak trend. Optimistic scenario: 25bp rate hike but with a dovish statement implying a pause in future hikes. The index breaks above 8736 on high volume and continues upward to challenge 8817; a close above 8736 is required to open up room for a short-term rebound. Pessimistic scenario: 25bp rate hike plus explicitly hawkish stance, retaining room for further hikes. Rapid sell-off breaks below 8602; closing below 8602 signals a resumption of bearish momentum, with a downside target of 8540.
On Monday, the 8602 support level held, leading to a short-term oversold correction, though the rebound lacked strength. Tuesday's market action will be entirely driven by RBA policy guidance. 8736 serves as the short-term watershed for strength/weakness, while 8602 is the critical line between bulls and bears. Maintain light positions or stay on the sidelines until the news is released; wait for directional confirmation before trading—do not bet on a one-sided move.
Trading Strategy (Short-term perspective)
Bullish approach (betting on an oversold rebound driven by a dovish RBA stance; a contrarian short-term long trade)
• Entry conditions: After the RBA announcement, the index pulls back to stabilize near 8620 and closes with a bullish candle, provided there is no hawkish rhetoric.
• Stop-loss: Below 8590 (abandon long position if 8602 is decisively broken).
• Take-profit: First target 8736 (reduce position by half upon reaching); exit remaining position at 8817—do not hold long-term.
Do not load up on "bottom-fishing" positions prematurely; opening long positions before the decision is a high-risk gamble. Bearish Strategy (Aligning with the medium-term primary trend)
• Entry Conditions: After the decision, if the price spikes to the 8730–8736 range and forms a bearish candle with a long upper shadow (indicating a rejection of highs); or if it breaks below 8602 on high volume.
• Stop-loss: Close above 8760.
• Take-profit: First target at 8602; if broken, look toward 8540.
Wait-and-See Strategy (Preferred for low risk appetite)
Reduce positions before the decision; do not open positions early; wait for the RBA outcome and confirmation of market direction before entering.
Position Management: Total position ≤15% before the decision; total position not to exceed 30% after direction is confirmed.
Key Risk Warnings:
1. RBA Decision "Black Swan" Risk (Primary risk for Tuesday): If guidance is unexpectedly hawkish, the banking and REIT sectors could plummet, causing the index to rapidly break 8602 and gap down; if unexpectedly dovish, the index could spike upward, triggering a short-squeeze (stop-loss cascade). Liquidity volatility will intensify during the announcement, significantly increasing the risk of futures slippage.
2. Overseas Correlation Risk: Volatility in overnight US stock markets and Treasury yields may spill over to resource stocks, disrupting the index.
3. Technical "Bull Trap": A positive decision might trigger a one-day spike or rebound, but this is likely just a temporary correction. Unless the price stabilizes above 8817, this should not be viewed as a trend reversal; do not switch to a medium-to-long-term bullish stance.
4. Sector Divergence Risk: Resource stocks are influenced by commodity prices and overseas demand; their independent price movements may disrupt the overall index trend.
Japanese Stock Market Index (JP225)
Market Overview:
Japan's Nikkei Index Ends Five-Day Winning Streak
The Nikkei 225 index fell 0.73% on Monday, closing at 65,878 points; it surrendered earlier gains, ending a five-day winning streak. The decline followed a surge in oil prices, triggered by President Trump's rejection of Iran's latest proposal regarding the Strait of Hormuz, while Tehran maintained it would not ease the conditions for reopening this vital waterway. Global bond yields also climbed due to rising inflation risks and expectations of further monetary policy tightening. Investors grew cautious ahead of Micron Technology's earnings report later this week, which may offer clues regarding the outlook for AI-related demand.
Separately, the Chinese government has indicated it might allow certain companies to purchase Nvidia's new RTX Pro 5500 chips. Notable decliners among tech stocks included Kioxia (-4.4%), Ibiden (-4.4%), and Lasertec (-2.2%).
Sector Performance:
Top-performing sectors: Banking, Insurance (Financials); Utilities (Electricity, Gas); Domestic Retail (led by Fast Retailing/Uniqlo)
Worst-performing sectors: Semiconductors/Semiconductor Equipment (highest impact on the Nikkei); Precision Instruments, Electronic Components; Pharmaceuticals, Mining (weakness persisted from Monday, with a high probability of continued underperformance)
Technical Analysis:
Close on Monday (Sept 28): 65,877.62 (-0.73%), down 486.58 points. Intraday structure: Opened at 66,505.94; rallied to a high of 67,034.74 in the morning session but faced resistance and retreated, resulting in a "rally-then-retreat" pattern and a bearish close near the highs. Dropped to a low near 66,165 and continued to slide toward the close, finishing in the lower half of the day's range; the formation of a bearish candle with a long upper shadow indicates selling pressure overhead. Closed lower following high-level volatility; short-term moving averages shifted from support to resistance; RSI retreated from high levels into a neutral-to-weak zone, signaling a decline in bullish momentum. Volume: High volume accompanied the initial rally, while persistent selling pressure marked the subsequent decline, clearly indicating profit-taking by foreign investors at high levels. Sector Drivers: Semiconductor and AI tech stocks weighed on the index, whereas export-oriented automotive stocks showed relative resilience. Core Logic: Weakness in overnight US tech stocks, combined with expectations of a slight yen rebound, exerted downward pressure on export-oriented companies that carry significant weight in the Nikkei index.
Tuesday Technical Outlook: Core Assessment: Volatility with a bearish bias at high levels; the market will likely test lower support levels first. Holding support implies continued range-bound trading, while a breakdown would trigger a deeper correction. Tuesday Scenario Forecasts—Bearish Scenario (Baseline): Overnight US market weakness and yen appreciation put immediate pressure on the opening, testing the 65,450 level; a breach here would accelerate the decline toward 64,900. Consolidation/Recovery Scenario: US markets stabilize and the yen weakens, leading to an index rebound; the rally faces resistance near 66,400 before pulling back, maintaining a range-bound pattern. Bullish Reversal Scenario (Low Probability): A strong rebound in overseas markets drives a high-volume breakout above 67,035, returning the index to an upward trend channel. Trading Strategy:
Operational Strategy (Short-term perspective; suitable for Hang Seng Index / HSI futures traders)
Bullish Outlook (Tactical play on a rebound; use light positions)
• Entry: Go long with a small position if the price stabilizes after pulling back to 65,450, without setting a new low and showing a candlestick pattern indicating a halt in the decline.
• Stop-loss: Below 65,250 (cease long positions if the first support level is decisively broken).
• Target: 66,000–66,400; exit in batches upon reaching the resistance zone—do not overstay the trade.
Bearish Outlook (Baseline scenario)
• Entry: Initiate a light short position if the price faces resistance upon rebounding to the 66,300–66,400 range (e.g., candlestick closes with a short upper shadow, RSI turns downward).
• Stop-loss: Above 67,050 (abandon the bearish view if the Monday high is breached).
• Target 1: 65,450; Target 2: 64,900.
Key Risk Warnings:
1. JPY Exchange Rate Risk (Major variable for the Nikkei): A rapid decline in USD/JPY (JPY appreciation) directly pressures export-heavyweight stocks and can trigger a sharp drop in the index; conversely, JPY depreciation benefits Japanese stocks and can quickly reverse technical patterns.
2. Overnight US Market Correlation: The Nikkei closely tracks US technology stocks; significant overnight volatility in the Nasdaq can directly cause a gap at the Tuesday open, potentially breaching preset stop-loss levels.
3. BoJ Expectation Volatility: Inflation data, employment figures, or official statements may alter interest rate hike expectations, causing fluctuations in Japanese government bond (JGB) yields and impacting Japanese stock valuations.
4. Price Gap Risk: Significant price gaps frequently occur during the Asia-Pacific trading session; preset stop-loss orders may not execute at the intended price, resulting in slippage.
Disclaimer: The information contained herein (1) is proprietary to BCR and/or its content providers; (2) may not be copied or distributed; (3) is not warranted to be accurate, complete or timely; and, (4) does not constitute advice or a recommendation by BCR or its content providers in respect of the investment in financial instruments. Neither BCR or its content providers are responsible for any damages or losses arising from any use of this information. Past performance is no guarantee of future results.
More Coverage





2026 © - All Rights Reserved by BCR Co Pty Ltd
Risk Disclosure:Derivatives are traded over-the-counter on margin, which means they carry a high level of risk and there is a possibility you could lose all of your investment. These products are not suitable for all investors. Please ensure you fully understand the risks and carefully consider your financial situation and trading experience before trading. Seek independent financial advice if necessary before opening an account with BCR.
BCR Co Pty Ltd (Company No. 1975046) is a company incorporated under the laws of the British Virgin Islands, with its registered office at Trident Chambers, Wickham’s Cay 1, Road Town, Tortola, British Virgin Islands, and is licensed and regulated by the British Virgin Islands Financial Services Commission under License No. SIBA/L/19/1122.
Open Bridge Limited (Company No. 16701394) is a company incorporated under the Companies Act 2006 and registered in England and Wales, with its registered address at Kemp House, 160 City Road, London, England, EC1V 2NX. Open Bridge Limited acts solely as a payment processor for BCR Co Pty Ltd and does not provide any financial, trading, or investment services on its behalf. Open Bridge Limited's role is limited to payment processing.


 English
 简体中文
简体中文
 繁體中文
繁體中文
 Bahasa
Melayu
Bahasa
Melayu
 Tiếng
Việt
Tiếng
Việt
 ไทย
ไทย
 日本語
日本語
 한국어
한국어
 ភាសាខ្មែរ
 español