


0
Currency & Commodity Analysis:
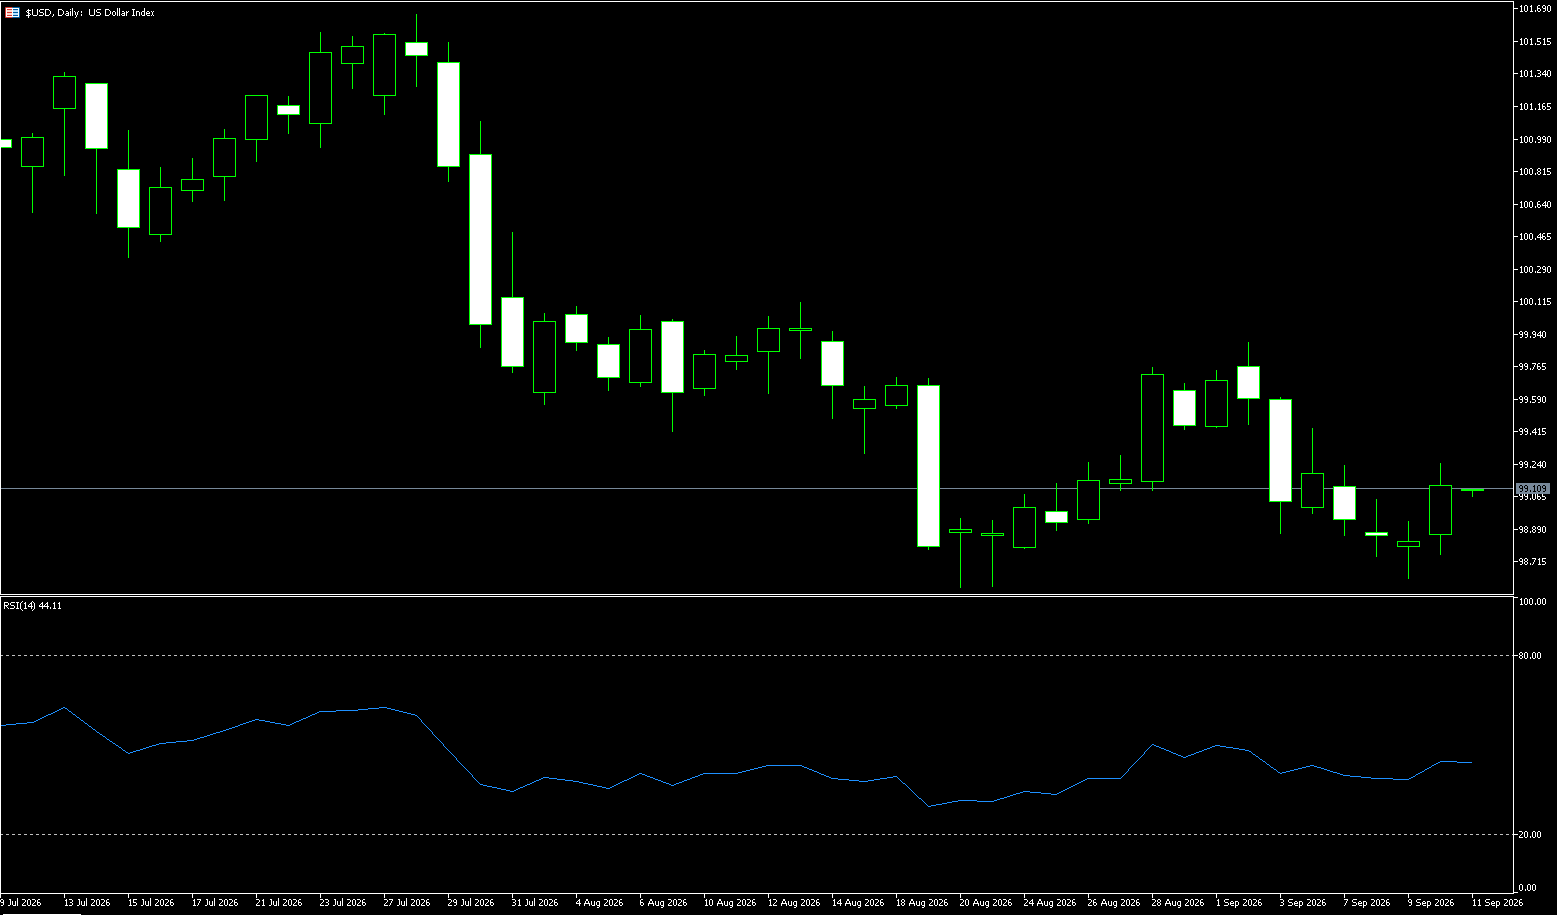
US Dollar Index
The US Dollar Index rose more than 0.4% on Wednesday, breaking above the 101 level to reach an eight-week high. This move followed data showing US business activity expanding at its fastest pace in over five years, fueling expectations of further Federal Reserve rate hikes. The S&P Global Flash US Composite PMI climbed to 58.4 in September—its highest level since July 2021—signaling a significant acceleration in economic activity. Meanwhile, Brent crude oil prices broke above $100 per barrel, snapping a five-day losing streak. Traders now price in a nearly 60% probability of another 25-basis-point rate hike next month, while the odds of a further hike in December stand at approximately 48%. The market is also monitoring progress in efforts to resolve the conflict with Iran; investors are keeping a close watch on US-Iran negotiations, which could improve risk sentiment.
On the daily chart, the US Dollar Index (DXY) spot rate is trading near 101.00. The index remains above the upper Bollinger Band at 100.89, maintaining a bullish short-term tone as prices extend their rally away from short-term trend reference levels. The 14-day Relative Strength Index (RSI) sits at 70—nearing overbought territory—indicating strong momentum following the recent rise, though conditions appear slightly stretched. On the downside, the 100.52 area (near Wednesday's low) serves as immediate support, followed by the 9-day simple moving average at 100.11; these levels reinforce potential demand zones during any pullback. To the upside, initial resistance lies at 101.50 (July 29 high), with the next level at the 102 psychological mark. Given the lack of nearby technical resistance levels, momentum indicators suggest the index might consolidate or undergo a minor pullback before rising further.
Consider shorting the US Dollar Index today at 101.20; Stop Loss: 101.30; Targets: 100.70, 100.60.
WTI Spot Crude Oil
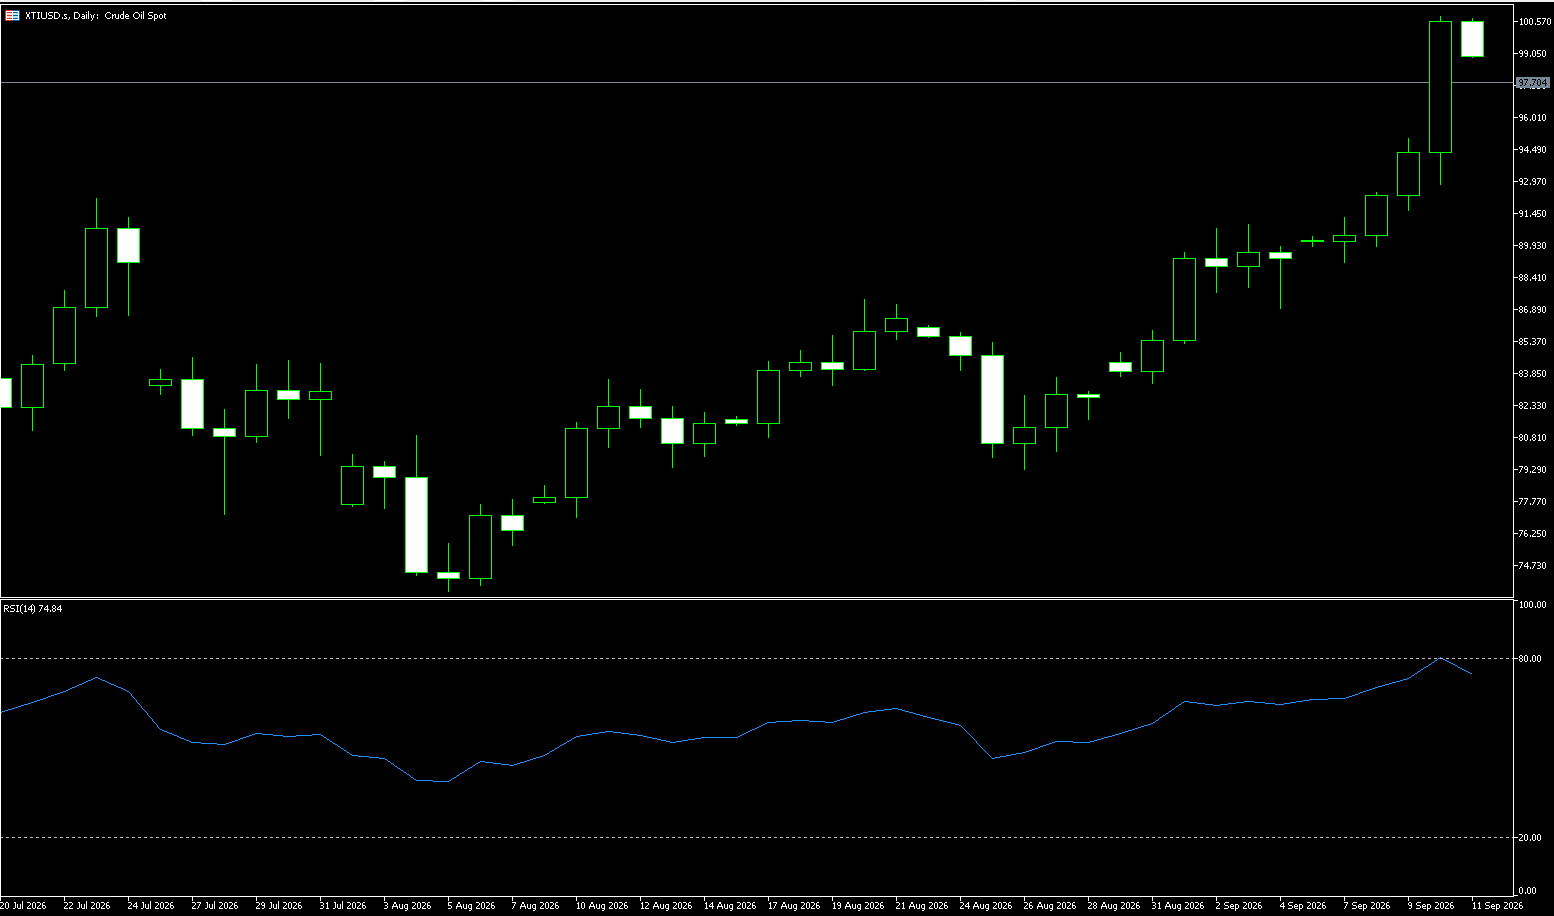
On Wednesday, crude oil prices broke above $91.00 per barrel following five consecutive days of declines, driven by persistent uncertainty regarding negotiations between the US and Iran. Iranian President Masoud Pezeshkian stated at the UN General Assembly that Tehran remains open to diplomacy but refuses to negotiate under pressure, while the Iranian military warned it was prepared to deliver a "more devastating" blow in response to Trump's threat—made during his UN speech earlier this week—to annihilate Iran. Following Trump's threat, he described talks with Iranian envoys as productive, while Tehran indicated it might reopen the Strait of Hormuz if Washington eased military pressure and lifted restrictions on Iranian ports. Saudi Arabia's partial resumption of operations on the East-West Pipeline helped alleviate some supply concerns. Additionally, Ukrainian President Zelenskyy called on US President Trump to organize a trilateral meeting with Russian President Putin; Zelenskyy also stated that he had discussed an energy ceasefire with Trump.
From a daily chart perspective, WTI retreated rapidly after previously breaking above $100 and is currently retesting the short-term support zone near $90. The price remains above the 100-day simple moving average (approx. $84.97), meaning the medium-term trend has not yet fully shifted to bearish. Regarding Bollinger Bands, the middle band sits around $92.08, representing the initial resistance level the current rebound must overcome, while the upper band near $102.38 corresponds to higher resistance from the previous strong rally. Meanwhile, the RSI stands at approximately 52.75, having retreated significantly from highs into neutral territory; this indicates waning upward momentum, though the market has not yet entered clearly oversold territory. In the short term, the $90 level serves as a key price pivot. If WTI can hold this zone and reclaim the $92.08 level (Bollinger Bands midline), the market may retest the $95 mark or even the $100 psychological level; if the $90 support fails, the next target would be the 100-day moving average at approximately $84.97, with further attention on the Bollinger Bands lower band near $81.79. Overall, the daily chart structure retains some medium-term bullish foundations, though short-term momentum has clearly weakened.
Consider going long on crude oil today at $91.80; stop-loss: $91.60; targets: $93.00, $94.00.
Spot Gold
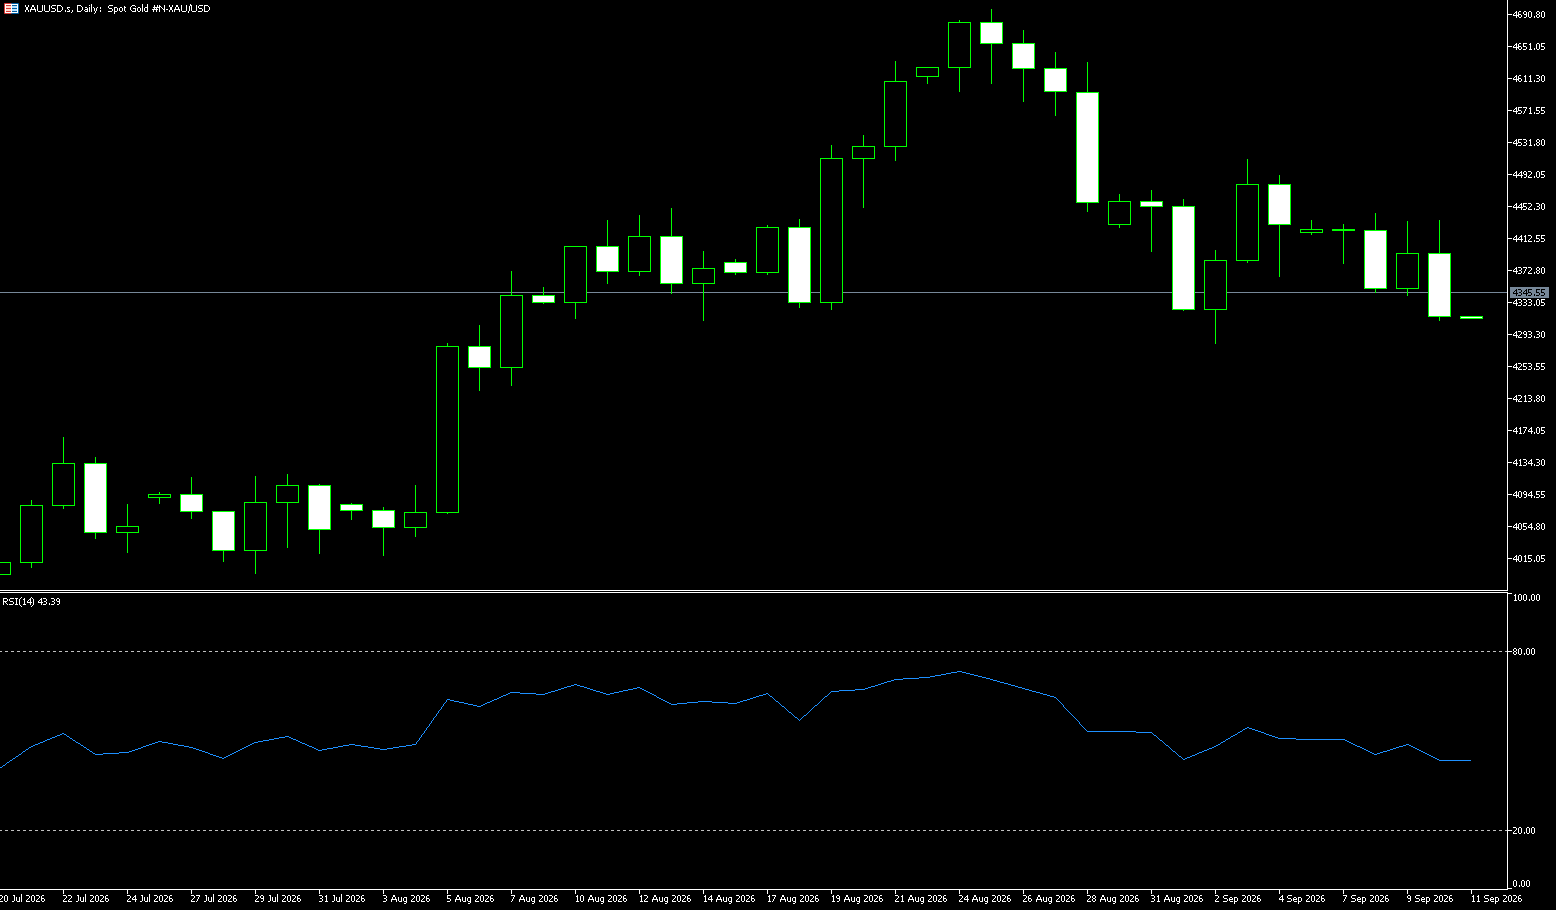
Gold continued to decline on Wednesday, dropping to around $4,280 per ounce under pressure from a strengthening US dollar, as stronger-than-expected PMI data and hawkish comments from Federal Reserve officials fueled expectations for tighter monetary policy. Data showed US business activity accelerating for the fourth consecutive month in September—reaching its fastest pace in over five years—pushing the dollar to a near two-month high. Richmond Fed President Tom Barkin stated that higher interest rates and the prospect of further hikes could curb inflation expectations without significantly slowing economic activity. The Fed raised rates last week and signaled the possibility of another hike before year-end. According to the CME FedWatch Tool, traders currently estimate a nearly 60% probability of a rate hike in October. Geopolitically, President Trump has threatened further action against Iran while hinting that a deal could soon be reached through renewed diplomatic efforts.
From a daily chart perspective, spot gold remains below the 100-day simple moving average (SMA) of $4,313. The price is approaching the $4,300 mark and the $4,313 zone (100-day SMA); this area represents the initial technical resistance level that must be breached for the current rebound to continue. A decisive move above the $4,300–$4,313 range could open up further room for a short-term recovery, potentially extending toward the $4,400 psychological level, which serves as a more distant technical resistance point. The 14-day RSI stands at approximately 48, indicating a neutral zone where neither bulls nor bears hold a clear, one-sided advantage; future direction will largely depend on how the gold price reacts to key moving averages and Bollinger Band levels. On the downside, Wednesday's low near $4,275 serves as the primary support level. If the price pulls back but holds this area, the current rebound structure remains intact; however, a decisive break below this level would signal a weakening of the recent bullish structure, potentially leading the market to test levels near $4,257 (the September 17 low) and $4,221 (the lower Bollinger Band).
Consider going long on gold today at $4,284, with a stop-loss at $4,280 and targets at $4,330 and $4,340.
AUD/USD
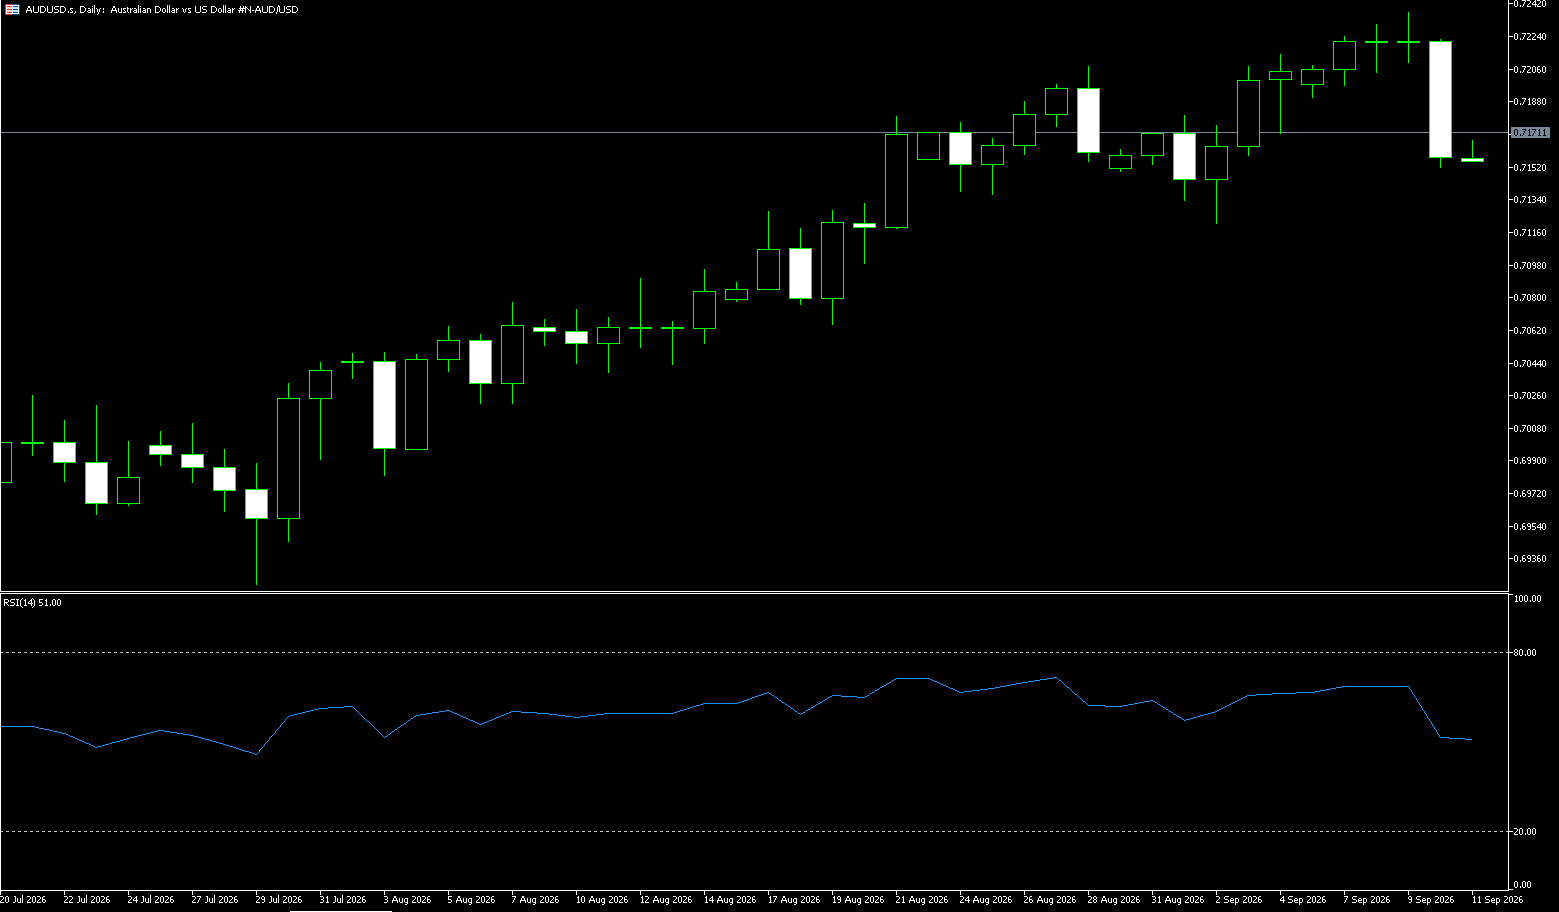
The AUD/USD pair fell 1.07% on Wednesday and is trading near 0.7040 at the time of writing, weighed down by a strengthening US dollar and weak Australian activity data. The Australian dollar weakened earlier in the day following the release of preliminary S&P Global Purchasing Managers' Index (PMI) data for September. Australia's Composite PMI dropped to 50.8 from 52.7 in August, remaining only slightly above the 50-point threshold that separates expansion from contraction. Details of the report revealed a contraction in manufacturing activity and a slowdown in the services sector. Weak data appears to have dampened market expectations regarding the Reserve Bank of Australia's (RBA) tightening path, although the market still anticipates a 25-basis-point rate hike next week. Meanwhile, the US manufacturing PMI rose to 57—well above the expected 53.5—providing a fresh boost to the US dollar. The US Dollar Index (DXY), which tracks the greenback against a basket of six major currencies, climbed 0.53% and traded near 101.25 after hitting a two-month high.
On the daily chart, the AUD/USD pair is hovering around the 0.7040 level, holding above the 0.7000–0.7015 zone. The 14-day Relative Strength Index (RSI) sits at approximately 35.77, and the Average Directional Index (ADX) is near 22 (indicating weak trend strength); these metrics suggest a consolidation phase rather than a strong trend, implying that bulls may need a new catalyst to challenge upper resistance levels. On the downside, initial support lies at the 0.7000 psychological level, with further support nearby at 0.6946 (the July 30 low) and deeper demand seen at the 0.6900 mark. On the upside, immediate resistance is found at 0.7154 (20-day Simple Moving Average) and the 0.7100 round number; a breakout above these levels would pave the way for a broader bullish extension.
Consider going long on AUD at 0.7030 today; Stop Loss: 0.7020; Targets: 0.7080, 0.7100.
GBP/USD
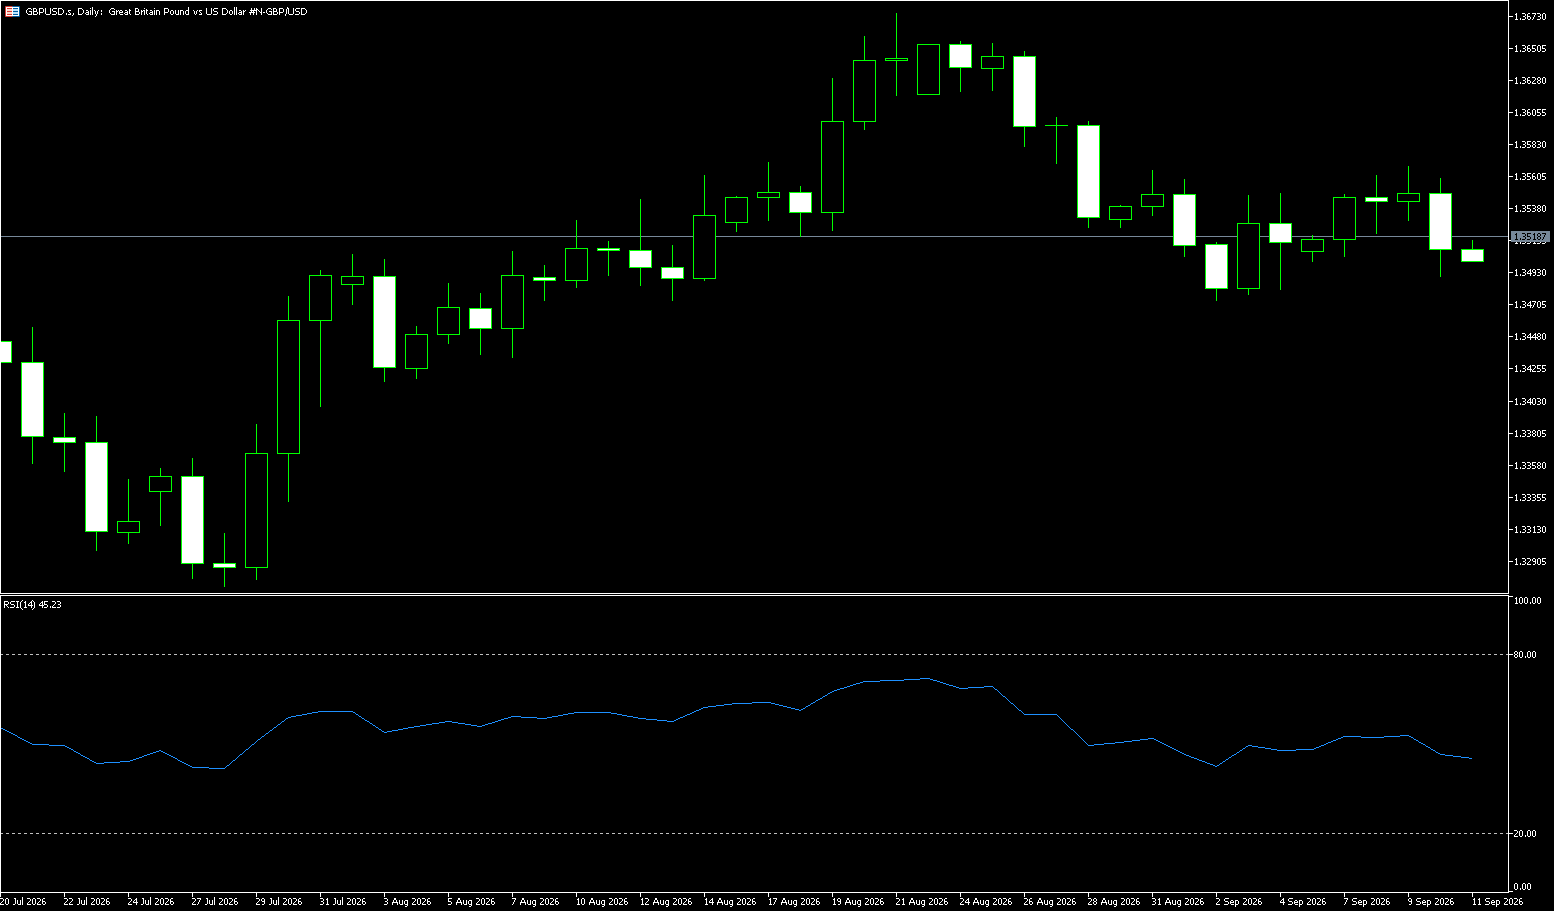
On Wednesday, the GBP/USD pair plunged more than 0.70% as US economic data showed a rebound in business activity, while concerns over a potential US diesel export ban drove crude oil prices higher. GBP/USD traded at 1.3253, marking its lowest level since July 1. The pair declined as a strong surge in US PMIs and hawkish Federal Reserve rhetoric bolstered the dollar; rising oil prices—denominated in US dollars—also contributed to the greenback's strength. The US Dollar Index, which tracks the greenback against a basket of six currencies, rose 0.52%, climbing above the 101.00 mark for the first time since July 30. S&P Global data showed the preliminary Manufacturing Purchasing Managers' Index (PMI) for September came in at 57, far exceeding the expected 53.5 and the previous reading of 53.9. Meanwhile, the Services PMI rose from 56.5 to 58.7—also beating expectations—while the Composite PMI climbed from 56 to 58.4. Amidst this strong US data, Federal Reserve Governor Michael Barr stated that further rate hikes might be necessary to ensure inflation returns to the 2% target in a timely manner, effectively adding his name to the list of known "hawks" on the Federal Open Market Committee (FOMC).
The GBP/USD pair remains capped below the 9-day Simple Moving Average (SMA) at 1.3399 and below the Fibonacci retracement level situated at the midpoint of the trading range. The spot price sits slightly below the 61.8% retracement level of 1.3343, reinforcing a mildly bearish bias. Initial support is found at the 78.6% retracement level of 1.3253, with a further structural floor at the 1.3200 mark, aligning with recent swing lows. On the upside, immediate resistance lies at the 1.3300 round number; a break above this points to the 5-day SMA at 1.3342, followed by higher hurdles near the SMA at 1.3399.
Consider going long on GBP at 1.3240 today; Stop Loss: 1.3225; Targets: 1.3280, 1.3300.
USD/JPY
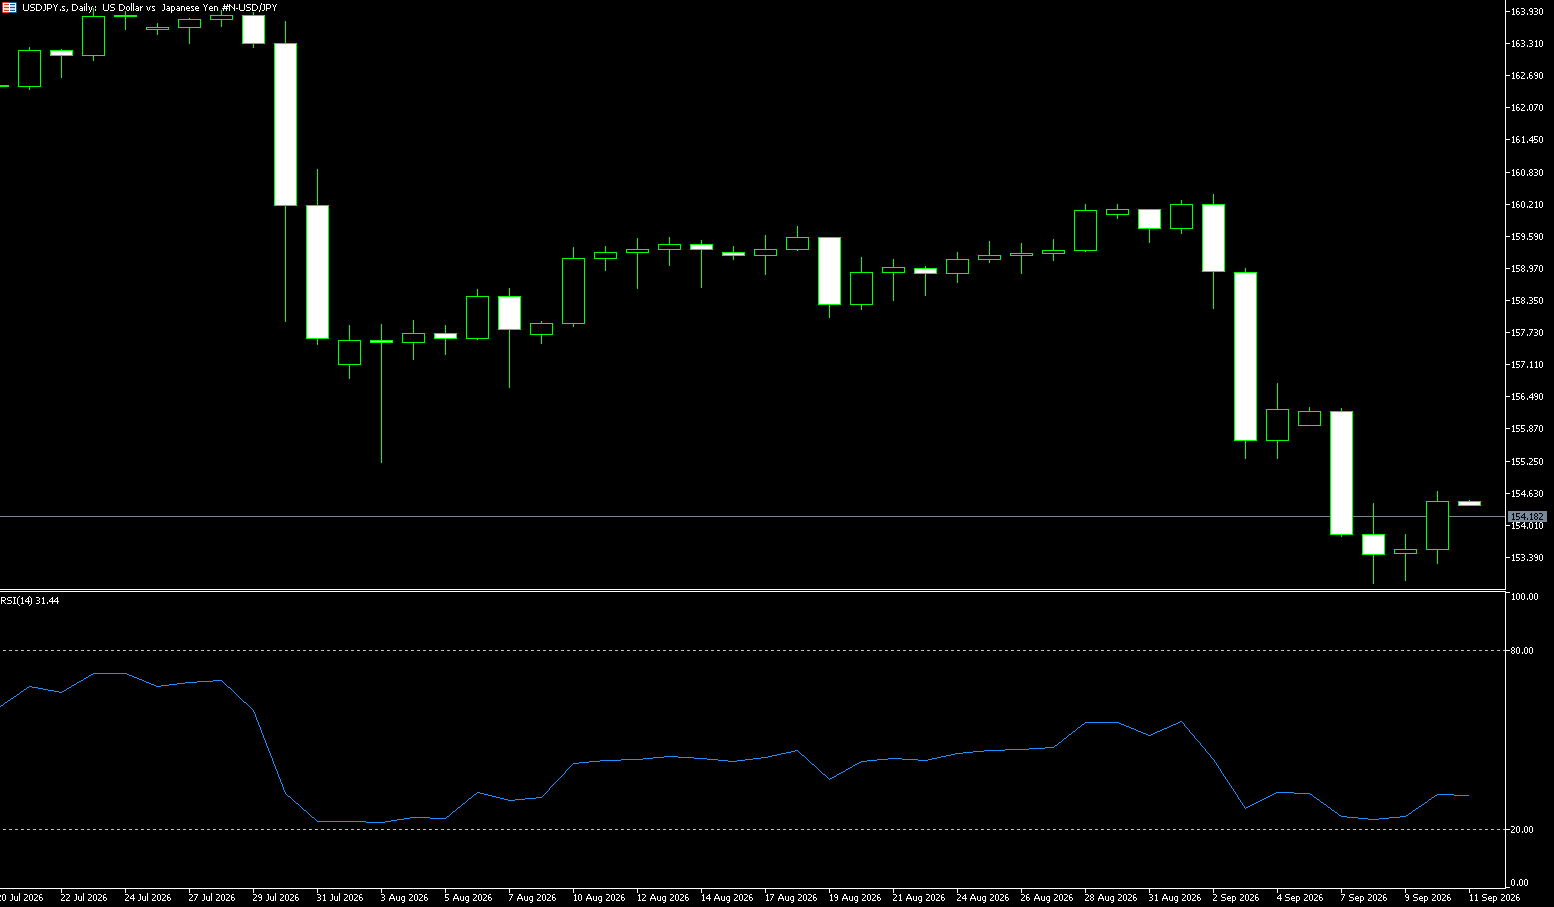
The Japanese yen remained under pressure on Wednesday, depreciating to around 158.30 per dollar, keeping traders on alert for potential intervention during Japan's long holiday. Tokyo has previously intervened in the forex market during periods of low holiday liquidity, and concerns have intensified following reports last Friday that the Bank of Japan conducted a rate check with market participants. The yen is also facing pressure from a strong US dollar, as hawkish comments from Federal Reserve officials fuel expectations for further US rate hikes. Last week, the yen fell sharply following a widely anticipated rate hike by the Bank of Japan—a decision two policymakers dissented against. Governor Kazuo Ueda stated that the Bank of Japan remains committed to raising rates and adjusting the degree of monetary easing based on changing economic conditions, while noting that accommodative financial conditions are expected to persist to support economic growth.
On the daily chart, USD/JPY remains within a broad range, trading below the 100-day simple moving average (SMA) at 159.54 but above the 20-day SMA at 156.59. This structure suggests the pair is consolidating between trend resistance and short-term range support; the Relative Strength Index (RSI) stands at 56.36, leaning slightly bullish but not yet signaling overbought conditions. To the upside, initial resistance lies at the 100-day SMA (159.54); should buying momentum return, the psychological level of 160.00 would serve as the next resistance barrier. To the downside, immediate support appears at 157.18 (5-day SMA), with deeper structural support at 156.59 (20-day SMA), where a stronger pullback phase might temporarily pause.
Consider shorting USD/JPY at 158.50 today; Stop Loss: 158.70; Targets: 157.50, 157.40.
EUR/USD
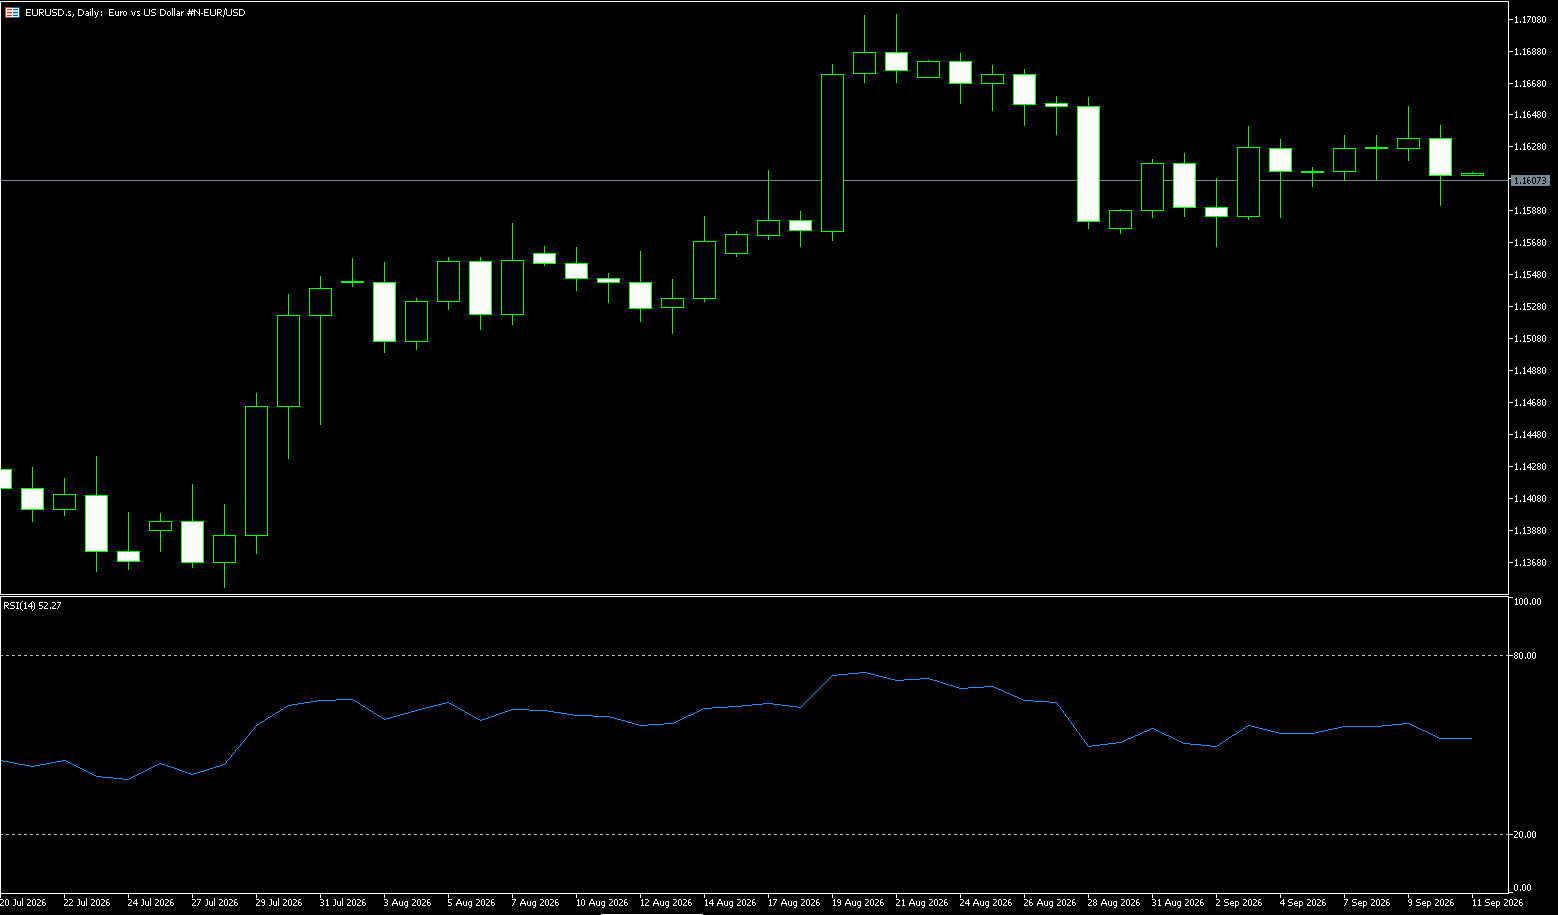
On Wednesday, EUR/USD extended its intraday decline as stronger-than-expected US business activity data reinforced market expectations for further Federal Reserve rate hikes and boosted the US dollar. At the time of writing, the pair is trading near 1.1390, a level last seen in late July. Preliminary data shows the S&P Global US Composite PMI rising to 58.4 in September from 56.0 in August. The Manufacturing PMI climbed to 57.0, surpassing the expected 53.5, while the Services PMI rose to 58.7, exceeding the forecast of 56.0. Both readings improved compared to August. The survey indicated a sharp rise in prices paid by businesses, intensifying inflation concerns. Robust PMI data gives policymakers room to focus more on inflation. The US Dollar Index, which tracks the greenback against a basket of six major currencies, is trading near 101.00, marking its highest level since July 31.
On the daily chart, EUR/USD maintains a bearish short-term tone, remaining below both the 100-day moving average (1.1540) and the 20-day simple moving average (1.1561). The price sits just above the lower Bollinger Band at 1.1353 (the July 28 low), indicating the pair is hovering near the bottom of its recent trading range; meanwhile, the 14-day Relative Strength Index (RSI) stands at 25.90—deep in oversold territory—suggesting that downside momentum is stretched, though a reversal has not yet been confirmed. To the upside, initial resistance lies at the 5-day simple moving average (1.1453) and the 1.1500 psychological level. On the downside, immediate support is found near 1.1353 (the July 28 low); a sustained break below this level could pave the way for a continuation of the bearish trend toward the 1.1300 mark, whereas holding above this level might trigger a period of consolidation below the aforementioned cluster of moving averages.
Consider going long on the Euro at 1.1380 today; stop-loss: 1.1370; targets: 1.1440, 1.1450.
Stock Analysis:
ASX 200 Index (Australia)
Market Overview:
The ASX 200 index finished virtually flat on Wednesday at 8,765 points; strong performances in consumer durables, industrials, and non-energy minerals largely offset declines in the energy, technology, and healthcare sectors. The local market reversed earlier gains as traders awaited Australian labor market data due Thursday and digested September's flash PMI readings, which showed slowing service sector growth and weak manufacturing output. Meanwhile, US stock futures edged higher following Wall Street's near-record close on Tuesday, buoyed by a pullback in oil prices and growing market expectations for an end to the conflict in the Middle East. Attention is focused on the upcoming bilateral summit between President Trump and Chinese President Xi Jinping; despite fragile relations, hopes for trade progress are rising.
BHP rose 1.4% and Rio Tinto gained 0.8% as China increased copper stockpiles ahead of the holiday. Other notable gainers included Northern Star Resources (4.0%), Evolution Mining (2.2%), and Goodman Group (3.0%). However, energy stocks fell, with Woodside Energy dropping 2.0% and Santos declining 1.8%.
Sector Performance:
Top-performing sectors: Mining (Materials) and Real Estate (REITs) strengthened; resource stocks benefited from stabilizing commodity prices, while the REITs sector rebounded to provide a floor for the index.
Worst-performing sectors: Utilities fell sharply (-2.21%), while Energy and Telecommunications weakened, capping the broader market's upside; Healthcare and Technology sectors faced slight pressure.
Technical Analysis:
ASX 200 closing level on Wednesday: 8,760.9 points (up 3.1 points, or +0.04%). Intraday action saw an initial rise followed by a pullback; the index traded within a narrow range throughout the day before closing almost flat—a classic "wait-and-see" pattern ahead of key data releases. Intraday Structure: The market edged up slightly in the morning session to test overhead resistance, but bullish momentum subsequently waned, leading to a choppy pullback. In the afternoon, the index traded sideways within a narrow range as the tug-of-war between bulls and bears remained balanced. Trading volume contracted slightly compared to the previous day, reflecting a strong "wait-and-see" sentiment among investors ahead of Thursday's Australian employment data. Price action remained confined to the 8708–8780 range, indicating continued consolidation within a box pattern. The RSI (14) remained in neutral territory, showing no clear signs of overbought or oversold conditions. Moving Averages: Short-term moving averages flattened out, with the index hovering closely around them, indicating no clear directional trend. Chart Pattern: The range-bound consolidation pattern persisted without a decisive breakout, representing a period of pre-data accumulation or anticipation.
Technical Outlook for Thursday (Sept 24)—Key Event: The Australian monthly employment report. This is the primary variable for the day, as the data is expected to break the current trading range. Three scenarios are projected for Thursday: Bullish Scenario (employment data misses expectations)—weaker data fuels expectations of a rate cut, pushing the index to break above 8780 with a target of 8830 (prerequisite: holding above 8780 on high volume). Neutral Scenario (data meets expectations)—the index remains within the 8708–8780 range, continuing narrow consolidation with limited volatility. Bearish Scenario (employment data exceeds expectations)—strong employment figures delay rate cut expectations, causing the index to test 8708; a high-volume break below this level would lead to a further test of the key support at 8656.
Trading Strategy (Short-term Perspective)
1. Long Entry Conditions: If employment data is bearish for the AUD and the index holds above 8780 on high volume, consider a long position upon a pullback to the 8770 area; place the stop-loss below 8750, with a target of 8820–8830.
2. Short Entry Conditions: If employment data is unexpectedly strong and the index breaks below 8708 on high volume, consider a short position upon a rebound to the 8720 area; place the stop-loss above 8745, with a target near 8660. Key Risk Warnings:
1. Data Risk: Australian employment data is prone to significant deviations from expectations, potentially triggering price gaps and sudden, substantial slippage; stop-loss orders may not execute at the intended levels.
2. Market Interconnectivity: The ASX 200 is simultaneously influenced by overnight US stock market movements, commodities (iron ore, copper, gold), and the AUD exchange rate; given the high weighting of resource stocks, volatility transmits rapidly across the index.
3. Sector Divergence Risk: Utilities and energy sectors are experiencing high volatility today; while the index itself shows only minor fluctuations, volatility within specific sectors and individual stocks may far exceed that of the broader index.
4. Liquidity Risk: Liquidity tightens instantly upon data release, causing spreads to widen and increasing the risk of slippage for short-term trades.
Hong Kong Hang Seng Index
Market Overview:
The Hang Seng Index fell 0.9% (or 215 points) to 24,873 on Wednesday, reversing the previous session's modest gains as investors took profits on tech stocks and adopted a cautious stance ahead of the anticipated meeting between Chinese President Xi Jinping and US President Donald Trump. This decline followed three consecutive days of gains, a rally previously led by the technology sector. Investors are closely watching the talks for signals regarding trade, semiconductors, artificial intelligence (AI), and supply chains—with AI emerging as a key arena of strategic competition between the world's two largest economies.
Meanwhile, Brent crude oil dropped below $100 per barrel, easing recent inflation concerns. Financial, technology service, and retail stocks led the decline; notable laggards included Tencent (-1.1%), AIA (-1.3%), Xiaomi (-1.0%), and Shanghai Iluvata (-5.2%). Alibaba also remained in focus following the disclosure of voting results from its September 23 shareholders' meeting.
Sector Performance:
Top Gainers: Mainland real estate and property stocks strengthened against the broader market trend, while the PCB (printed circuit board) and copper-clad laminate sector rallied independently, serving as one of the few "safe havens" attracting capital.
Top Decliners: The Hang Seng Tech Index fell 1.33%; major internet stocks—including Alibaba, Xiaomi, and Tencent—experienced a collective pullback. AI application stocks saw a sharp sell-off, while non-ferrous metal and gold stocks also weakened. Technical Analysis:
On Wednesday, the Hang Seng Index (HSI) closed at 24,834.12 points (-1.01%), having traded between a high of 25,072 and a low of 2,4811; it closed below the key 25,000 mark. Candlestick structure: A solid bearish candle formed; the index faced immediate selling pressure after an initial attempt to rise, failed to sustain multiple intraday rebounds, and closed near the day's low. Short-term moving averages have turned downward to act as resistance, with the 25,000 level shifting from prior support to short-term resistance. Volume: Total daily turnover reached HK$184.3 billion; the decline accompanied by increased volume indicates profit-taking, with heavyweight internet/tech stocks acting as the primary drag. Summary of technical signals: The index met resistance at the 25,000 mark, and bullish momentum has waned, shifting the short-term outlook from "oscillating with a bullish bias" to "oscillating with a bearish bias." However, the structure of the rebound from the lows remains intact; this appears to be a phase of retesting support rather than the start of a one-way crash.
Forecast for Thursday's technical trend: The index is expected to show a weak, oscillating trend; avoid chasing highs in pure internet/tech stocks. Structural opportunities lie in playing independent themes driven by policy or fundamentals—such as the real estate supply chain and PCB sectors—rather than making heavy bets on a single sector. Scenario analysis—Optimistic scenario (low probability): Overnight US stocks and Treasury yields stabilize, and expectations regarding mainland real estate policies continue to build; the HSI opens with a rebound, reclaiming the 24,900 level and challenging 25,000. Neutral scenario (baseline expectation): Range-bound oscillation continues, with the index fluctuating between 24,600 and 24,900. Internet/tech stocks remain under pressure as capital clusters in defensive themes like real estate and PCBs; the index repeatedly tests the 24,600 support level. Pessimistic scenario: External risk appetite declines, internet/tech stocks suffer further sell-offs, and the index breaks below 24,600 to close beneath it, subsequently testing levels near 24,300. Trading Strategy:
Operational Strategy (Short-term perspective; suitable for Hang Seng Index / HSI futures traders)
Hong Kong stocks and HSI futures are highly volatile; leveraged trading amplifies both profits and losses, so strict position management is essential.
1. Long Positions
• If a rebound reaches the 24,900–25,000 resistance zone but fails to break through, consider reducing positions to lock in profits;
• Defensive stop-loss: 24,600. If the price closes below this level, exit long positions to avoid being trapped in a deep loss.
2. Short Positions
• If a rebound faces resistance in the 24,900–25,000 range and fails to hold, consider opening a light short position;
• Place stop-loss above 25,120; initial target is 24,600, with a secondary target of 24,300 if the price breaks lower.
Key Risk Warnings:
1. External Macro Risks: Fluctuations in US Treasury yields and the US Dollar Index, as well as overnight movements in US tech stocks, directly impact the opening of Hong Kong stocks; changes in expectations regarding Federal Reserve policy represent the most significant external variable.
2. Sector Weighting Risks: The Hang Seng Index is heavily weighted toward internet stocks; a sharp decline in a single large-cap internet stock can rapidly drag down the entire index.
3. News-Driven Volatility: Rumors regarding real estate policies, mainland economic data, and geopolitical news can trigger sudden intraday spikes or drops; Hong Kong stocks have no daily price limits, meaning short-term pullbacks can be substantial.
4. Liquidity Risks: Sustained foreign capital outflows would limit the extent
Disclaimer: The information contained herein (1) is proprietary to BCR and/or its content providers; (2) may not be copied or distributed; (3) is not warranted to be accurate, complete or timely; and, (4) does not constitute advice or a recommendation by BCR or its content providers in respect of the investment in financial instruments. Neither BCR or its content providers are responsible for any damages or losses arising from any use of this information. Past performance is no guarantee of future results.
More Coverage








2026 © - All Rights Reserved by BCR Co Pty Ltd
Risk Disclosure:Derivatives are traded over-the-counter on margin, which means they carry a high level of risk and there is a possibility you could lose all of your investment. These products are not suitable for all investors. Please ensure you fully understand the risks and carefully consider your financial situation and trading experience before trading. Seek independent financial advice if necessary before opening an account with BCR.
BCR Co Pty Ltd (Company No. 1975046) is a company incorporated under the laws of the British Virgin Islands, with its registered office at Trident Chambers, Wickham’s Cay 1, Road Town, Tortola, British Virgin Islands, and is licensed and regulated by the British Virgin Islands Financial Services Commission under License No. SIBA/L/19/1122.
Open Bridge Limited (Company No. 16701394) is a company incorporated under the Companies Act 2006 and registered in England and Wales, with its registered address at Kemp House, 160 City Road, London, England, EC1V 2NX. Open Bridge Limited acts solely as a payment processor for BCR Co Pty Ltd and does not provide any financial, trading, or investment services on its behalf. Open Bridge Limited's role is limited to payment processing.


 English
 简体中文
简体中文
 繁體中文
繁體中文
 Bahasa
Melayu
Bahasa
Melayu
 Tiếng
Việt
Tiếng
Việt
 ไทย
ไทย
 日本語
日本語
 한국어
한국어
 ភាសាខ្មែរ
 español