


0
Currency & Commodity Analysis:
US Dollar Index
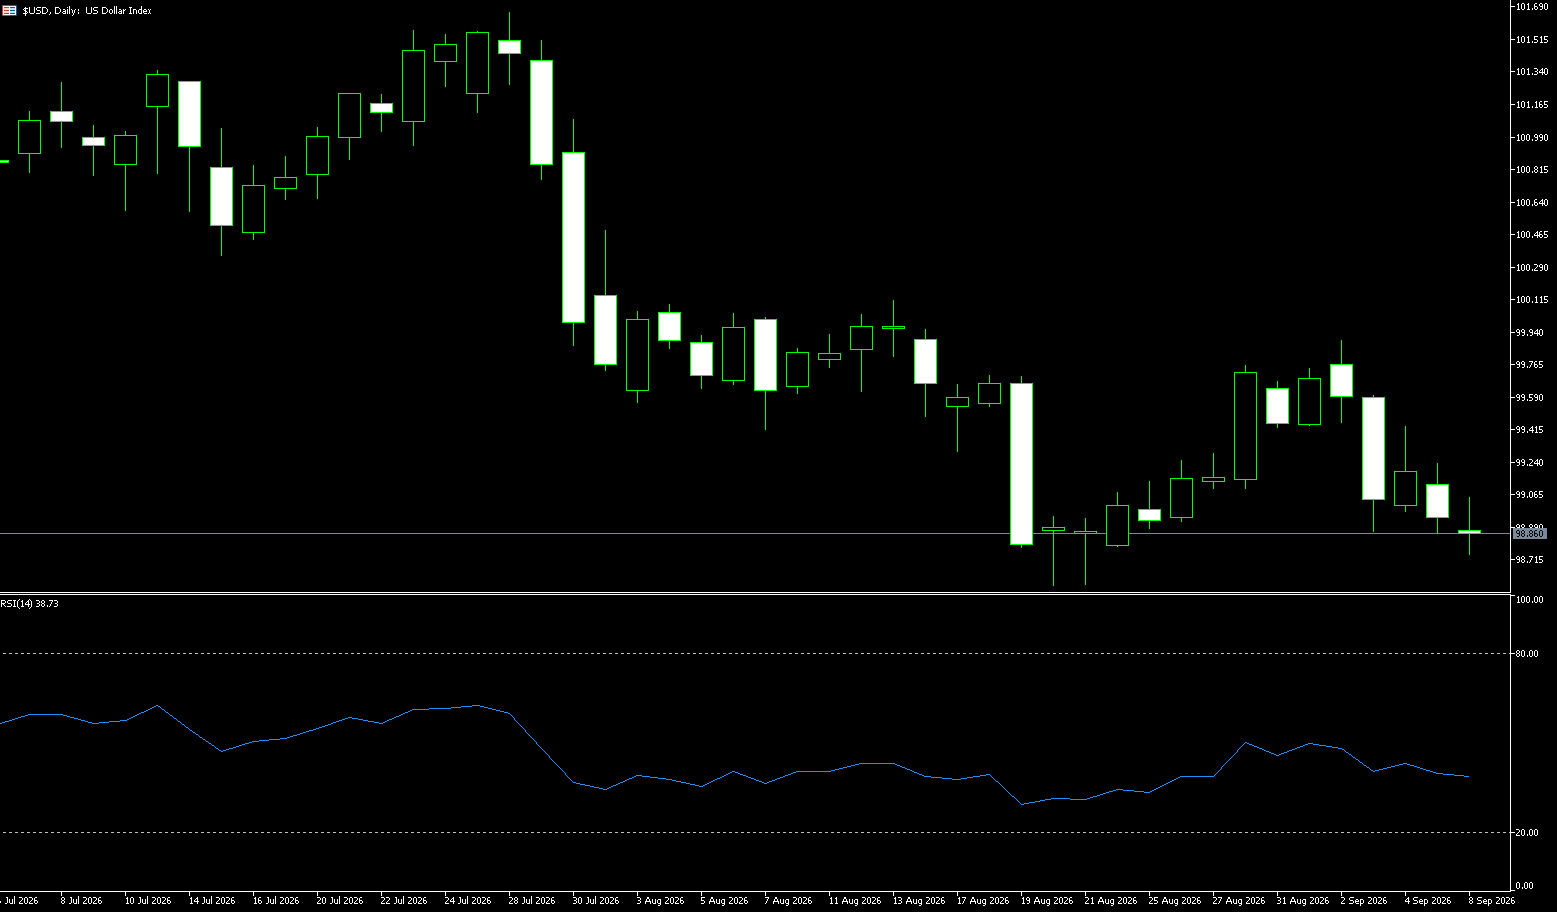
The US Dollar Index faced downward pressure in early trading on Tuesday, currently standing at 98.80. Following strong Non-Farm Payroll data, the market is awaiting the US CPI release on Friday, which will determine whether the Federal Reserve raises interest rates in September. Traders currently estimate a roughly 60% probability of a rate hike; strong CPI data would likely lock in a hike and support the dollar, whereas moderate data could weaken the dollar due to a shift toward dovish pricing. The US Dollar Index, which measures the dollar's value against a basket of six major currencies, extended its decline on Tuesday as a sharp rebound in the Japanese yen overshadowed support stemming from heightened geopolitical tensions and Fed rate-hike expectations. A clear divergence between public statements from political circles and the Federal Reserve's policy stance has further complicated market assessments of the policy outlook and, to some extent, dampened the US dollar's upward momentum. Meanwhile, the USD/JPY pair retreated partly due to the Norwegian Government Pension Fund's plan to adjust its asset allocation framework, involving a $17 billion purchase of Japanese bonds. This reallocation reduces the weighting of US bonds while increasing that of Japanese bonds; the resulting large-scale capital rebalancing has provided significant buying support for the yen, directly pressuring the USD/JPY exchange rate.
The daily chart shows the US Dollar Index spot rate trading just below 99. The short-term tone remains bearish, as the index stays below the cluster of the 50-day, 100-day, and 200-day simple moving averages (all near 100.22) and below the key rising trend line (now around 100.15) that previously provided support. Additionally, a descending trend line extending from 101.80 caps broader rebound attempts near 101.26. The 14-day Relative Strength Index (RSI) is around 42—below the midline—suggesting persistent downward pressure rather than an imminent bullish reversal. On the upside, initial resistance lies near 99.70 (100-day moving average), followed by the psychological level at 100.00. On the downside, the first support level to watch is the secondary rising trend line near 98.72; a break below this would expose lower levels down to 98.56 (last month's low) and reinforce the current bearish bias.
Consider shorting the US Dollar Index today at 98.96; Stop Loss: 99.10; Targets: 98.60, 98.50.
WTI Spot Crude Oil
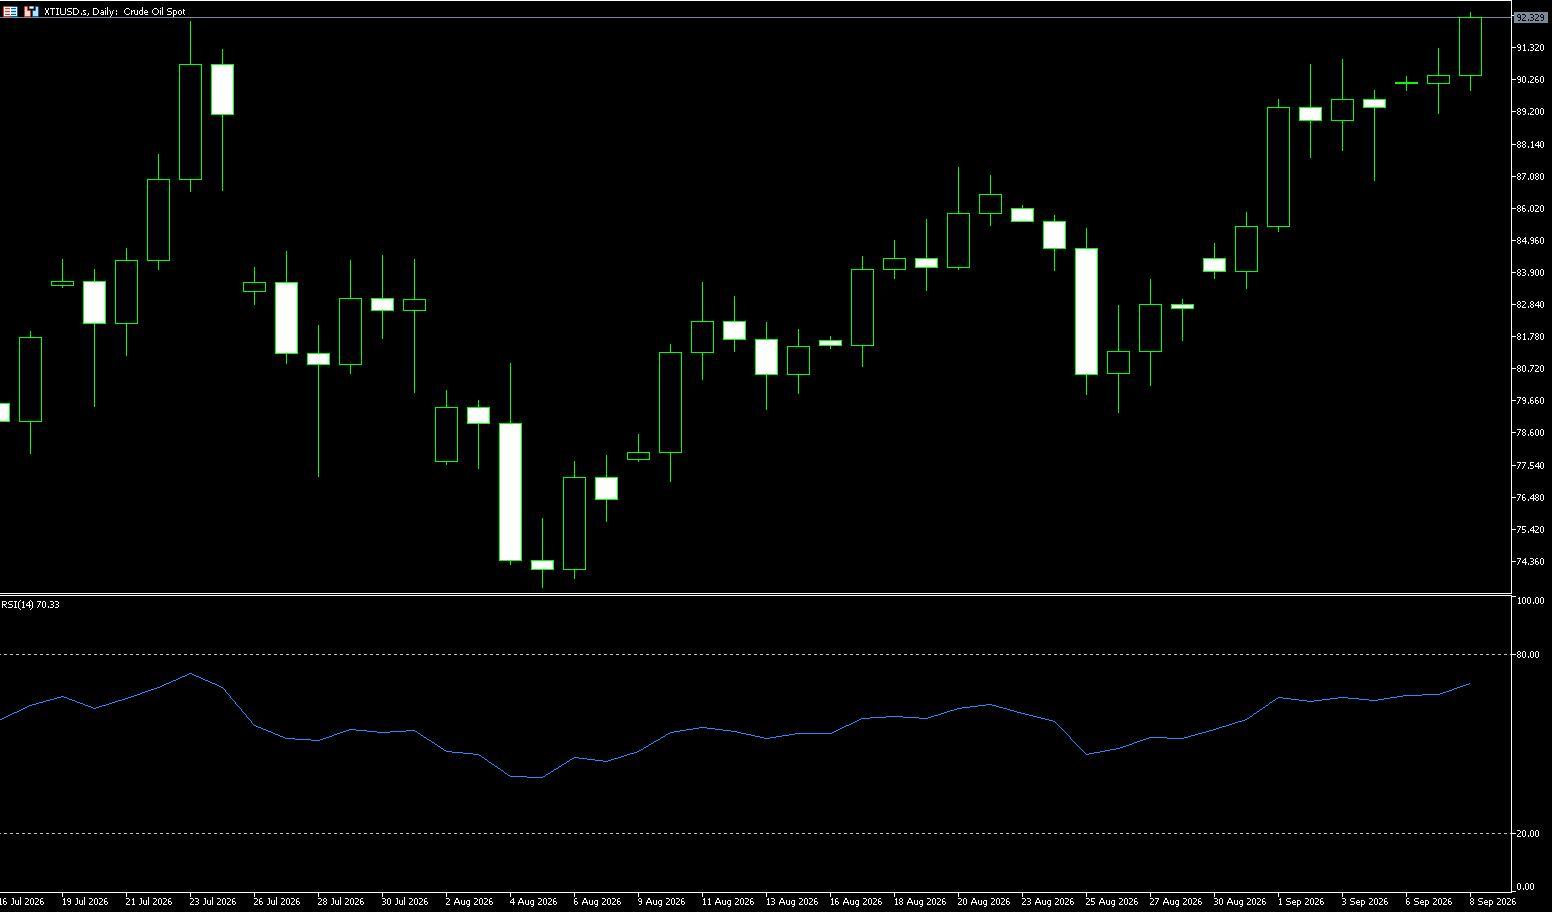
WTI crude oil broke above $92 per barrel on Tuesday, trading near six-week highs amid mounting concerns over supply disruptions. Tensions in the Middle East escalated following mutual attacks between the US and Iran over the weekend. Saudi Aramco facilities faced a fresh round of attacks on Monday; the Iran-backed Houthi rebels claimed responsibility for strikes on the Jazan refinery—which processes 400,000 barrels per day—and other facilities serving the domestic market. The US military struck three Iranian tankers on Saturday after Iran fired ballistic missiles at two naval vessels. Further fueling bullish sentiment, Iran announced on Monday plans to establish a new shipping corridor with Oman in the Strait of Hormuz, a move that could complicate tanker traffic through this critical oil chokepoint. Vessels would need to coordinate with Tehran to enter the newly restricted waters surrounding the waterway.
At this stage, the US and Iran remain locked in a protracted, draining standoff. Crude oil prices are expected to continue fluctuating between pressure from US public opinion and geopolitical catalysts from Iran, with a geopolitical risk premium remaining embedded in the oil pricing structure for the long term. Technical Analysis: Following the recent sustained rise in international oil prices, participation from both institutional and retail investors has surged. Overall volatility has widened over the past four trading sessions, reflecting growing divergence among market participants; the wide fluctuations following the rally suggest a potential correction. On the upside, key levels to watch include support at the $93.00 round-number mark and resistance at $94.86 (the June 3rd high). On the downside, the initial level to monitor is $87.74 (the 9-day simple moving average); a break below this would target the $87.00 round-number level.
Consider going long on crude oil today at $92.10; stop-loss: $92.00; targets: $93.50, $94.00.
Spot Gold
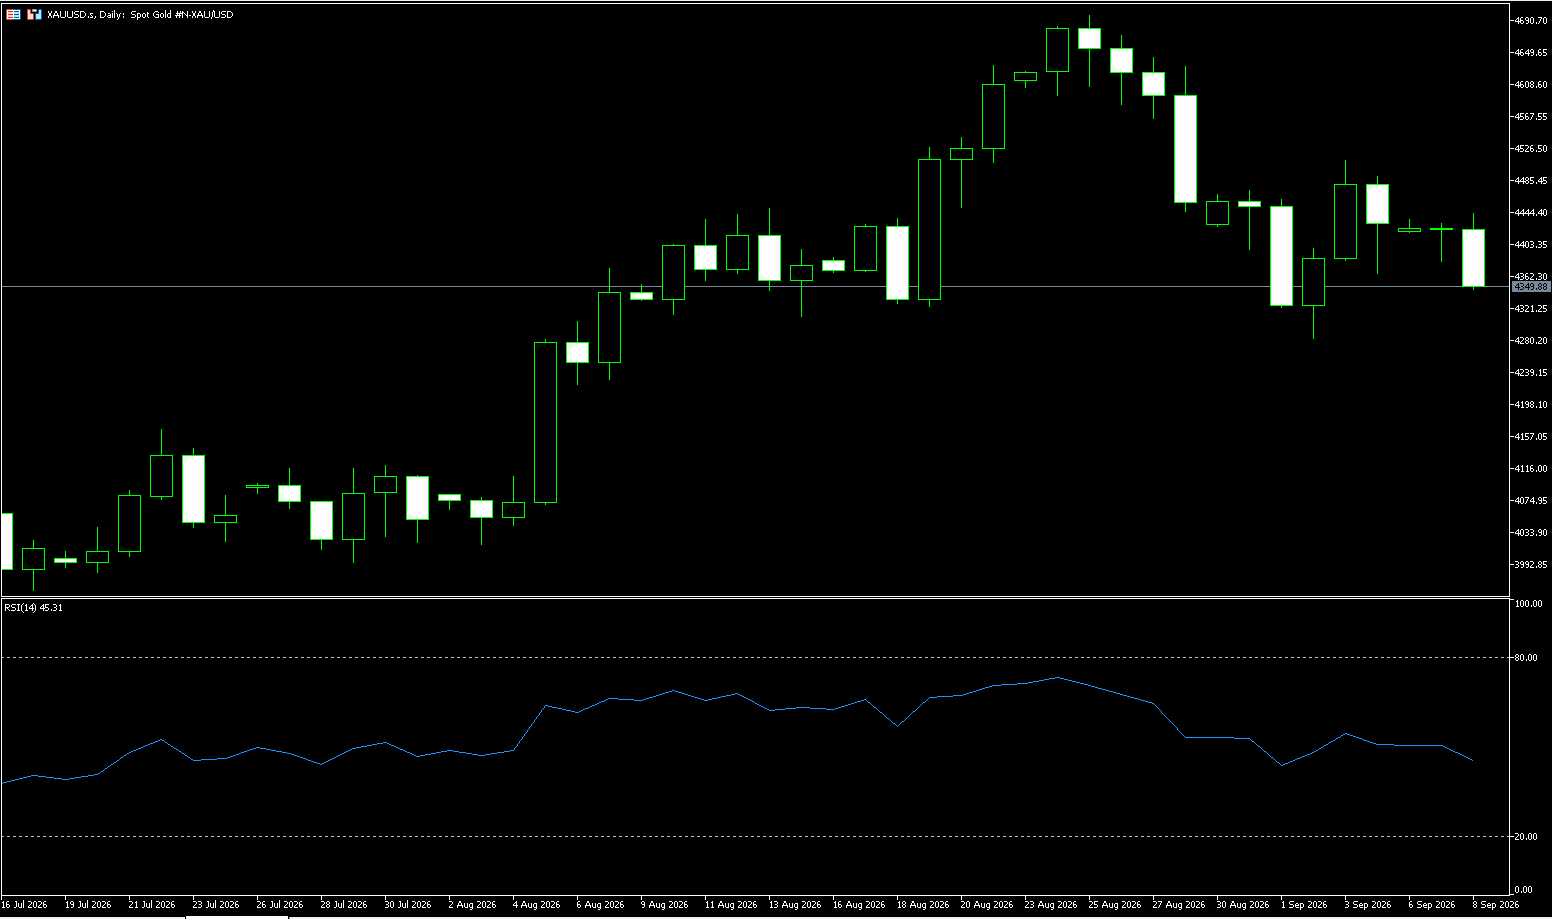
On Tuesday, gold traded cautiously near $4,360 per ounce, influenced by rising bets on Federal Reserve rate hikes and a weakening US dollar, as the market adopted a wait-and-see approach ahead of key US inflation data due later this week. Further gains in oil prices have also reignited inflation concerns. Oil prices extended their rally to multi-week highs amid escalating Middle East tensions following attacks on Saudi Arabian energy facilities and cities by the Iran-backed Houthi group in Yemen. Meanwhile, a stronger-than-expected jobs report released on Friday—indicating a strengthening labor market—prompted traders to price in a roughly 60% probability of a Fed rate hike at the September meeting. Although gold is traditionally viewed as a hedge against inflation, higher interest rates tend to weigh on the appeal of this non-yielding asset. Investors are now awaiting Producer Price Index (PPI) data on Thursday and Consumer Price Index (CPI) data on Friday for further clues regarding the outlook for Fed policy.
Overall, the gold market is currently at a sensitive juncture shaped by a confluence of factors. On the daily chart, the price maintains a bullish short-term bias, trading above the 100-day simple moving average at $4,347. Momentum remains constructive; the Relative Strength Index (RSI) stands at 52, holding in positive territory, while the MACD histogram remains above zero—suggesting that buyers retain control despite signs of easing upward momentum. On the upside, initial resistance lies at the 20-day Simple Moving Average (SMA) of $4,470, followed by the $4,500 mark. On the downside, immediate support is found at the $4,300 level, followed by the 100-day moving average at $4,347.
Consider going long on gold today at $4,347; stop-loss at $4,340; targets at $4,390 and $4,400.
AUD/USD
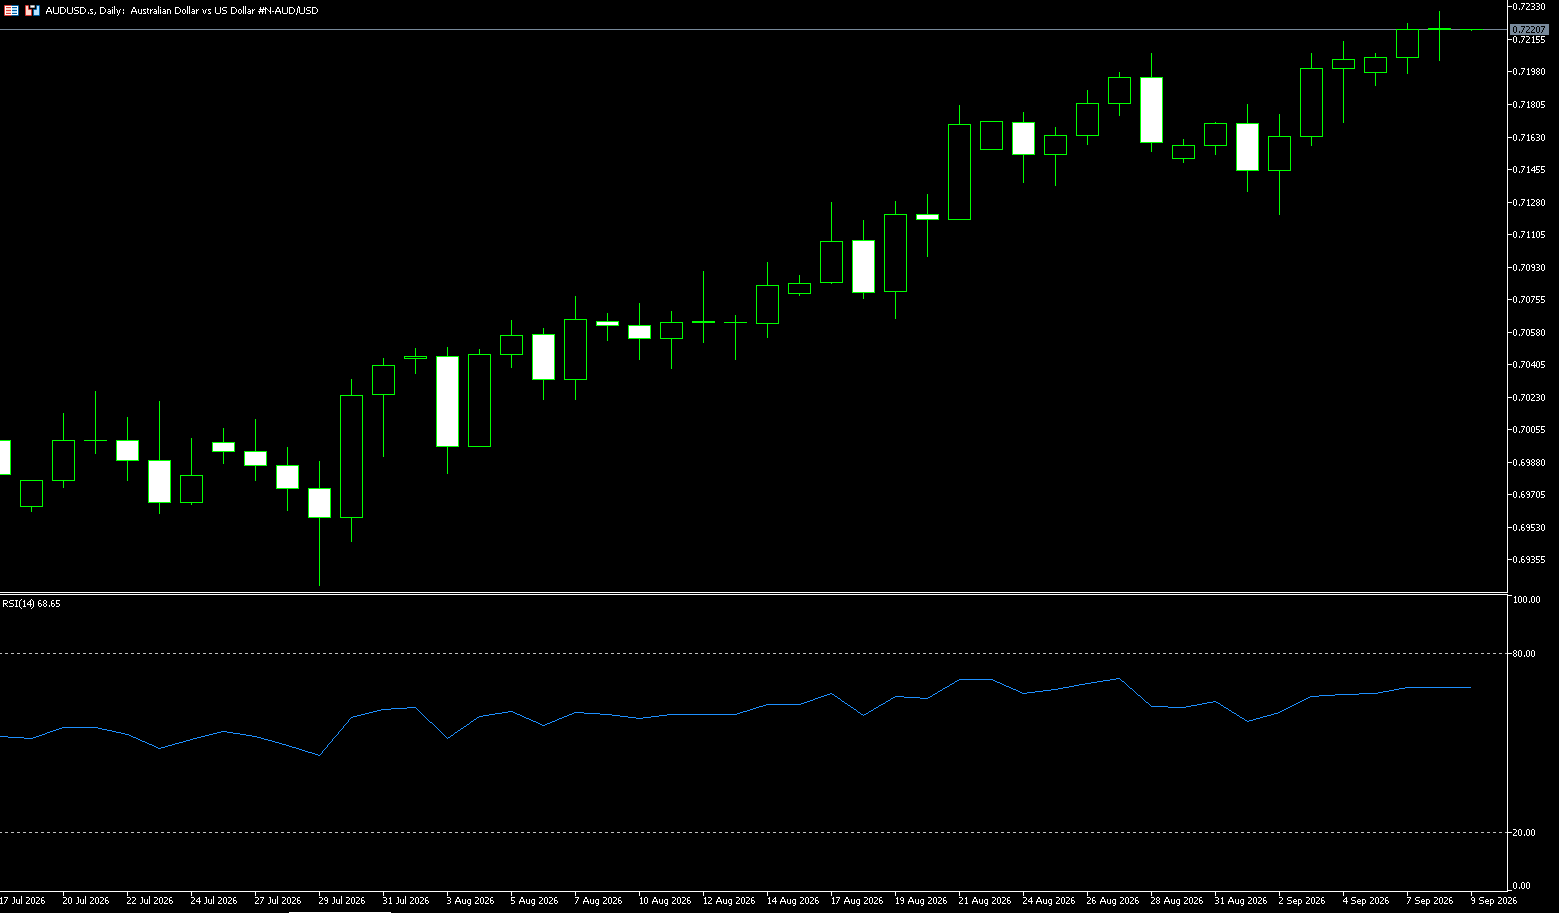
The Australian dollar is hovering above $0.72, near multi-month highs, as increasingly hawkish signals from the Reserve Bank of Australia boost expectations for another rate hike this month. RBA Assistant Governor Sarah Hunter stated that the Board has little tolerance for inflation remaining above target for an extended period and that further rate hikes might be necessary if price pressures exceed expectations. Markets currently price in a roughly 69% probability of a 25-basis-point rate hike to 4.60% at the September 29 meeting—a sharp rise from less than 10% a month ago—while a November hike is fully priced in. The currency has also benefited from broad US dollar weakness and extended its gains against the euro, which fell to a near two-year low. However, domestic headwinds have capped further gains; NAB business conditions dropped to a six-year low in August, and consumer confidence fell sharply in September due to concerns over higher borrowing costs, fuel prices, and a weak housing market.
On the daily chart, AUD/USD is trading at 0.7218. With the exchange rate extending above the 14-day simple moving average (SMA) at 0.7174—which has now become support for the current rally—the pair maintains a clear bullish bias. The 14-day Relative Strength Index (RSI) stands around 68, nearing overbought territory, while the Average Directional Index (ADX) is around 23; this indicates a trend that is maturing yet moderate, suggesting upside momentum remains but may be susceptible to consolidation. To the upside, initial resistance lies at 0.7264 (May 14 high), followed closely by the 0.7300 level (a psychological resistance barrier). A sustained break above this zone would pave the way for a test of the next key resistance level near 0.7400. To the downside, initial support is found around the 14-day SMA (0.7174) and the 0.7158 level (September 3 low), reinforced by support at the 0.7100 mark; a drop below this would call the broader bullish structure into question.
Consider going long on the AUD at 0.7210 today; stop-loss: 0.7200; targets: 0.7260, 0.7250.
GBP/USD
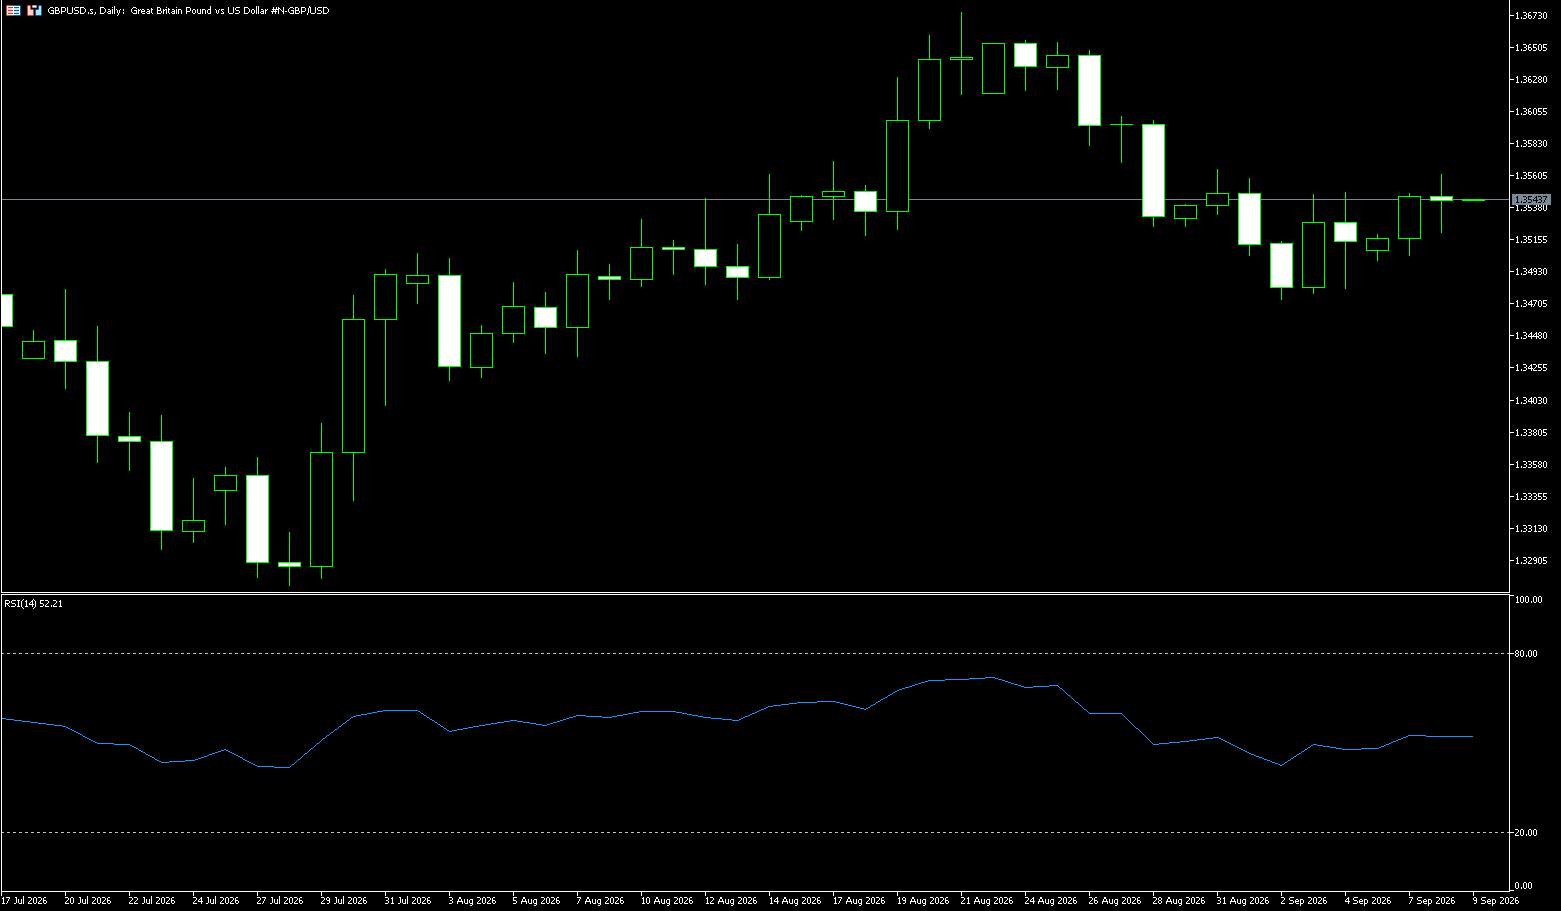
GBP/USD climbed towards 1.3545 during Tuesday's Asian trading session. The pair edged higher after UK Chancellor John Healey announced a series of measures aimed at boosting economic growth and attracting more private investment into the UK. According to the BBC, Healey pledged to cut regulatory barriers to investment and create new freedoms for testing emerging technologies. He also emphasized his commitment to fiscal discipline and curbing rising costs for businesses and the public, including a target to cut regulatory costs by 25% before the next general election in 2029. This first major speech by Healey ahead of the upcoming October budget provided some support for GBP/USD. Meanwhile, a stronger-than-expected US employment report for August pushed the probability of a Federal Reserve rate hike above 60%. Market attention will now shift to US Producer Price Index (PPI) and Consumer Price Index (CPI) inflation data due later this week.
On the daily chart, GBP/USD remains above the lower Bollinger Band (1.3455) and the 34-day moving average (1.3500); although the price has just dipped below the 20-day simple moving average (1.3558), the short-term bias remains slightly bullish. The 14-day Relative Strength Index (RSI) is hovering near 53—close to neutral territory—suggesting a consolidation phase rather than an overextended move, as the spot price lingers between potential trend support and the upper limit of the recent trading range. On the downside, initial support lies at the 34-day moving average (1.3500), reinforcing this demand zone; a daily close below this level would undermine the constructive bias and open the door for a deeper pullback towards the lower Bollinger Band at 1.3455. On the upside, the 20-day simple moving average (SMA) near 1.3558 poses the next hurdle; a break above this level would signal renewed upward momentum, targeting the recent high of 1.3675.
Consider going long on GBP at 1.3530 today; stop-loss: 1.3520; targets: 1.3570, 1.3580.
USD/JPY
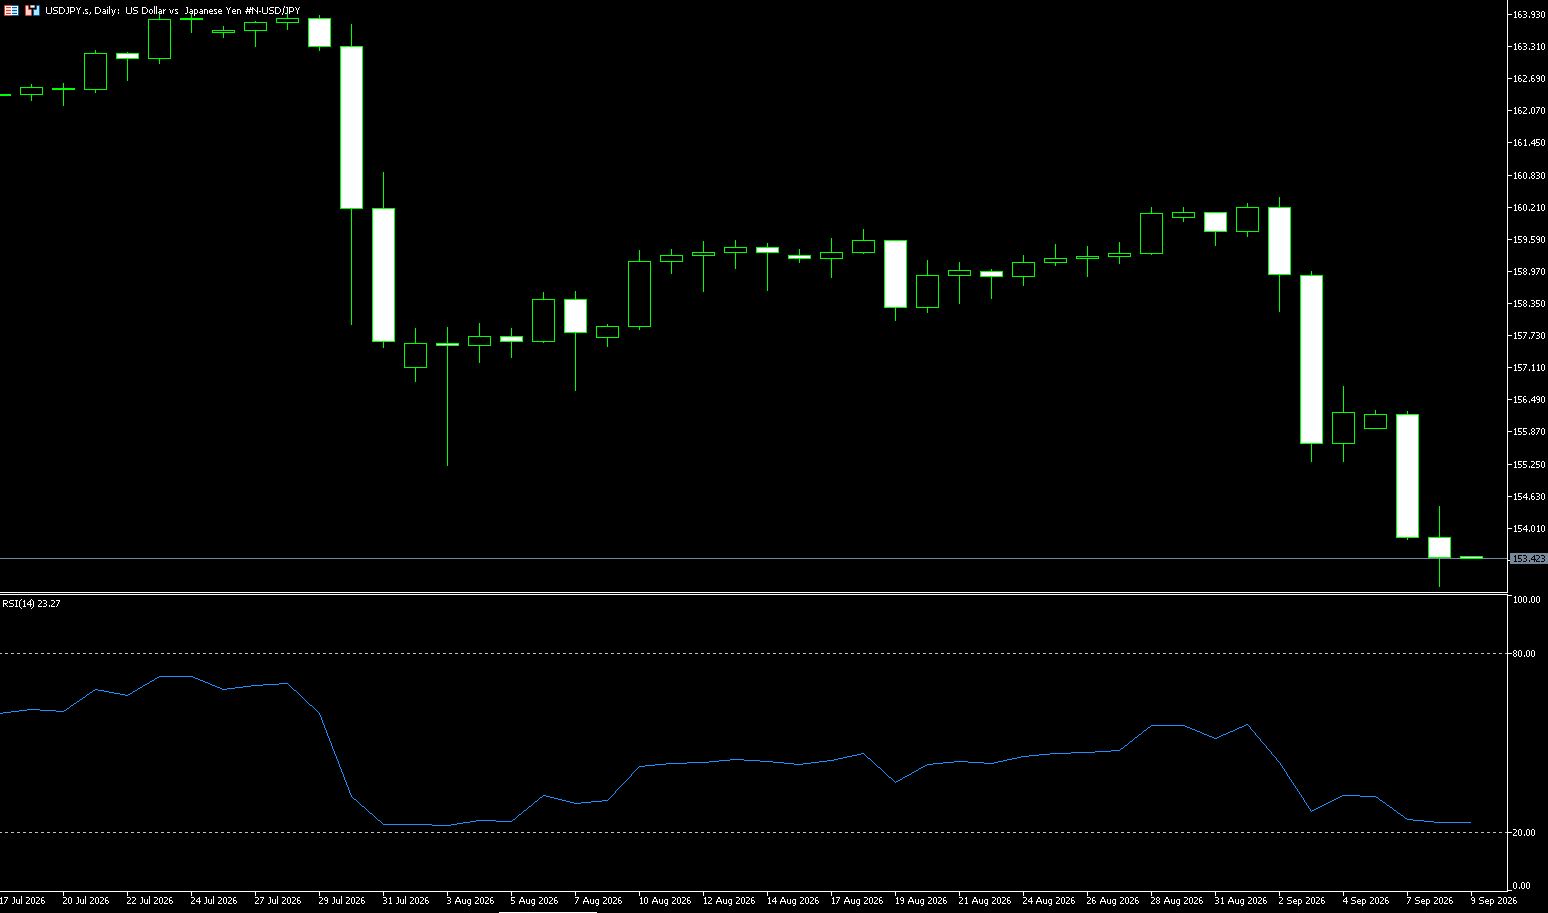
The USD/JPY pair fell for the second consecutive session—marking its fourth decline in five days—and dropped to its lowest level since February 18, around 153.40, during Tuesday's Asian session. Optimistic data from Japan reinforced bets on a hawkish stance by the Bank of Japan (BoJ) and boosted the yen, placing heavy pressure on the pair amidst a generally weaker US dollar. Additionally, revised data from the Cabinet Office showed Japan's economy grew at an annualized rate of 1.4% in the April-June quarter, an upward revision from the initial 1.1% estimate. This bolsters the case for the BoJ to raise interest rates next week and continue tightening policy thereafter. Traders appear to have fully priced in a 25-basis-point rate hike at the BoJ's September 17–18 meeting. Furthermore, the market sees a risk of a larger hike to anchor rising inflation expectations, curb long-end yields, and ultimately support the yen. Speculation regarding potential renewed intervention in the currency market by Japanese authorities is also providing support to the yen. On the other hand, the US dollar continues to face follow-through selling despite hawkish expectations for the Federal Reserve, keeping USD/JPY under pressure and favoring the bears.
USD/JPY has broken below the 155.30–155.20 support zone, maintaining a bearish short-term bias and supporting the view that the recent pullback from multi-decade highs will continue. With market sentiment shifting away from yen weakness, any attempted rallies are likely to be viewed as selling opportunities and remain capped near the aforementioned broken support level. On the daily chart, the pair has dropped to a low of 153.40—its weakest level since February 18—maintaining a short-term bearish outlook as the spot price remains below the lower Bollinger Band at 154.75. Upside attempts are expected to be limited given the weak momentum, while the 14-day Relative Strength Index (RSI) hovers near 25, indicating weak demand and oversold conditions. On the upside, immediate resistance lies at the lower Bollinger Band (154.75), followed by the 5-day moving average (155.73)—the first hurdle for any attempted rebound. On the downside, key levels include the psychological mark of 153.00 and the February 8 low of 153.07; a break below this area could open the way for a further decline toward the 152.00 round-number level.
Consider shorting the USD at 154.18 today; stop-loss: 154.35; targets: 153.50, 153.60.
EUR/USD
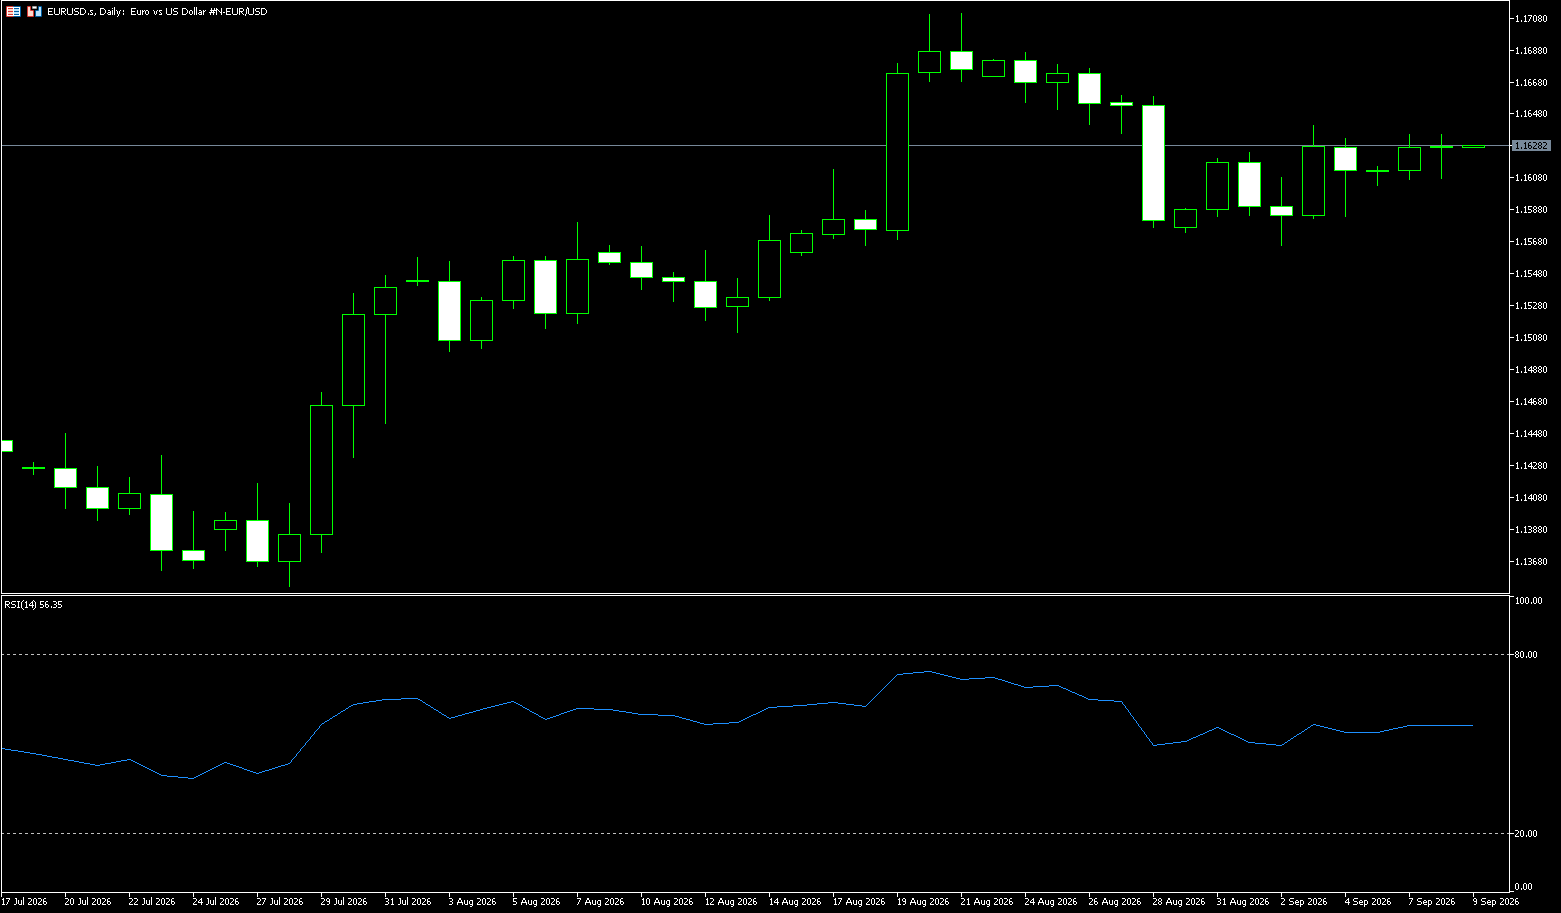
During early Asian trading on Tuesday, EUR/USD edged higher, hovering near 1.1630. The pair strengthened on market expectations of an interest rate hike by the European Central Bank (ECB). Traders are awaiting the release of US Producer Price Index (PPI) and Consumer Price Index (CPI) inflation data later this week. The ECB implemented its first rate hike since 2023 at its June meeting to curb soaring prices but held steady at its July meeting to monitor the evolution of the conflict. The ECB is scheduled to raise benchmark interest rates for the second time this year at Thursday's policy meeting. Across the Atlantic, a stronger-than-expected US employment report—showing 162,000 jobs added in August—pushed the probability of a Federal Reserve rate hike above 60%. Additionally, persistent tensions in the Middle East, including tit-for-tat incidents involving US and Iranian vessels in the Strait of Hormuz, could drive capital flows into safe-haven assets like the US dollar.
On the daily chart, EUR/USD maintains a mildly bullish bias, as the spot price remains above the Bollinger Band midline (1.1616) and firmly above the 20-day simple moving average (1.1602). This pattern suggests the broader uptrend remains supported, while the Relative Strength Index (RSI) near 58 indicates constructive bullish momentum that is not yet overextended. On the upside, initial resistance lies at the August high of 1.1679, followed by the August 21 high of 1.1711 and the 1.1700 psychological level; a breakout above this zone would pave the way for a stronger extension of the rally. On the downside, initial support is provided by the 34-day simple moving average (SMA) near 1.1562, while a deeper pullback would encounter the lower Bollinger Band near 1.1523.
Consider going long on the EUR at 1.1610 today; Stop Loss: 1.1600; Targets: 1.1670, 1.1660.
Stock Analysis:
Australia ASX 200 Index
Market Overview:
The ASX 200 index fell 90 points (1.0%) to close at 8,921 on Tuesday—a six-week low—driven by weakness across the retail, financial, and technology sectors. Market sentiment deteriorated as Dow Jones futures declined amidst surging oil prices and escalating trade tensions between the US and Canada. Reserve Bank of Australia Assistant Governor Sarah Hunter warned that the cash rate might need to rise further to curb stubborn inflation. Meanwhile, recent data showed Australian business sentiment dropping to a three-month low in August, while business conditions slumped to a six-year low due to weak sales, profitability, and employment. Losses were partially mitigated by strong trade flows with key partner China in August, occurring just ahead of the meeting between President Xi Jinping and President Trump in Washington.
Commonwealth Bank fell 2.2% after signaling a slowdown in mortgage growth last month, while the other three major banks saw declines ranging from 1.7% to 3.2%. REA Group dropped 2.9%, and Wesfarmers fell 2.5%. Energy stocks bucked the trend, with Santos rising 1.1%.
Sector Performance:
Sector rotation this week
Sector divergence (Monday's market)
Top gainers: Energy (+1.78%, driven by gains in coal and crude oil), Materials (iron ore holding above $100), Industrials, and Financials (slight gains).
Top losers: Utilities, Healthcare, Consumer Staples, and Communication Services weakened. Market divergence was evident, and the broad-based rally has faded.
Advancers vs. Decliners: Decliners outnumbered advancers; the index was propped up by heavyweight resource stocks, resulting in limited profit-making opportunities.
Technical Analysis:
Outlook for Wednesday: Avoid initiating new positions during the narrow 8900–9000 trading range; wait for a decisive breakout or breakdown before following the trend to avoid the risk of false breakouts associated with range-bound trading. Scenario Analysis for Wednesday—Bearish Baseline Scenario (Higher Probability): Weakness persists at the open, testing the 8900 support level; if 8900 fails to hold, the next target is the 8830–8850 range to look for buying support. Recovery/Rebound Scenario: Price holds above 8900 and rebounds to challenge the 8990–9000 resistance zone; failure to firmly establish above 9000 renders the rebound a short-term selling opportunity. Extreme Strong Recovery: High-volume breakout above 9080, signaling the end of the short-term pullback and a return to an upward oscillation trend; this scenario requires a significant rally in external US stock markets and commodities.
Trading Strategy (Short-term Perspective)
Short-term Trading Strategy (Intraday / 1–2 Trading Days)
Bullish Approach (Defensive "Bottom-fishing" Only): Consider a light long position only if the price pulls back to the 8830–8850 range and shows clear signs of stabilizing (e.g., long lower shadows, high-volume stabilization); set stop-loss below 8800; take profits in stages at the 8950–9000 rebound targets.
Bearish Approach: If the price rebounds to the 8990–9000 zone and faces resistance or stalls, consider a light short position; place stop-loss above 9090; first target is 8900; if it breaks below this, look toward the 8840 area to exit or reduce positions. Key Risk Factors:
1. Overnight movements in US stock markets, US Treasury yields, and commodity prices (such as iron ore and copper) directly impact the resource-heavy sectors of the Australian stock market, often causing price gaps that alter technical chart patterns;
2. Changes in Australian consumer confidence, inflation, and interest rate expectations can significantly affect the banking and consumer sectors;
3. The ASX 200 index has a high concentration of heavyweight stocks; significant price fluctuations in individual large-cap stocks—such as BHP, the "Big Four" banks, or CSL—can drive sharp short-term volatility in the index;
China Shanghai Composite Index
Market Overview:
On Tuesday, the Shanghai Composite Index rose 0.20% to close at 3,940.6 points, while the Shenzhen Component Index fell 0.52% to 13,703.2 points, even as robust trade data highlighted strong external demand. Exports in August grew 25% year-on-year to reach US$401.4 billion, up from 23.9% in July, while imports surged 28.2% to US$282.4 billion, marking the eighth consecutive month of double-digit growth. The trade surplus widened to US$119.1 billion—up from US$101.1 billion in the same period last year—meeting market expectations. This strong trade performance comes as the US intensifies pressure on China to reduce trade imbalances. Tensions between Beijing and Brussels are also escalating; EU leaders increasingly view the trade gap as a strategic concern, with an October deadline approaching.
Energy stocks posted gains, including PetroChina (+2.54%), CNOOC (+3.83%), and Sinopec (+4.10%), while Contemporary Amperex Technology (CATL) (-3.65%), Suzhou Dongshan Precision (-2.17%), and Hangzhou Hikvision Digital Technology (-3.50%) declined. Sector Performance:
Top-gaining sectors: Agriculture, fertilizers & phosphorus chemicals, oil & petrochemicals, real estate, coal, and non-ferrous resources; capital flowed into low-valuation, defensive, and cyclical sectors.
Top-losing sectors: High-flying tech segments such as semiconductors, computing power, CPO, and liquid cooling experienced pullbacks due to profit-taking; the ChiNext Index and STAR 50 Index showed significant weakness.
Technical Analysis:
The Shanghai Composite Index opened at 3935.55 on Tuesday, reached a high of 3951.32 and a low of 3925.72, and closed at 3940.55 (+0.20%). Turnover on the Shanghai exchange was 915.5 billion yuan, with a combined turnover of approximately 1.98 trillion yuan across both exchanges—a slight increase from the previous day, indicating a market driven by the rotation of existing capital. The index fluctuated within a narrow range throughout the day; it faced resistance after rising to 3951 and pulled back, found support near 3926, and ultimately held the 3940 pivot level at the close. More individual stocks rose than fell, highlighting a distinct structural market; the index's upside potential was limited, and sector rotation was rapid. The index is oscillating within a narrow range defined by short-term moving averages, facing resistance around the 3950 level and finding short-term support in the 3920–3930 range, signaling a phase of narrowing volatility while awaiting a directional shift. Volume characteristics: There was a slight increase in volume but no breakout-level surge; capital divergence intensified, and no unified upward trend emerged.
Technical Outlook for Wednesday: Expect narrow-range fluctuations throughout the day; the index may face resistance and pull back after rising toward 3951, find support near 3926, and hold the 3940 pivot level at the close. More individual stocks are likely to rise than fall, with a clear structural market trend; the index's upside potential remains limited, and sector rotation will continue to be rapid. Scenario analysis for Wednesday's market performance—Bullish scenario: After an initial pullback, the index holds the 3920 level; trading volume across both exchanges expands again, pushing the index above 3960 to test the resistance at 3980. Neutral/Oscillation scenario (most likely): The index fluctuates within the 3920–3960 range; rapid sector rotation persists, volatility remains limited, and the trend of structural market performance continues. Bearish scenario: The index breaks below 3920 on high volume and fails to recover; capital continues to flow out of high-flying growth stocks, leading to a retest of the strong support level at 3900.
Trading Strategy:
Operational Strategy (Short-term Perspective)
In a market environment characterized by index oscillation, prioritize buying low-valuation sectors during rotation and avoid chasing stocks that have already surged; if the Shanghai Composite Index breaks through the 3,950 level on high volume, a rebound can be anticipated; if the breakout occurs on low volume, control position sizes and adopt a quick-in, quick-out approach. Two main strategies: defensive positioning in cyclical/resource sectors or betting on a recovery in low-valuation pharmaceutical and consumer stocks; for high-valuation technology stocks, only buy on pullbacks.
Bullish Strategy:
If the index pulls back to stabilize in the 3,920–3,930 range and stops falling on low volume, consider buying into low-valuation sectors undergoing rotation; strictly avoid chasing stocks that gap up or surge sharply. Only increase positions slightly—targeting heavyweight and cyclical stocks—if the index firmly holds above 3,960 on high volume and total market turnover consistently remains at the 2-trillion-yuan level.
Bearish Strategy:
If the index rallies to the 3,950–3,960 range but stalls due to a lack of volume, take profits in stages on high-valuation technology stocks and short-term thematic plays that have already gained value. If the index rallies and then falls back while trading volume shrinks rapidly, reduce overall positions to avoid risks associated with volatility and pullbacks.
Key Risk Warnings:
1. Changes in Federal Reserve inflation data and interest rate cut expectations disrupting global risk appetite.
2. Sustained shrinkage in trading volume; sector rotation occurring too rapidly, lacking sustainability.
3. Risk of intraday sharp drops driven by geopolitical conflicts or volatility in overseas stock markets.
4. Sector predictions may fail; intraday capital flow is the primary signal.
Disclaimer: The information contained herein (1) is proprietary to BCR and/or its content providers; (2) may not be copied or distributed; (3) is not warranted to be accurate, complete or timely; and, (4) does not constitute advice or a recommendation by BCR or its content providers in respect of the investment in financial instruments. Neither BCR or its content providers are responsible for any damages or losses arising from any use of this information. Past performance is no guarantee of future results.
Lebih Liputan






2026 © - All Rights Reserved by BCR Co Pty Ltd
Pendedahan Risiko:Instrumen derivatif diniagakan di luar bursa dengan margin, yang bermakna ia membawa tahap risiko yang tinggi dan terdapat kemungkinan anda boleh kehilangan seluruh pelaburan anda. Produk-produk ini tidak sesuai untuk semua pelabur. Pastikan anda memahami sepenuhnya risiko dan pertimbangkan dengan teliti keadaan kewangan dan pengalaman dagangan anda sebelum berdagang. Cari nasihat kewangan bebas jika perlu sebelum membuka akaun dengan BCR.
BCR Co Pty Ltd (No. Syarikat 1975046) ialah syarikat yang diperbadankan di bawah undang-undang British Virgin Islands, dengan pejabat berdaftar di Trident Chambers, Wickham’s Cay 1, Road Town, Tortola, British Virgin Islands, dan dilesenkan serta dikawal selia oleh Suruhanjaya Perkhidmatan Kewangan British Virgin Islands di bawah Lesen No. SIBA/L/19/1122.
Open Bridge Limited (No. Syarikat 16701394) ialah syarikat yang diperbadankan di bawah Akta Syarikat 2006 dan berdaftar di England dan Wales, dengan alamat berdaftar di Kemp House, 160 City Road, London, England, EC1V 2NX. Open Bridge Limited bertindak semata-mata sebagai pemproses pembayaran untuk BCR Co Pty Ltd dan tidak menyediakan sebarang perkhidmatan kewangan, perdagangan atau pelaburan bagi pihaknya. Peranan Open Bridge Limited adalah terhad kepada pemprosesan pembayaran.


 English
 简体中文
简体中文
 繁體中文
繁體中文
 Bahasa
Melayu
Bahasa
Melayu
 Tiếng
Việt
Tiếng
Việt
 ไทย
ไทย
 日本語
日本語
 한국어
한국어
 ភាសាខ្មែរ
 español