


0
Currency & Commodity Analysis:
US Dollar Index
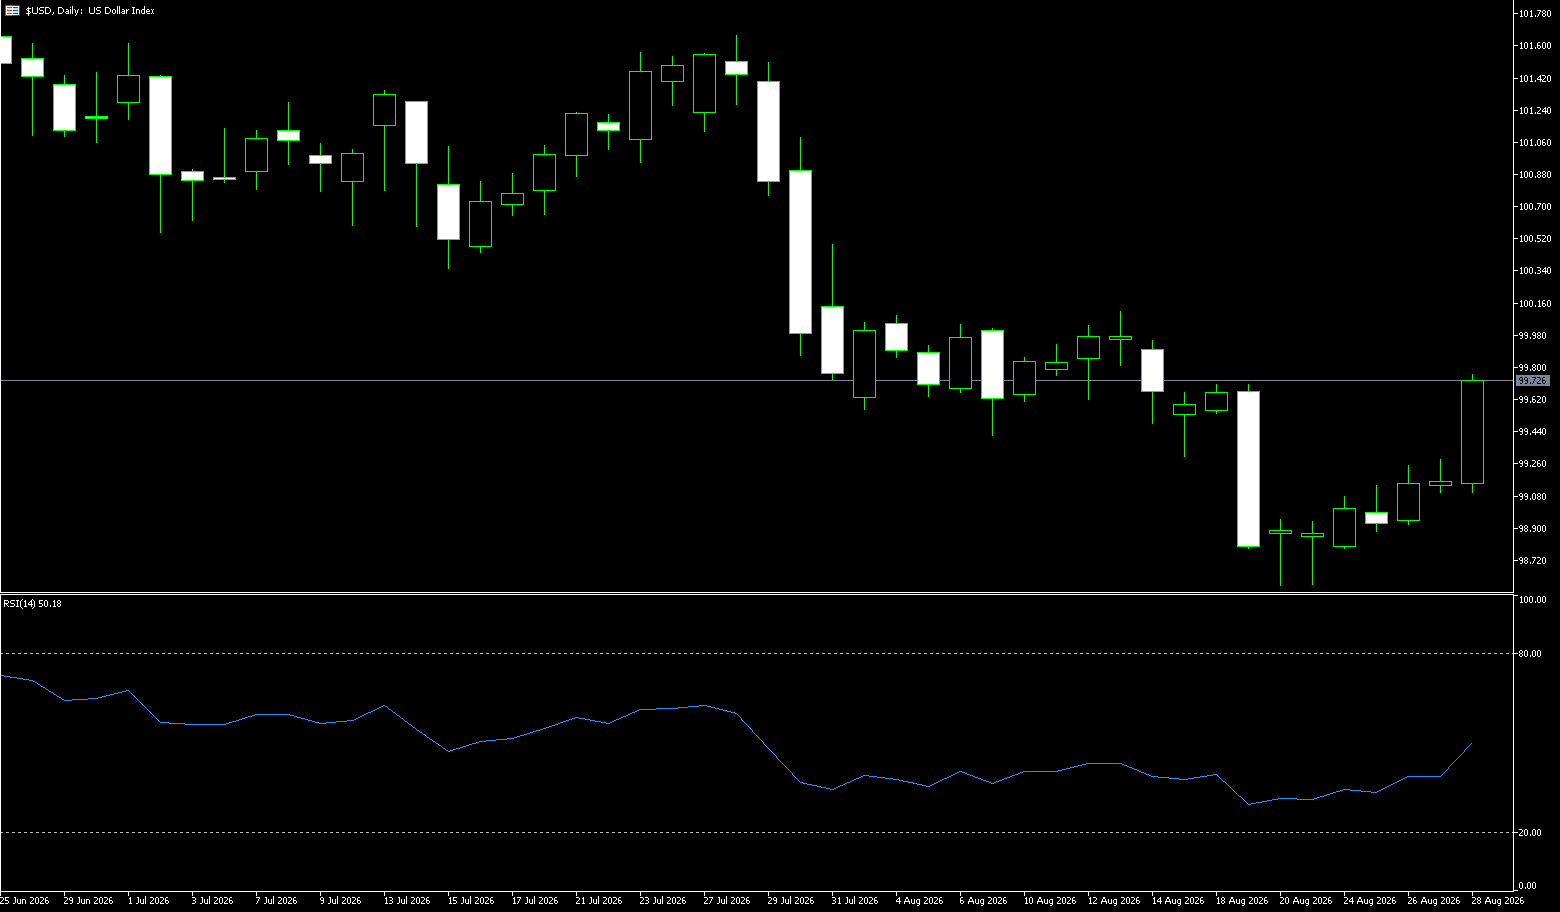
The US dollar has performed positively so far this week, but hawkish comments from Jackson Hole Symposium Chairman Kevin Warsh may lay the foundation for a more sustained rebound. In fact, the US dollar index has stabilized and is expected to end the week with a steady gain, reigniting market expectations that it may soon retest the psychological level of 100.00. Meanwhile, investors appear to have digested last week's volatility in the US bond market. With unusually calm geopolitics and no new verbal intervention from the Japanese Ministry of Finance or the Bank of Japan, the market had virtually no other distractions, and focus returned entirely to US data, particularly Warsh's remarks. And he did not disappoin, at least not for the bulls.
Last week's Fed debate clearly shifted to a hawkish stance, but a unified call for rate hikes has yet to emerge. Hammark has clearly moved into the rate hike camp, Schmid seems increasingly uneasy about the lack of substantial restraints, while Goolsby remains cautious and data-driven. The key question is whether tariffs and energy costs will lead to a short-term rise in overall inflation or begin to spread to inflation expectations and broader pricing behavior. Hammark believes this process may have already begun; Goolsby remains unconvinced. This divergence is likely to shape the debate at the next FOMC meeting.
US July PCE inflation data was higher than expected, briefly pushing up US Treasury yields and driving the dollar to rebound from its lows; however, core PCE met expectations, and weaker consumption limited the dollar's upside potential, failing to establish a sustained upward trend. The US dollar index is currently around 99.00, significantly lower than the level above 101 in late July. On August 19th, the day the US Treasury expanded its long-term debt repurchase program, the dollar index quickly fell from around 99.67 to a low of 98.56. Although it recovered somewhat afterward, it has not yet returned to its previous trading range. This performance indicates that the traditional positive correlation between yields and the dollar is becoming more complex. Looking at the daily chart, after the previous rapid decline, the dollar index formed a temporary low around 98.56, followed by a series of small-bodied candlesticks for recovery, and is currently back around 99.50. The MACD also reflects this characteristic. However, the trend strength indicator has not yet completed its recovery from negative to neutral territory.
Last week was a week of low-level consolidation and recovery after the sharp drop. A bottom was found at 98.75, where buying support emerged, but the bulls lacked the strength to break through, and the downtrend remains unchanged. The overall trend remains bearish, with highs and lows gradually shifting downwards. The RSI is in the 48 range, not yet oversold, indicating some easing of bearish momentum and a potential short-term rebound, but the overall bearish structure has not been reversed. Next week, the key levels to watch are the support at 98.77 (last week's low) and the resistance at 100 (a psychological level). Strong support next week is at 99.36 (the 14-day moving average); a decisive break below this level would target 99.00 (a psychological level). The first resistance levels are 99.70-99.80 (the 100-day moving average and the high of August 13th); strong resistance is at 100.00 (a psychological level). Only a firm hold above 100 would reverse the short-term bearish trend. Next Week's Market Scenario Prediction—Scenario A (Slightly Bullish): A move above 99.50, challenging the 100 level. This requires stronger-than-expected US employment and inflation data, driven by rising US Treasury yields. Only a sustained hold above 100.00 would signal a short-term trend reversal and open up upward potential. Scenario B (Slightly Bearish): A break below 98.75 support. A decisive close below 98.75 confirms the start of a new round of decline, targeting the 98.20-98.40 low range.
Today, consider shorting the US Dollar Index at 99.80, with a stop-loss at 99.90 and targets at 99.40 and 99.30.
WTI Crude Oil
Crude oil prices experienced a "rise, then pullback, then rebound" pattern last week. Oil prices were last quoted above $82.50 a barrel, with traders continuing to focus on developments in the Middle East and efforts to reopen the Strait of Hormuz. Oil exports from the Persian Gulf have recovered to about two-thirds of pre-war levels, and traffic in the Strait of Hormuz has increased. Total crude oil exports from the region rose to 15-16 million barrels per day, still below the pre-war level of 7-8 million barrels per day, but higher than the March low of 5-6 million barrels per day. Iran and Oman have also reached a revenue-sharing agreement on this strategic waterway, although Tehran emphasized that the arrangement does not guarantee an immediate reopening of the strait. Meanwhile, the Trump administration told mediators that it was committed to restoring relations with Iran... The preliminary agreement reached in June fell apart due to a lack of interest in its terms.
Geopolitical tensions escalated again, with US President Trump showing no intention to reinstate the terms of the June memorandum of understanding reached between the US and Iran. This led investors to lower their expectations for a diplomatic breakthrough in the Middle East and increased oil supplies. Following a Wall Street Journal report that President Trump had no intention of reinstating the June memorandum of understanding, investors lowered their expectations for a diplomatic breakthrough in the Middle East and increased oil supplies. Washington subsequently confirmed that it was not currently negotiating with Iran, and Trump also made it clear that he was not seeking contact with Iran. While the Qatari prime minister visited Tehran in an attempt to promote mediation, senior Iranian security officials warned that US "interference" would damage its military and economic interests. Furthermore, Russia's warning of retaliation regarding Ukraine's possible use of British long-range missiles further exacerbated geopolitical tensions, providing support for oil prices.
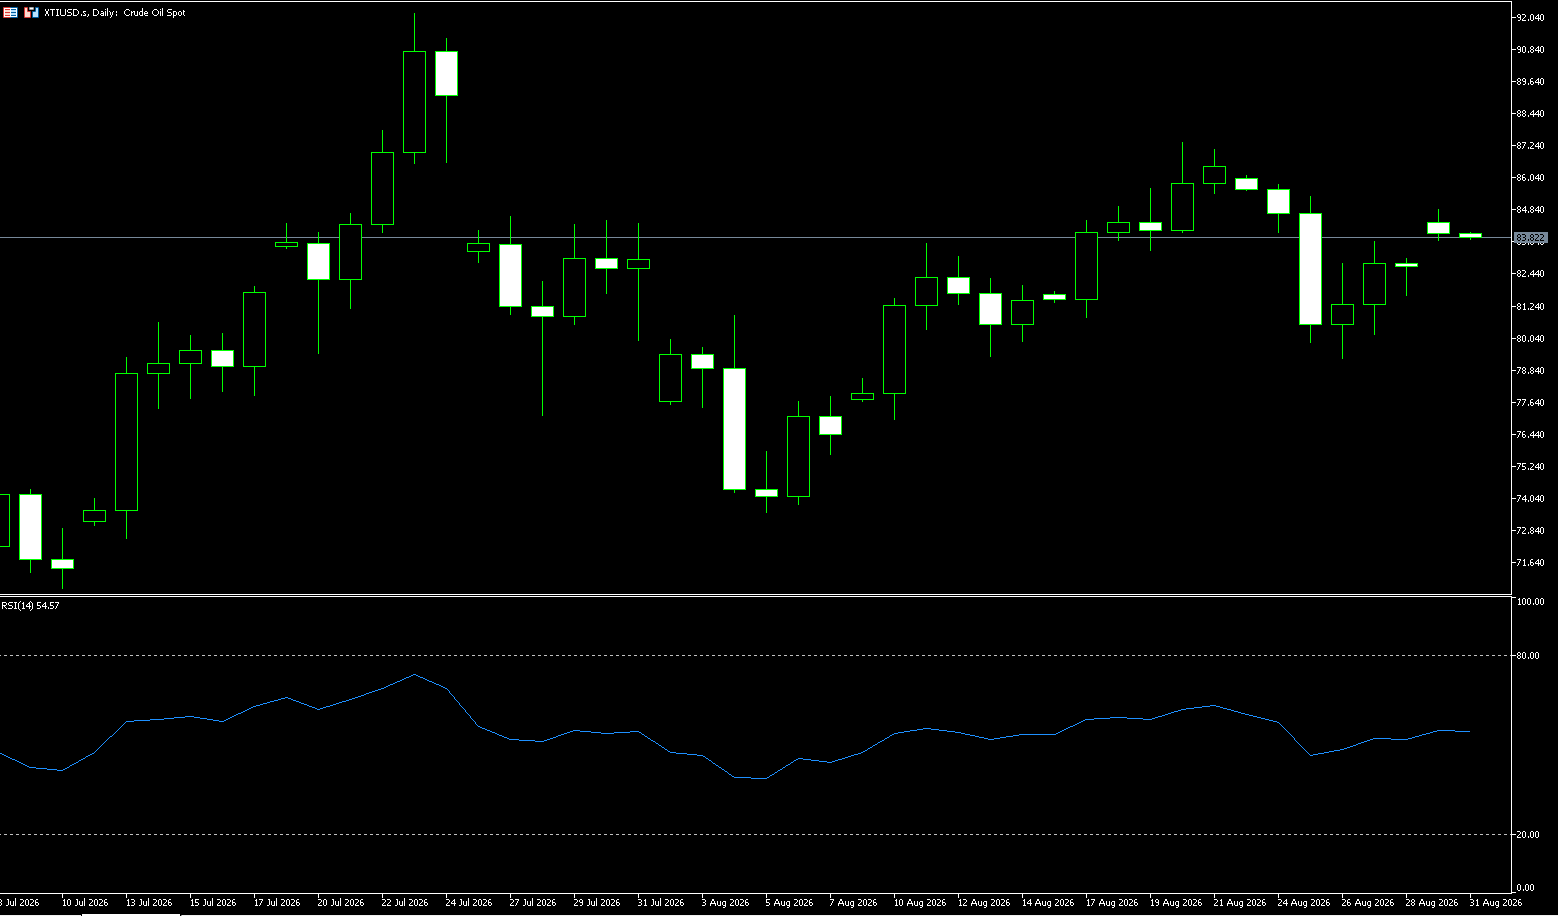
Last week, WTI crude oil prices rose and then fell back. It initially hit a high of $86.15 at the beginning of the week, but then quickly fell back due to expectations of easing geopolitical tensions. The price completed its correction from its highs during the week, closing near $82, entering a range-bound trading pattern and ending its previous one-sided upward trend. Middle East geopolitical news continued to cause disturbances, and rumors of US-Iran diplomatic tensions led to a rapid contraction in risk premiums. US crude oil production remained high, and EIA inventory data did not provide strong bullish signals, causing oil prices to shift from geopolitical drivers to technical factors-driven range-bound trading. Oil prices broke below the short-term 9-day EMA [83.69] and retraced to the 20-day EMA (81.30) support. The RSI fell back to the neutral zone of 51, returning from overbought to equilibrium, indicating a significant weakening of upward momentum. The previous upward trend line was broken, and the market switched to an 80.50-86.10 trading range, with the broken upward trend line now acting as resistance.
Key price levels next week: From the daily chart, WTI crude oil prices have recently retreated significantly after a surge, approaching the $81 level again, and the short-term upward structure is being tested. Previous technical analysis indicated that the $81.00-$81.50 area was a significant support zone, while the psychological level around $80 represented a stronger medium-term defense. If $80 holds effectively, oil prices may retest the resistance near $83.69 (9-day EMA) amid recurring geopolitical risks. Secondly, the market technical structure previously considered $84.30 a key level, with further upside potential at $86.14 (last week's high). A decisive break below $81.00-$81.50 on the daily chart, followed by a breach of the $80 level, would signify a significant weakening of the recent rebound, and the market might first seek new support near $79.28 (last week's low). A break below this level would then test $78.38 (55-day EMA), followed by $75.70 (nearly three-week low).
Today, consider going long on crude oil at 82.60, with a stop loss at 82.40 and targets at 84.00 and 85.00.
Spot Gold
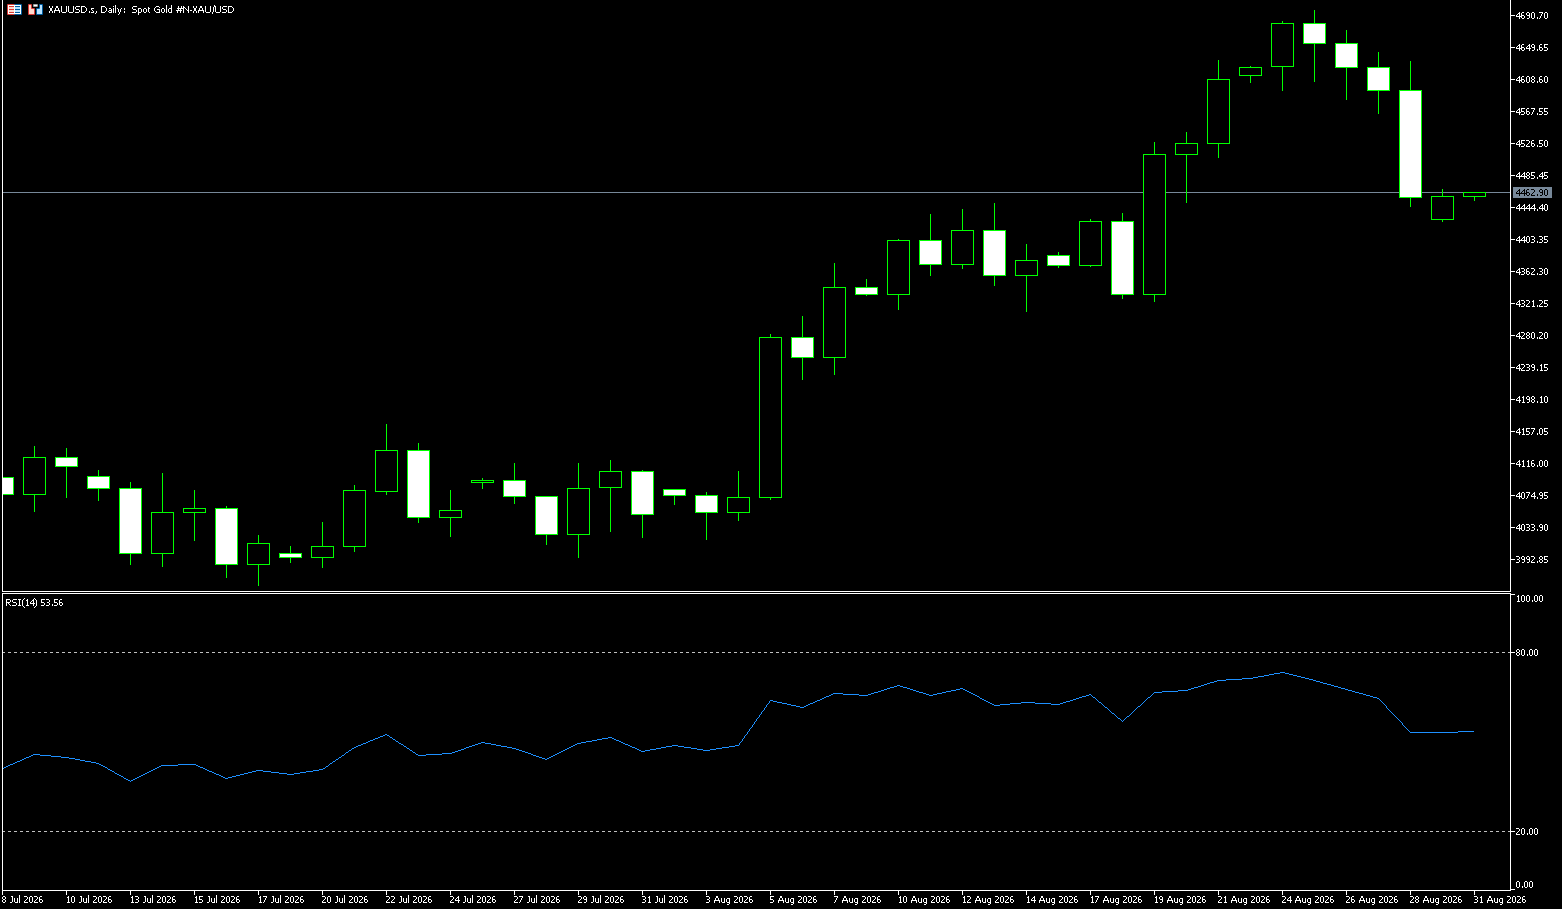
Gold prices fell to $4,445 per ounce on Friday, a one-week low {-3.18%}, as investors digested comments from Federal Reserve Chairman Kevin Warsh, who was considered hawkish. In his first major speech since taking office in May, Warsh warned that inflation had not slowed significantly and said policymakers needed to be confident that potential price pressures were easing; otherwise, the central bank still had “work to do.” He reiterated the Fed’s commitment to restoring inflation to its 2% target, which he described as a “firm and fixed” goal, and said current financial conditions were not restrictive. His closely watched remarks provided a clearer understanding of his economic and policy views after criticism that his more limited communication strategy left the market with little guidance on the near-term outlook. According to CME FedWatch, the market reaction raised the probability of a September rate hike to nearly 50%. Gold prices fell more than 3.18% on Friday as market participants digested hawkish comments from Federal Reserve Chairman Kevin Warsh at Jackson Hole. Rising U.S. Treasury yields and a generally stronger dollar were the two main drivers of the precious metal's sudden weakness. Gold/dollar is currently trading at $4,454 after hitting a high of $4,629. Following his speech, the currency market initially priced in a 50% probability of a 25 basis point rate hike at the Fed's September 16 meeting. As of this writing, investors have lowered that probability to nearly 44%, but for December, they see an 82% probability.
Last week, gold prices continued their strong upward momentum, reaching a high of around $4,697, a new high for the period. The 4-hour RSI entered overbought territory, showing a bearish divergence, indicating weakening upward momentum. On Friday, hawkish comments from the Jackson Hole symposium caused a rapid rise in the US dollar and US Treasury yields, leading to a sharp drop in gold prices. Prices broke through the $4,600, $4,550, and $4,500 levels, reaching a low of around $4,445, resulting in a large bearish candlestick on the weekly chart, ending several weeks of gains. The large bearish candlestick at the high point broke below the 5-day and 10-day moving averages; the MACD histogram contracted rapidly, and the fast and slow lines formed a death cross at a high level, indicating released bearish momentum; the RSI fell from overbought to neutral territory, not yet entering deep oversold territory, suggesting that downward momentum has not been fully exhausted. Previous geopolitical safe-haven demand and central bank gold purchases pushed up gold prices; however, the hawkish signals from Fed officials over the weekend dampened market expectations for interest rate cuts, causing a rebound in the US dollar and US Treasury yields, coupled with a large number of long positions taking profits at higher levels, amplifying the pullback. Technical Outlook for Next Week: Gold prices broke below the 200-day simple moving average at $4,527 on Friday. However, following comments from Warsh, gold prices fell further to a near one-week low of $4,445. From a momentum perspective, buyers remain dominant, as the RSI is above the 50 level. Nevertheless, this indicator has been trending downwards recently, suggesting that sellers are entering the market in the short term. The break below the 200-day simple moving average opens the door to a move towards the $4,410.60 (20-day simple moving average) and below the $4,400 (psychological level) area. The next area to watch is the 100-day simple moving average level at $4,373.50. For buyers, the first resistance level is at $4,500. Once this level is breached, the next target will be the 200-day simple moving average at $4,527, followed by $4,600. A decisive breakout could pave the way for a challenge of the August 27 high of $4,643, potentially leading to the unattainable $4,700.
Consider going long on gold today at $4,450, with a stop-loss at $4,445 and targets of $4,500 and $4,530.
AUD/USD
The Australian dollar remained slightly below US$0.72, near a 15-week high, and was on track for its ninth consecutive weekly gain, its longest winning streak since 2010, as markets increased bets on an impending interest rate hike. The prospect of policy tightening became clearer after a stronger-than-expected July inflation report and household spending data, which showed a 1.1% increase in July despite rising borrowing costs and strong domestic demand. These strong economic data prompted traders to move their bets forward on the Reserve Bank of Australia's (RBA) actions, with several major banks revising their forecasts. National Australia Bank expects the cash rate to rise to 4.6% next month, while Commonwealth Bank and ANZ predict action in November, though acknowledging the possibility of earlier tightening. The market now expects a roughly 50% probability of a rate hike at the RBA's September meeting, a significant increase from 17% previously, with a November hike already fully priced in. Focus now shifts to second-quarter GDP and employment data for further clues about the policy outlook.
The Australian dollar extended its gains against the US dollar for the fourth consecutive trading day, trading around 0.7200. The pair is appreciating due to strong support from rising bets on a Reserve Bank of Australia (RBA) rate hike. This followed a stronger-than-expected July inflation report, reinforcing the prospect of a tighter policy stance. As long as US policy continues to constrain the bond market, the broader FX backdrop will remain favorable for high-yielding currencies. They noted, "From a broader perspective, as long as the US attempts to suppress US Treasury yields and as long as US economic growth remains resilient, emerging markets will offer better FX long opportunities than developed markets, and the market will continue to demand the highest-yielding currency among the G10—the Australian dollar."
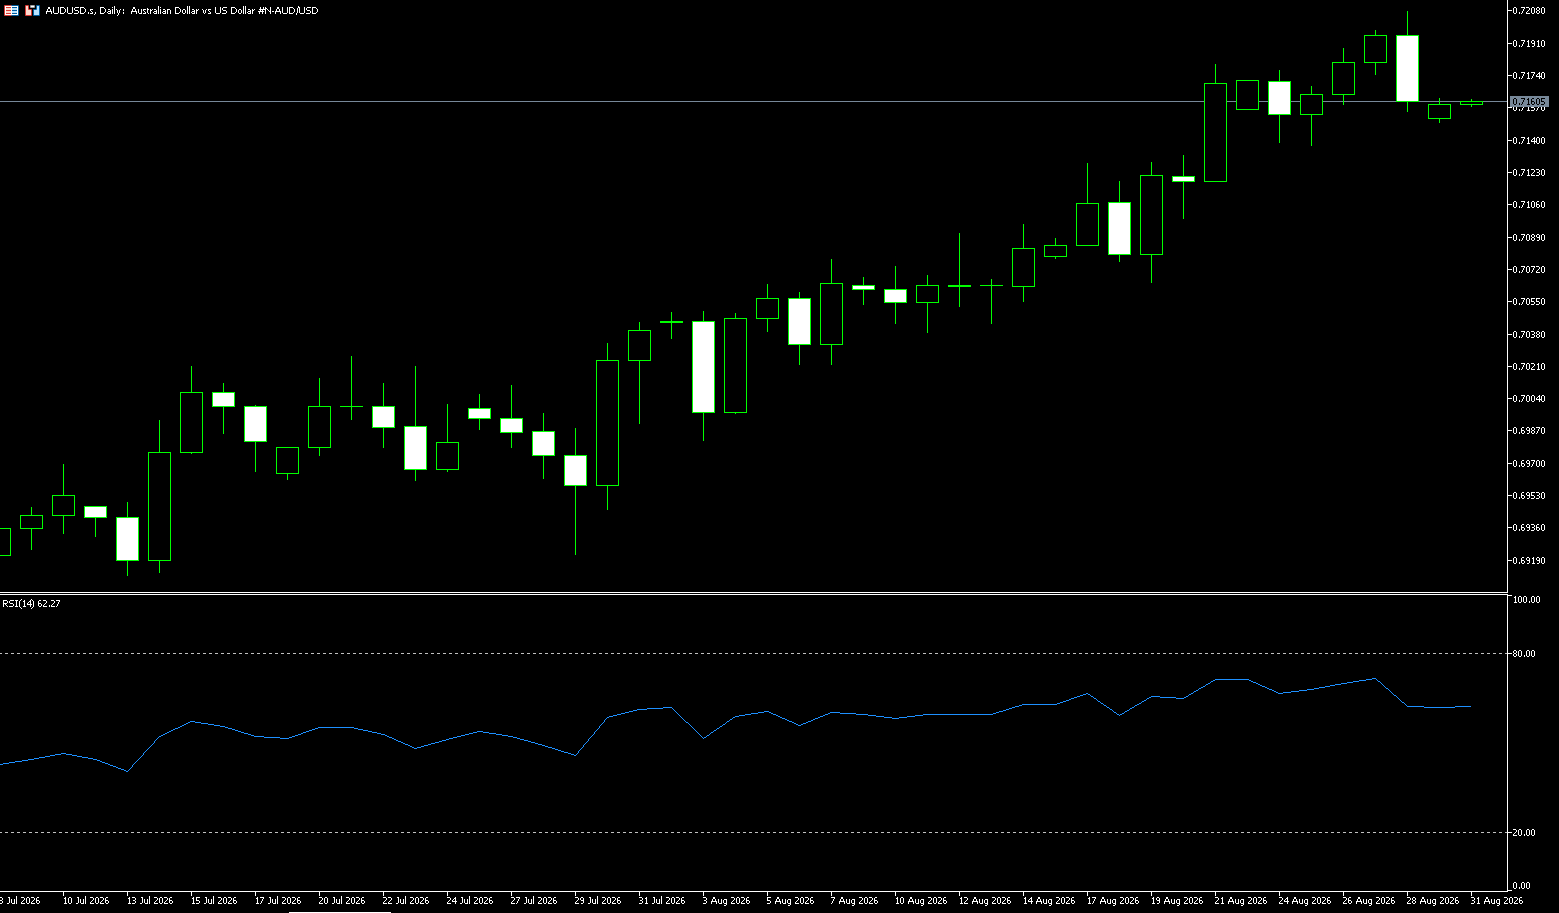
The Australian dollar continued its upward trend last week, reaching higher highs and higher lows, testing the 0.7205 level during the week, trading in a three-month high range. The hawkish RBA meeting minutes and significantly better-than-expected Australian consumer data boosted market expectations for another RBA rate hike, driving the Australian dollar higher; however, a sharp decline in corporate capital expenditure provided some restraint. The exchange rate has stabilized above the 50/200-day moving averages, maintaining a healthy medium-term bullish structure. The RSI has risen to around 70, entering overbought territory, suggesting potential short-term pullback pressure. Last week saw overall strong volatility with bulls in control, but upward momentum slowed as the pair approached key resistance. The Jackson Hole symposium caused volatility in the US dollar, resulting in rapid stop-loss triggers during the session.
On the daily chart, the AUD/USD pair is trading around 0.7200. With the price firmly above the 9-day (0.7148) and 20-day (0.7098) exponential moving averages (EMAs), the pair maintains a short-term bullish bias, pointing to an upward trend in both the short and medium term. The 14-day Relative Strength Index (RSI) is at 64.04, already in overbought territory, indicating strong upward momentum after the recent rally, but potentially slightly overextended. On the downside, initial support lies near the 9-day EMA (0.7148), followed by the psychological level of 0.7100. A deeper pullback is expected, with the broader uptrend remaining intact, potentially attracting bargain hunting around the 34-day EMA (0.7050). On the upside, immediate resistance is at 0.7264 (the May 14 high), followed by the psychological resistance level of 0.7300. A sustained break above this range would pave the way for the next structural resistance at 0.7661 (the June 2022 high).
Consider going long on the Australian dollar today at 0.7155, with a stop-loss at 0.7145 and targets at 0.7190 and 0.7200.
GBP/USD
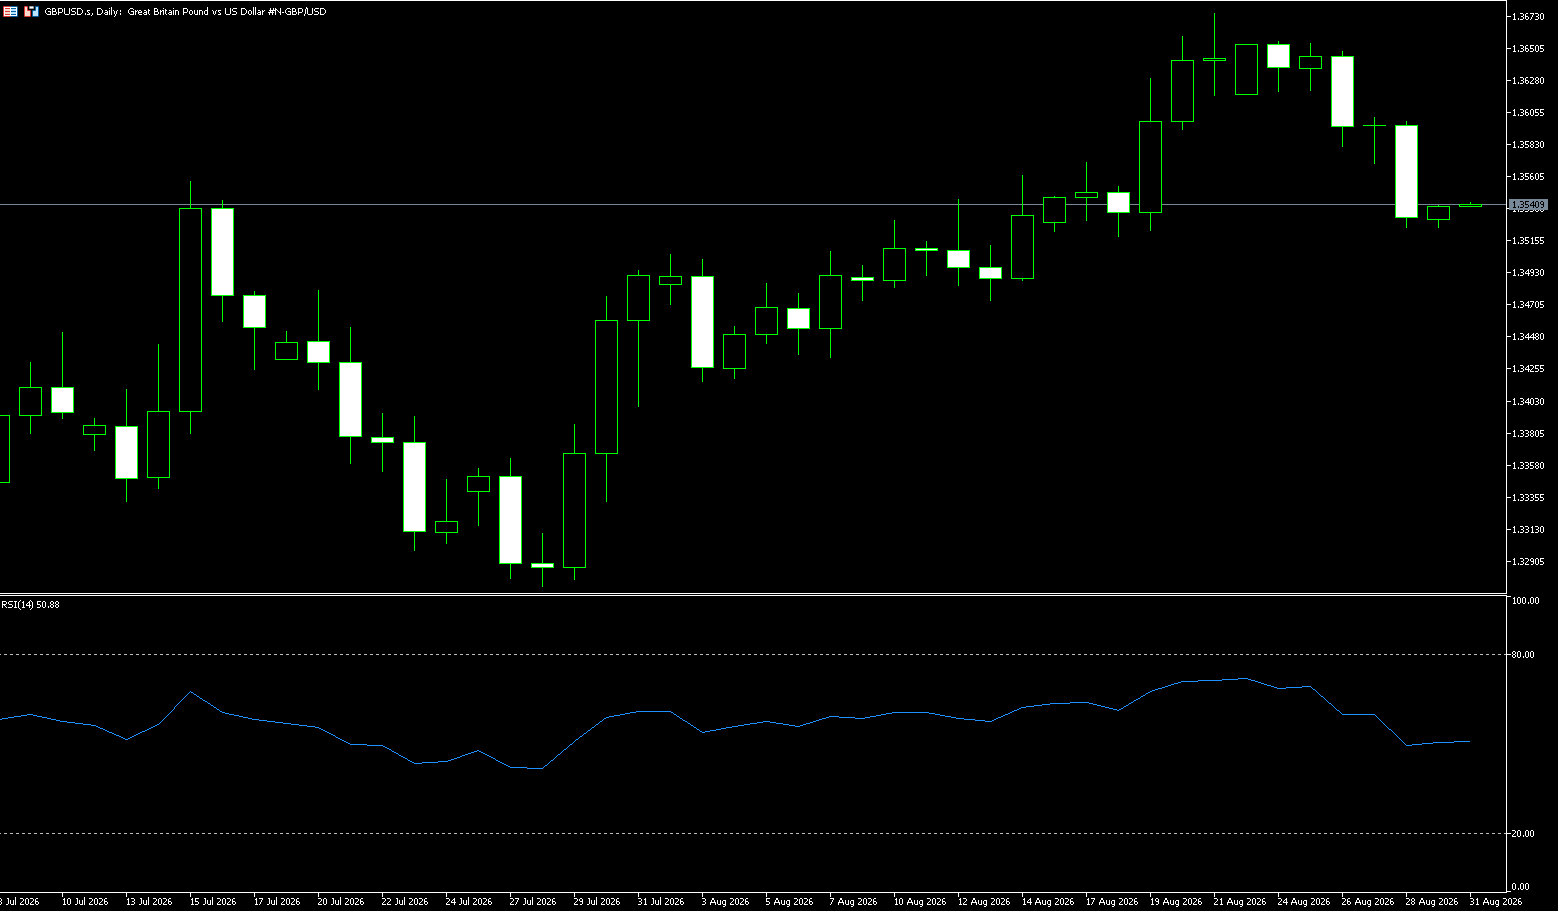
The pound fell to around $1.35, its lowest level since August 19, as hawkish comments from the Federal Reserve supported the dollar, while falling Brent crude prices eased concerns about UK inflation and pushed market expectations for the next Bank of England rate hike to 2027, rather than the end of 2026. In his first major speech since becoming chairman in May, Warsh warned that inflation had not slowed significantly and said policymakers needed clearer evidence that underlying price pressures were easing; otherwise, the Fed still had "work to do." Meanwhile, LSEG data showed the market expects the Bank of England to tighten by about 24 basis points by December and by 36 basis points by February 2027. UK inflation rose to 2.9% in July, mainly driven by rising household energy bills, and is expected to climb further before the end of the year. However, the labor market remains weak, which may make the Bank of England more cautious about tightening policy in the short term.
Federal Reserve official Collins made slightly dovish comments, indicating a reduced urgency for further policy tightening. She emphasized that current policy is already limiting and that a "gradual deinflation" should be promoted. She also argued that portfolio management fees are temporarily distorting overall inflation, and that market-based prices are closer to the target, thus positioning the latest data as volatility rather than a systemic shift. Collins also pointed out that the recent rise in bond yields is consistent with price stability, and stated that inflation should fall without new tariffs or oil price shocks, which also limited further upside potential for the dollar in the short term.
At the beginning of last week, the pound sterling initially rose against the dollar, testing strong resistance at 1.3655-1.3660 before falling back, failing to achieve a significant upward breakout. It subsequently fluctuated and corrected, consolidating in the 1.3530-1.3540 range. The weekly volatility narrowed, and the overall trend entered a high-level consolidation pattern. US core PCE inflation was slightly higher than expected, supporting the dollar and putting downward pressure on the pound. The expectation of a UK interest rate hike has been further postponed to early 2027, leaving the pound lacking independent upward momentum. The exchange rate remains near the 20-day (1.3542) and 34-day (1.3483) simple moving averages, and the medium-term bullish structure remains intact. The MACD is above the zero line, but the red bars are contracting, indicating weakening upward momentum. The RSI has fallen back to around 53, not yet entering overbought territory, representing a technical pullback after the rise, not a trend reversal.
Technical Outlook for Next Week: On the daily chart, the GBP/USD exchange rate remains above the 20-day and 34-day simple moving averages, showing a constructive bullish bias, indicating potential buying support during minor pullbacks. The 14-day Relative Strength Index (RSI) is at 53, biased upwards but not yet showing an overbought signal, suggesting that the bulls still have room to continue their upward trend, although the price is gradually approaching the upper limit of the recent trading range. On the upside, initial resistance is at the August 25 high of 1.3655. The next resistance level is near the Bollinger Band at 1.3677, where the recent bullish trend may begin to face profit-taking. A decisive break above this resistance zone would target the psychological level of 1.3700. On the downside, immediate support lies at the psychological level of 1.3500. The next key level to watch is the 34-day simple moving average at 1.3481, and the 1.3481 area (August 14 low). These levels together form a wide demand zone, which needs to be broken to weaken the current bullish structure.
Consider going long on GBP/JPY today at 1.3525, with a stop loss at 1.3510 and targets at 1.3570 and 1.3560.
USD/JPY
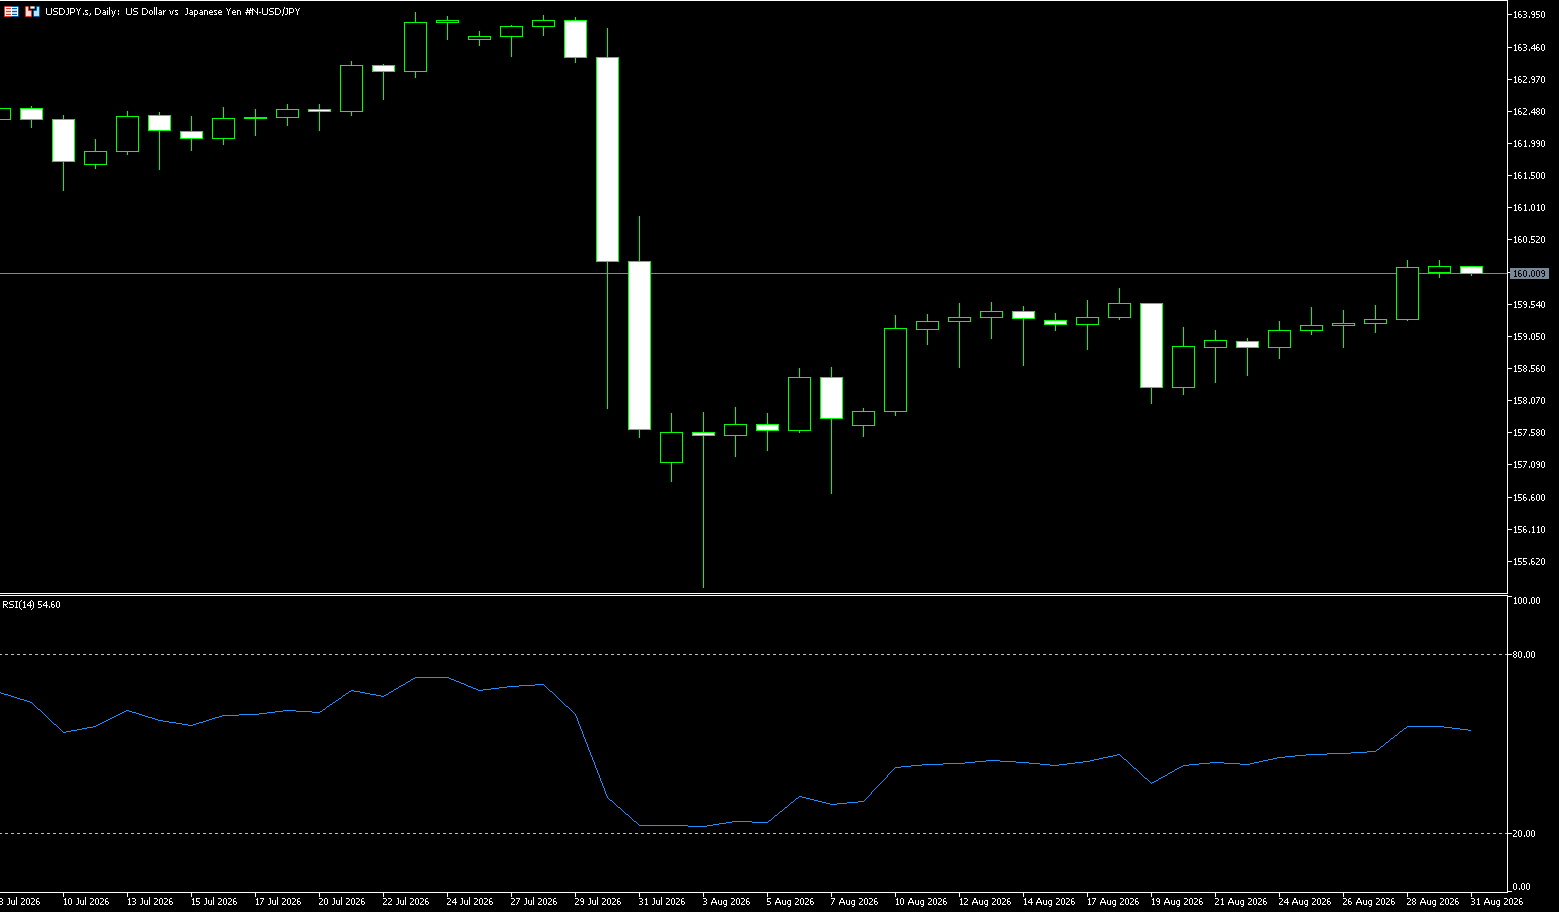
The forex market is entering the core pricing phase of the Jackson Hole global central bank symposium ahead of the weekend. The US dollar index is currently around 99.60, and the USD/JPY exchange rate is around 160.10. The market's real focus is not on whether a single speech will provide a direct policy answer, but rather on how Federal Reserve Chairman Warsh will address the emerging contradictions between inflation, financial conditions, and long-term interest rates. The continued interest rate differential between Japan and other major economies is putting pressure on the yen, prompting investors to borrow the currency at low interest rates and seek higher returns on overseas assets. Growing fiscal concerns in Japan and high oil prices linked to the Middle East conflict have further strengthened the bearish outlook for the yen. Regarding monetary policy, the market increasingly expects the Bank of Japan to raise interest rates in September to address currency weakness and import-driven inflation concerns.
The yen weakened again after Deputy Governor Hirano's latest comments, reflecting some market disappointment that Hirano did not provide a clearer picture of the near-term policy path. Although he didn't "explicitly" hint at a rate hike next month, "his overall tone was undoubtedly hawkish." In his speech and the subsequent press conference, Himano emphasized that the Bank of Japan needs to "pay closer attention to upside risks to inflation than before," which MUFG described as "the closest indication to a possible faster pace of rate hikes." This comes after the Statistics Japan released Tokyo's August CPI data last Friday; the Bank of Japan closely monitors this indicator as it better reflects trend inflation. The report reinforced market expectations that the Bank of Japan might raise rates as early as its policy meeting on September 17-18. This, in turn, provided some support for the yen and put pressure on the currency pair.
The interplay between sticky US inflation and expectations of a Japanese rate hike has kept the USD/JPY pair consolidating above 159. From a daily chart perspective, after a continuous rise, USD/JPY encountered significant resistance around 160, and has now finally risen slightly above 160. The area around 160 is the first important area to watch. If the exchange rate can stabilize above 160, the daily bullish structure of the US dollar remains intact. After re-breaking through 159.78 (August 18th) - 160.00 (a psychological level), the next resistance levels to watch are 160.42 (the Bollinger Band) and 160.88 (the high of July 31st). If strong buying of the US dollar re-emerges, the area around 163.99, the previous high of July 23rd, will become a longer-term resistance level. Conversely, if USD/JPY effectively breaks below 159.20 (the 9-day moving average) and 159 (the psychological level), and further falls below the 158.88-158.60 area, it means that the short-term upward momentum has weakened significantly, and the market may further test 158.05 (August 19th). Support is expected around 158.00 (a psychological level). Further down, watch the 156.68 level (the low of August 7th).
Overall, the daily trend has not yet clearly reversed; it is currently closer to a directional choice phase within a high-level consolidation. Whether USD/JPY can hold 159 will be a crucial indicator of the short-term trend strength. Next week's outlook – two scenarios: Bullish scenario (higher probability): Holding the 158.50 support, repeatedly testing the 159.80-160 level; with technical volume breaking above 160, a new round of upward movement will begin. Bearish scenario: Weakening US inflation data, or stronger signals of interest rate hikes from Bank of Japan officials, a decisive break below 158.50 would lead to a pullback, with downside targets at 158.10 and 157.20.
Today, consider shorting USD at 160.30, with a stop loss at 160.50 and a target of 159.50. 159.40
EUR/USD
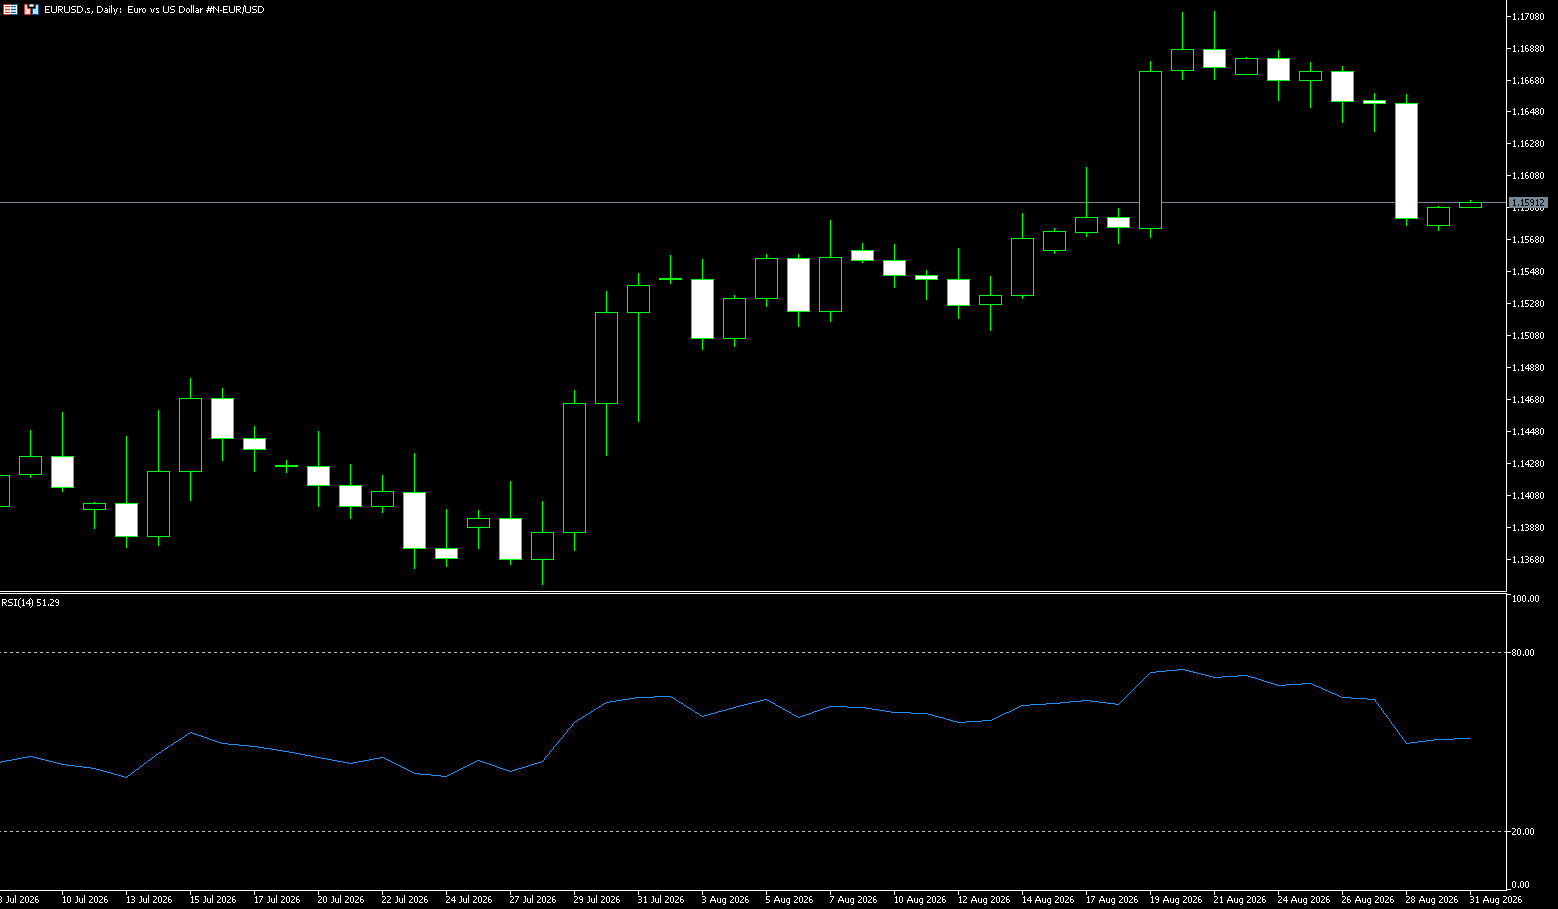
The euro/dollar pair fell sharply, approaching 1.1590, following comments from Federal Reserve Chairman Kevin Warsh at the Jackson Hole symposium, as the dollar strengthened. Warsh emphasized that the central bank's primary focus should be price stability, prompting markets to increase bets on a September rate hike. Warsh stated that the Fed needs to be confident that underlying inflation is moving toward its target, adding that otherwise policymakers "have work to do." The Fed chairman also said he found it "difficult" to describe current financial conditions as tightening, while noting that credit and lending markets showed little sign of monetary policy constraints. These remarks reinforced the view that the Fed may maintain a tightening stance as it seeks to sustainably pull inflation back to its target level.
The hawkish comments triggered a repricing of market expectations regarding the Fed. According to the CME FedWatch Tool, the market currently expects a 57% probability of a rate hike at the September meeting, up from about 36% before Warsh's speech. This sharp repricing has brought a September rate hike back on the table, reinforcing the bullish reaction of the dollar. This change supported the dollar, with the dollar index, which measures the dollar against six major currencies, rising to around 99.65. Meanwhile, US data released on Friday was mixed. The preliminary non-farm payrolls revision released by the Bureau of Labor Statistics showed that total non-farm payrolls for the 12 months ending in March were revised down by 79,000, or 0.1%. This relatively mild adjustment did not substantially change the overall picture of the US labor market during this period.
Last week's EUR/USD exchange rate: After initially testing the strong resistance at 1.1710, it encountered selling pressure and fell back, entering a high-level range-bound trading pattern without forming a valid upward breakout. The price briefly... The euro traded within a narrow range of 1.1635-1.1710, with intraday volatility consolidating. The market awaited the Jackson Hole speech and US PCE inflation data, leading to a wait-and-see approach and limiting unilateral fluctuations. Positive Eurozone PMI data supported the euro, while the dollar was pressured by expectations of US Treasury buybacks, but did not weaken further. The exchange rate held above the 50-day and 200-day moving averages, maintaining a healthy medium-term uptrend structure; however, the MACD histogram above the zero line contracted, indicating weakening bullish momentum, and the RSI fell back to 52, shifting from slightly overbought to neutral-to-strong, suggesting slowing upward momentum and profit-taking pressure.
Key events next week: Eurozone preliminary CPI, US ISM Manufacturing/Services PMI, and US Non-Farm Payrolls (NFP). These data releases could easily break the current range-bound trading pattern. The euro/dollar pair previously experienced a significant upward shift in its trading range, briefly approaching the upper Bollinger Band at 1.1702 before consolidating at higher levels. The Bollinger Bands' widening is still present, indicating that recent actual volatility is higher than during the previous consolidation phase. Key resistance next week— First resistance: 1.1705-1.1710 (this week's high resistance) Second resistance: 1.1740-1.1750 (medium-term strong resistance). Only if the daily closing price firmly holds above these levels will the rebound further open up, targeting 1.1780-1.1800. First support: 1.1564 (August 17 low); Second support: 1.1523 (34-day moving average). If these levels are broken, the rebound structure weakens, and a deeper pullback targets the 1.1500 (psychological level) range.
Today, consider going long on Euro at 1.1570, with a stop loss at 1.1560 and targets at 1.1620 and 1.1630.
Stock Analysis:
Australian ASX 200 Stock Index
Basic Market Overview:
The Australian Securities Exchange (ASX) 200 index rose 54 points, or 0.6%, to close at 9,092 on Friday, ending a two-day losing streak. Strong performance in business services, technology, healthcare, and energy and mining boosted market sentiment. Traders are focused on key domestic data releases from Australia next week, including Q2 GDP and July trade figures, while in major trading partner China, July PMI data will be released through both official and private surveys. However, gains were limited as US stock index futures mostly fell, with investors remaining cautious about the interest rate path ahead of Federal Reserve Chairman Kevin Warsh's Jackson Hole speech.
In the local market, concerns persisted that the cash rate might remain high due to higher-than-expected July inflation, driving bets on a rate hike at the next Reserve Bank of Australia meeting. Outstanding performers included Xero (up 5.2%), PLS Group (up 3.8%), and Wisetech Global (up 3.1%). Shares of the four major banks rose, with heavyweight BHP gaining 0.9%. The market rose 0.4% this week, marking its first gain in three weeks.
Sector Performance:
Leading Gains: Materials/Mining (Gold, Lithium), Healthcare, Business Services, and Technology Software performed strongly.
Lagging Gains: Real Estate REITs, Consumer Discretionary, and some financial and banking sectors were pressured by inflation-driven expectations of interest rate hikes.
Technical Analysis:
The ASX200 index closed at 9092 points last week, up 0.4% for the week, ending two consecutive weeks of declines. The index experienced significant volatility during the week, with a pullback in the middle of the week due to inflation data, followed by a rebound at the close on Friday. Last Week's Technical Recap: The index initially rose to around 9186, but on Wednesday, Australian July inflation data exceeded expectations, leading the market to revise its expectations for a Reserve Bank of Australia (RBA) rate hike, causing the index to fall rapidly. It bottomed out at 9038 on Thursday; on Friday, it recovered most of its losses, following a rebound in overseas markets and resource stocks, closing at 9092 points. The index remains above its medium- and long-term moving averages, maintaining a bullish medium-term trend, but short-term momentum is weakening. The RSI (14) returned to around 51 at the end of the week, within a neutral range; the MACD histogram turned negative, indicating a short-term pullback signal, but the two lines are still above the zero axis, representing a correction within an upward trend, not a trend reversal.
Key events next week: Australia's Q2 GDP, July trade data; China's PMI; speeches by Fed officials; commodity price fluctuations; and the repricing of RBA interest rate hike expectations. Technically, strong resistance lies at 9180-9220 (this week's high + upper Bollinger Band; a breakout would open up upward space), while support lies at 9030-9050 (Thursday's low, a short-term dividing line between bullish and bearish). Meanwhile, the technical scenario prediction—a slightly bullish scenario: a firm hold above 9050, testing the 9180 resistance level; this requires simultaneous strength from resource stocks and the banking sector, and Australian GDP data must not fall significantly short of expectations. Neutral Scenario (High Probability): The price will fluctuate widely between 8980 and 9180, influenced by domestic economic data, China's PMI, and the US stock market, resulting in a back-and-forth struggle between bulls and bears. Weakening Scenario: A decisive break below 8980 (50EMA) would damage the medium-term bullish structure, leading to a further decline to the 8880-8900 range. Trading Strategy: Short-term traders (3-5 day perspective) – Bullish: If the price retraces to the 9030-9050 support level and stabilizes, a small long position can be attempted; the stop-loss should be placed below 8970; the first target is 9170-9200. Bearish: If the price rebounds to the 9170-9220 resistance zone and encounters resistance, a short position can be attempted; the stop-loss should be placed above 9240; the target is 9050-9030.
Trading Strategies:
Short-Term Trading Strategies (Intraday - 3-Trading-Day Perspective)
1. Bullish Strategy
• If a pullback to the 8965-8980 support zone shows a reversal candlestick pattern, a small long position can be initiated; stop-loss should be placed below 8900; first target 9087-9100, second target 9160-9200.
• Avoid chasing highs; only consider going long after a firm recovery above 9100.
2. Bearish Strategy
If the early morning rebound is weak and the price is pressured below 9100, and then breaks below 9000, a small short position can be initiated; stop-loss should be placed above 9125; first target 8965-8980, with a further target of 8900 if the price breaks below.
Key Risk Warnings:
1. RBA Interest Rate Hike Risk: Inflation is sticky; if GDP data is strong, the market will further price in a rate hike, suppressing the banking, real estate, and consumer sectors, dragging down the index.
2. External Risks: Volatility in US stocks, hawkish statements from the Federal Reserve; weaker-than-expected Chinese PMI will directly pressure Australian resource stocks.
3. Commodity Volatility: A significant pullback in gold and iron ore prices will drag down ASX200 weighted mining stocks.
4. Technical Risks: If the closing price effectively breaks below the 50-day moving average of 8980, it signifies a deep correction in this round of gains; blindly buying the dip is not advisable.
Dow Jones Industrial Average
Basic Market Overview:
US stock indices closed lower on Friday as chipmaker stocks pared gains from the previous session, while Fed Chairman Warsh's more hawkish tone strengthened expectations of a rate hike next month. The S&P 500 fell 0.2%, the Nasdaq fell 0.7%, and the Dow Jones Industrial Average declined slightly. Meanwhile, Warsh, speaking at the Jackson Hole symposium, stated that underlying inflation has not slowed and pledged to continue curbing price growth until it converges with the Fed's 2% target, prompting traders to increase their bets on a rate hike next month. Industrial and pharmaceutical stocks fell, with AbbVie down 1% and Lam Research down 5.2%.
The quality of the next rebound may be more important than the current decline itself. If the Dow can break through 54,744 points again after the correction, it indicates that the current uptrend remains intact. Conversely, if the subsequent rebound weakens and fails to break through 54,744 points, while the market gradually forms a price structure with lower highs and lower lows, then the probability of the end of the third wave will significantly increase. If the historical high of 54,744 points is not broken and the index further falls below 50,512 points, and the subsequent rebound fails to recover this level, then the possibility of a higher-level correction underway will significantly increase. Sector Performance:
Potential Leading Sectors (Dow Jones Components):
1. Financials (Banks, Investment Banks): JPMorgan Chase, Goldman Sachs, Morgan Stanley, American Express
2. Industrials/Capital Goods: Caterpillar, United Technologies, Honeywell
3. Consumer Staples (Defensive Sector): Walmart, Coca-Cola
Potential Lagging/Under Pressure Sectors (Dow Jones Components):
1. Large-Cap Technology (Dow Jones Components): Apple, Microsoft, Intel
2. Consumer Discretionary: Disney, etc.
3. Pharmaceuticals (Partial): Amgen, Merck
Technical Analysis:
Early last week saw a rapid dip, reaching a low of around 52754. Subsequent buying support led to a rebound, and the market maintained a high-level range-bound movement in the latter half of the week. The market tested resistance around 53820 but failed to break through effectively, closing the week around 53560. Weekly candlestick... The market closed with a small positive candle, indicating a consolidation phase following a sharp decline. Last week's market characteristics included moderate trading volume, with neither a breakout nor a sharp sell-off; the market was caught in a tug-of-war between persistent inflation, expectations of a Fed rate hike, and high US Treasury yields, with funds leaning towards a wait-and-see approach, resulting in a clear consolidation pattern. Strong support last week was 53200-53350, which held after multiple pullbacks and became the bulls' defensive zone this week. Meanwhile, the first resistance level was 53750-53820, which repeatedly encountered resistance and retreated, representing a strong short-term resistance level.
Next week's technical outlook: The core judgment is that the overall bullish trend remains intact, but short-term upward momentum is lacking. The primary focus is on range-bound trading, awaiting a directional move; an upward breakout above resistance will open a new round of upward movement, while a downward break below key support will trigger a deeper correction. Technical indicators show: RSI: Maintained in the 48-55 range, a neutral range, with no significant overbought or oversold conditions, indicating a balance between bullish and bearish forces. MACD: The daily chart shows the red bars narrowing, indicating weakening momentum and no clear trend direction. Currently, the index has stabilized above the medium-term moving average, and the medium-term trend remains upward; short-term moving averages are intertwined, indicating a range-bound trading pattern. Next week's scenario projections: Bullish scenario: Stabilizing above 53350 support, breaking through 53820 resistance with increased volume, targeting 54070-54230. Sideways scenario (high probability): Trading within the 53200-53820 range, awaiting macroeconomic data catalysts. Bearish scenario: A decisive break below 53200, with a closing price holding below it, could lead to further declines towards the 52550-52760 range.
Trading Strategy:
Operational Strategy (Short-term - Swing Trading Perspective): This is for technical scenario reference only and does not constitute trading advice.
1. Short-Term Strategy
• Bullish: If a pullback to the 53200-53350 range finds support and shows signs of bottoming out, a bullish position can be considered; place a stop-loss below 53000; the first target is 53750-53820, with a further target around 54070 if it breaks through.
• Bearish: If a rally to 53750-53820 encounters resistance and fails to break through with sufficient volume, a pullback can be considered; place a stop-loss above 53950; the initial target is 53350, with a further target of 53200.
2. Swing Trading Strategy
• A firm hold above 54230 opens up a bullish swing, targeting the previous high of 54744.
• A decisive break below 52550 on the weekly chart disrupts the medium-term bullish momentum; avoid long positions and shift to a sell-on-rallies strategy.
Key Risk Warnings:
1. Fed Policy Risk: Strong inflation data could lead to a market repricing of the probability of interest rate hikes, causing US Treasury yields to rise and directly suppressing US stock valuations, potentially triggering a rapid correction.
2. Key Data Impact: If US employment and PMI data significantly exceed expectations next week, it could cause the index to gap up, breaking through support or resistance levels and invalidating technical patterns.
3. Component Stock Risk: Significant fluctuations in any of the 30 weighted components of the Dow Jones Industrial Average (such as consumer staples or industrial leaders) could drive abnormal index volatility.
4. Geopolitical Risk: Escalating geopolitical conflicts could boost risk aversion, triggering a sell-off in US risk assets.
Disclaimer: The information contained herein (1) is proprietary to BCR and/or its content providers; (2) may not be copied or distributed; (3) is not warranted to be accurate, complete or timely; and, (4) does not constitute advice or a recommendation by BCR or its content providers in respect of the investment in financial instruments. Neither BCR or its content providers are responsible for any damages or losses arising from any use of this information. Past performance is no guarantee of future results.
Lebih Liputan






2026 © - All Rights Reserved by BCR Co Pty Ltd
Pendedahan Risiko:Instrumen derivatif diniagakan di luar bursa dengan margin, yang bermakna ia membawa tahap risiko yang tinggi dan terdapat kemungkinan anda boleh kehilangan seluruh pelaburan anda. Produk-produk ini tidak sesuai untuk semua pelabur. Pastikan anda memahami sepenuhnya risiko dan pertimbangkan dengan teliti keadaan kewangan dan pengalaman dagangan anda sebelum berdagang. Cari nasihat kewangan bebas jika perlu sebelum membuka akaun dengan BCR.
BCR Co Pty Ltd (No. Syarikat 1975046) ialah syarikat yang diperbadankan di bawah undang-undang British Virgin Islands, dengan pejabat berdaftar di Trident Chambers, Wickham’s Cay 1, Road Town, Tortola, British Virgin Islands, dan dilesenkan serta dikawal selia oleh Suruhanjaya Perkhidmatan Kewangan British Virgin Islands di bawah Lesen No. SIBA/L/19/1122.
Open Bridge Limited (No. Syarikat 16701394) ialah syarikat yang diperbadankan di bawah Akta Syarikat 2006 dan berdaftar di England dan Wales, dengan alamat berdaftar di Kemp House, 160 City Road, London, England, EC1V 2NX. Open Bridge Limited bertindak semata-mata sebagai pemproses pembayaran untuk BCR Co Pty Ltd dan tidak menyediakan sebarang perkhidmatan kewangan, perdagangan atau pelaburan bagi pihaknya. Peranan Open Bridge Limited adalah terhad kepada pemprosesan pembayaran.


 English
 简体中文
简体中文
 繁體中文
繁體中文
 Bahasa
Melayu
Bahasa
Melayu
 Tiếng
Việt
Tiếng
Việt
 ไทย
ไทย
 日本語
日本語
 한국어
한국어
 ភាសាខ្មែរ
 español