


0
US Dollar Index
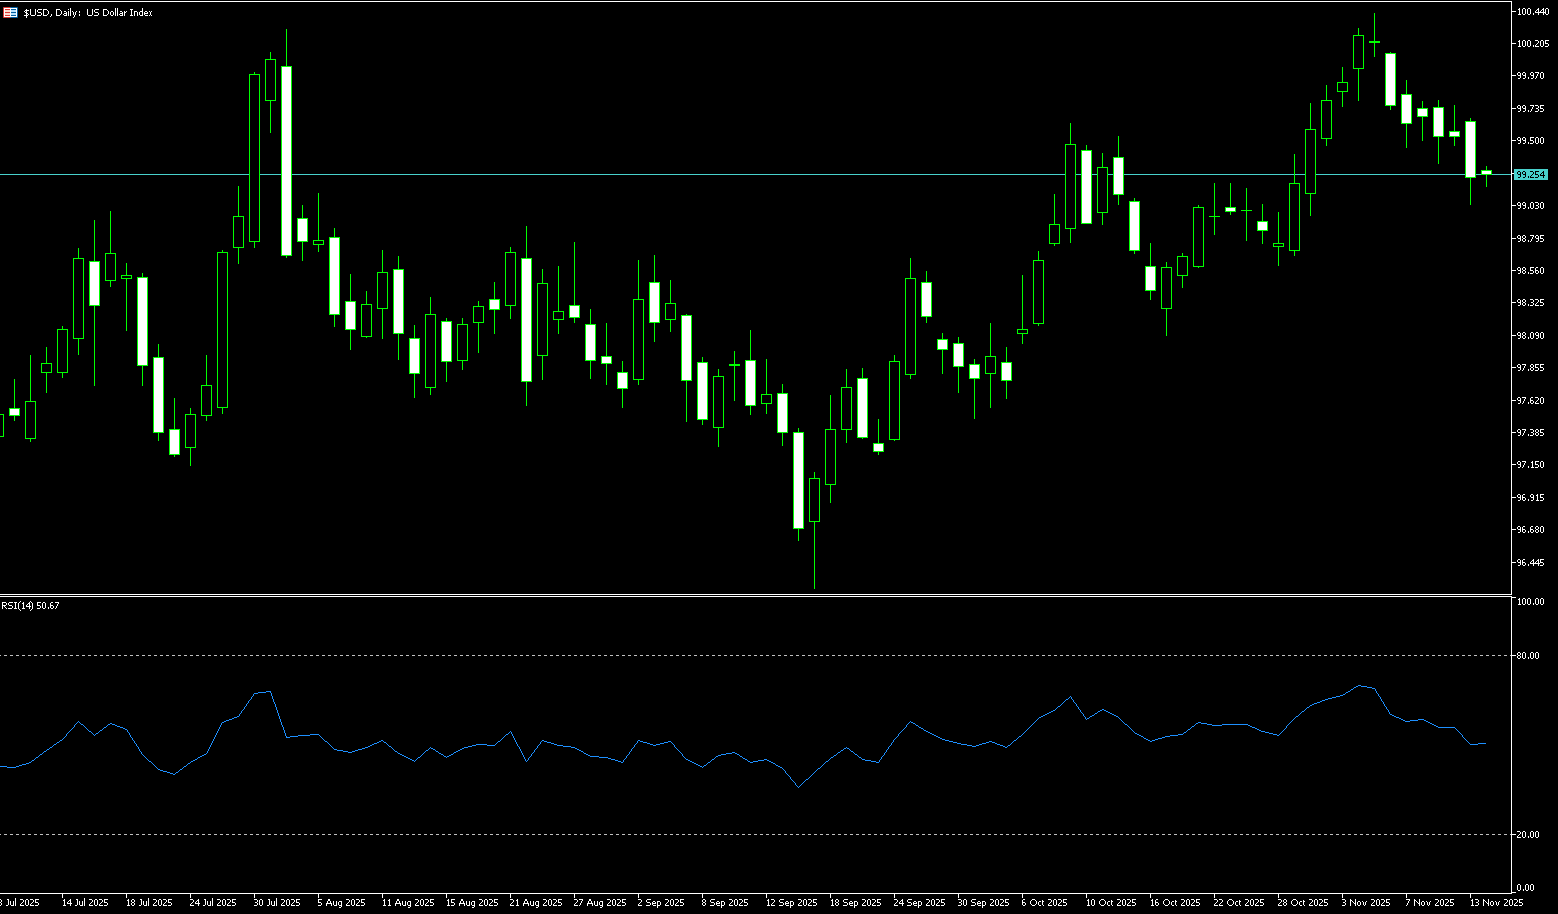
The US dollar traded in a narrow range during the Thanksgiving holiday, with reduced liquidity. While the dollar remains vulnerable to converging towards lower short-term swap rates, the index repeatedly fell to near a two-week low of 99.38 last week and is poised to close the month with a slight decline as investors bet on further rate cuts by the Federal Reserve. The market currently estimates an 87% probability of a 25 basis point rate cut in December, with three more cuts expected next year. Reports indicate that Kevin Hassett, director of the White House National Economic Council, is the top candidate for the next Federal Reserve chairman, a choice seen as consistent with President Donald Trump's preference for rate cuts. Demand for greenbacks as a safe haven has also weakened amid ongoing negotiations on a potential peace deal in Ukraine, potentially boosting the euro. The dollar is on track for its biggest weekly drop against the New Zealand dollar after the Reserve Bank of New Zealand hinted at the end of the current easing cycle. Meanwhile, geopolitical news remains closely watched, although its impact on foreign exchange has been contained so far. President Putin stated yesterday that the draft resolutions discussed in Geneva could form the basis for a future agreement with Ukraine, and US peace envoy Steve Vitkov confirmed his visit to Moscow next week. Ahead of Vitkov's departure, expectations for a breakthrough in negotiations may build. Despite market caution regarding the prospects of a peace agreement, any substantial progress from here should put pressure on the dollar and support high-beta European currencies.
The US dollar index is currently hovering around 99.45 after retracing towards the upward trendline that has dominated the overall uptrend since early October. The index is testing the support zone formed by this trendline, the 50-day simple moving average at 99.02, and the psychological level of 99.00, a key point of contention between bulls and bears. Meanwhile, the 14-day Relative Strength Index (RSI) on the daily chart is around 49, indicating a cooling of momentum, but no signs of extreme weakness. If the bulls successfully defend this trendline support, the US dollar index may rebound to 99.72 (last Thursday's low) and 99.74 (the 20-day simple moving average), then challenge the 100 (psychological level). A break above this level would target 100.39, the recent high of the November 21st trading session. Conversely, if it breaks below the 99.02 (50-day simple moving average) and 99.00 (psychological level) support area, it may test 98.56 (October 28th low) and 98.56 (the 100-day simple moving average), weakening the short-term upward structure. The next target is the 98.03 (October 17th low) and 98.00 (psychological level) area.
Today, consider shorting the US Dollar Index around 99.58; Stop loss: 99.70; Target: 99.20; 99.10
WTI Crude Oil
WTI crude oil traded around $59.50 per barrel last week, rebounding for the first time after four consecutive weeks of decline. Predictions of a global supply glut have intensified as OPEC+ resumes production and non-OPEC producers increase output. Meanwhile, President Putin stated that President Trump's proposal to end the war in Ukraine could lay the foundation for a future agreement and expressed a willingness to negotiate. A breakthrough could potentially lift sanctions on Russian crude oil and release restricted supplies to major buyers. However, the market is skeptical that an agreement will be reached quickly, and even if one is achieved, Russian exports are expected to take time to expand. Traders are now focused on Sunday's virtual OPEC+ meeting, where the organization is expected to maintain its plan to suspend production increases in early 2026. The focus may shift to a long-term review of member production capacity. The current market exhibits typical characteristics of a "news vacuum." On the one hand, the expectation of a ceasefire between Russia and Ukraine brings potential supply pressure to the market, as any progress in peace could release more Russian crude oil into an already oversupplied market. On the other hand, the expectation of a Fed rate cut supports the demand outlook, offsetting some of the decline.
The current "stabilization at low levels" in WTI is more of a technical equilibrium than a trend reversal signal. The fundamentals remain clearly bearish: inventory rebuilding, weakening demand, and potential increases in Russian oil supply constitute a triple pressure. Looking at the daily chart, WTI crude oil has recently been under pressure below key moving averages, with prices fluctuating narrowly between $57.03 (November 25th low) and $60.00 (psychological level), indicating an overall bearish technical pattern. This confirms a medium-term weak trend. The MACD indicator is below the zero line, and although the green bars have slightly converged, there is no obvious bullish divergence, indicating that while the downward momentum has slowed, the bears still dominate. The 14-day RSI is hovering below 50, not yet in oversold territory, indicating cautious market sentiment but no panic selling. If WTI crude oil breaks below the psychological support level of $58.00, it could accelerate its decline towards the key support level of $57.03 from last week; a further break below this level would target $55.97 (the low of October 20th). Conversely, it needs to hold above $59.51 (the 40-day simple moving average), the psychological level of $60, and break through the 65-day simple moving average at $60.86, followed by $52.38 (the high of October 24th) to alleviate short-term downward pressure. Currently, both technical and fundamental factors are weak, and the rebound lacks sufficient volume, suggesting a continuation of the weak consolidation within a range in the short term.
Today, consider going long on spot crude oil around 59.30; Stop loss: 59.10; Target: 61.00; 61.20

Spot Gold
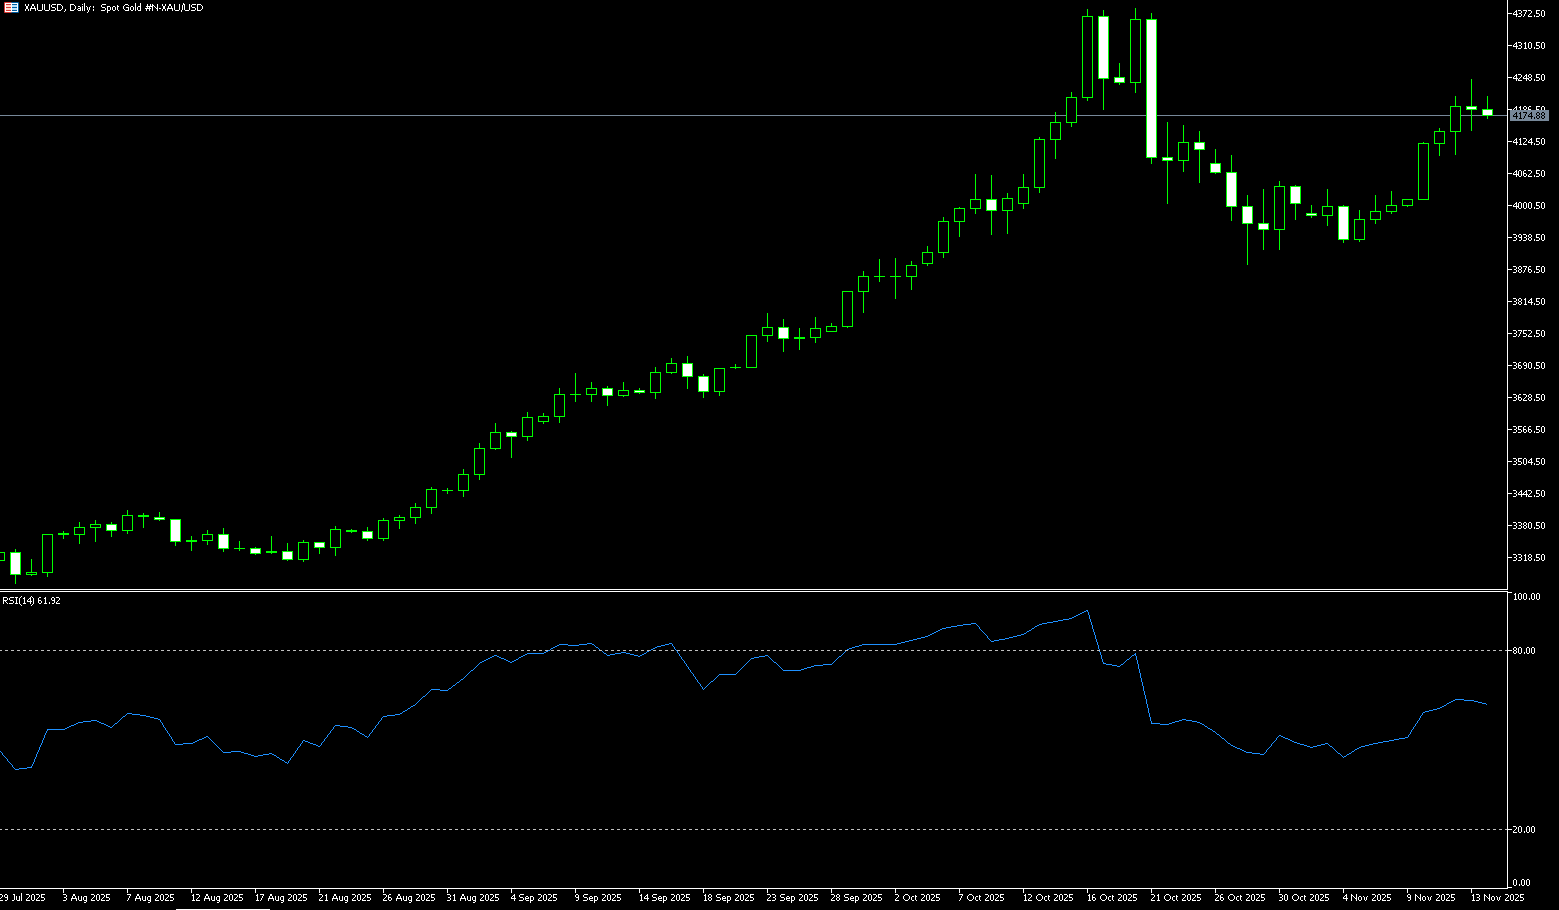
Gold prices rose last week to approximately $4,220.80 per ounce, marking the fourth consecutive monthly gain, as investors became more confident in a December rate cut by the Federal Reserve. A series of comments from Fed officials supporting further monetary easing, coupled with weak economic data released after delays, reinforced expectations. Furthermore, Kevin Hassett, considered the frontrunner to replace Jerome Powell, reaffirmed President Trump's support for rate cuts. The market now prices in a probability of a 25 basis point rate cut next month exceeding 80%, a significant increase from 30% a week ago. Investors are also pricing in three more rate cuts before the end of 2026. Supported by large-scale central bank purchases and strong inflows into non-sovereign ETFs, the metal is on track for its strongest annual performance since 1979. On the other hand, it has risen 57% year-to-date. This year's surge was driven by a combination of positive factors, including increased central bank gold purchases, persistent inflation, and investor concerns about the strength of the US economy and tariff policies. Furthermore, gold prices are expected to remain neutral in the short term, primarily due to uncertainty surrounding Federal Reserve policy, but in the long term, the continuation of the interest rate cut cycle will inject new vitality into gold. The Fed is expected to continue lowering interest rates until 2026, and lower real interest rates will directly benefit gold.
Since reaching a record high of $4381.20 on October 20th, gold prices have corrected by about 5%, but have remained firmly above the key psychological level of $4000, indicating solid underlying support in the market. From a key technical perspective, gold prices are currently at a critical juncture for short-term directional choice. Gold prices are currently stable above the 20-day simple moving average at $4087.20, which forms important dynamic support for the recent pullback. This consolidation above the moving average suggests that the pullback since the October high may only be a healthy correction within a long-term uptrend, rather than a trend reversal. As long as gold prices hold above the $4,100 (psychological level) and the $4,087.20 (20-day simple moving average) area, the short-term technical structure remains bullish. A break above the $4,200 (psychological level) and the $4,245 (November 13 high) area could trigger a corrective upward move, targeting the $4,300 level and the previous historical high of $4,381.20.
Today, consider going long on spot gold around $4,215; Stop loss: $4,210; Target: $4,250; $4,260
AUD/USD
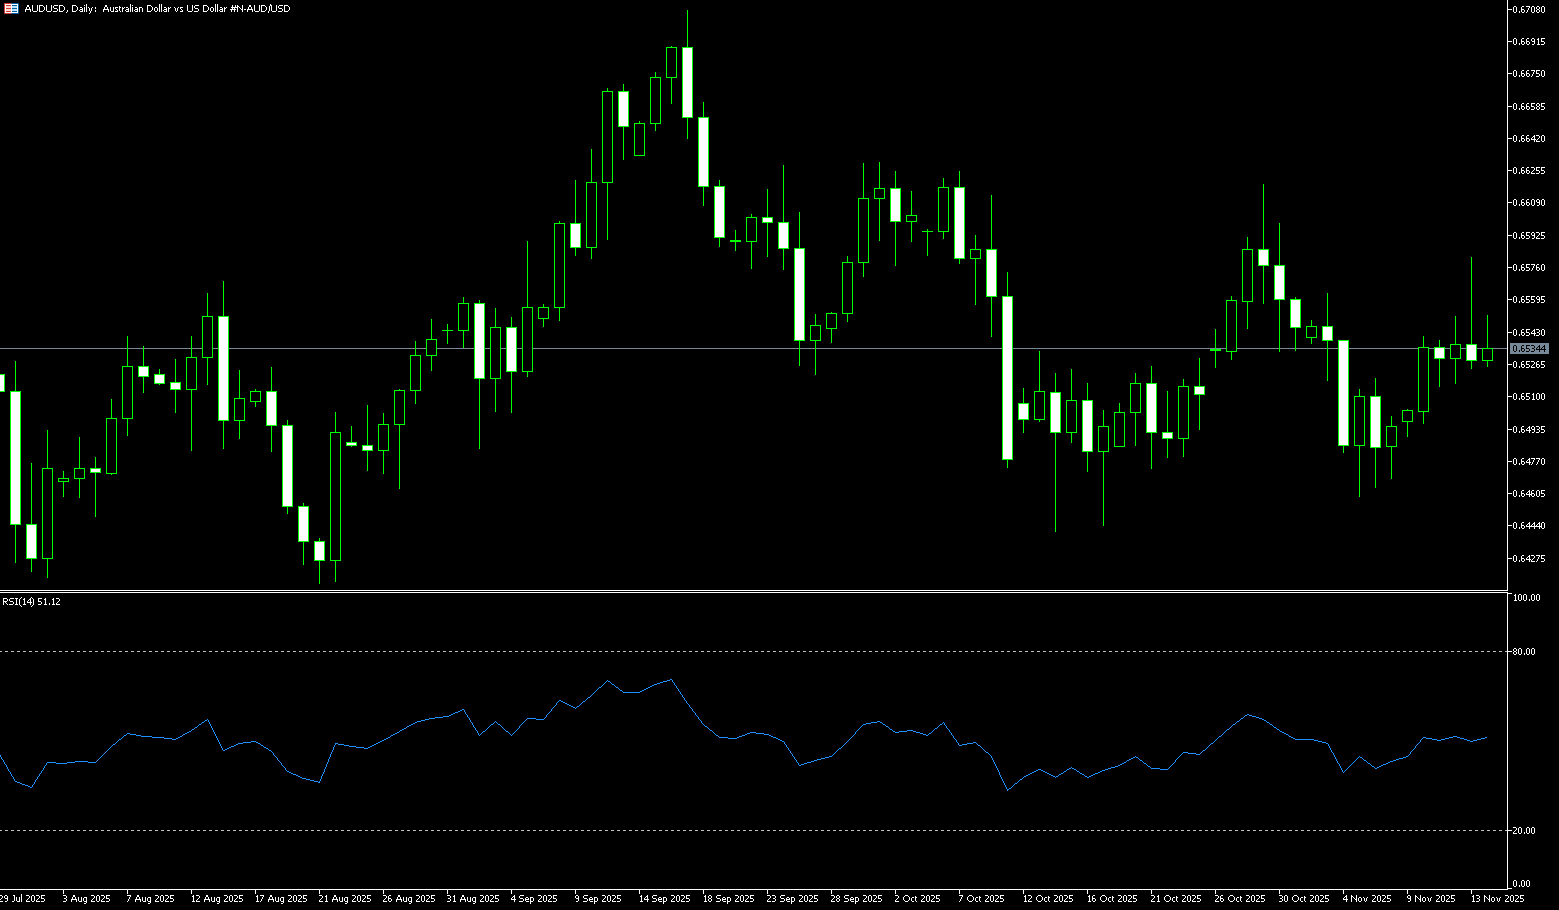
Last week, the Australian dollar rebounded to around $0.6558, reaching a near three-week high and extending its gains for the sixth consecutive day. However, the Australian dollar strengthened against major currencies as higher-than-expected inflation eased market expectations for the Reserve Bank of Australia (RBA) to ease policy and reignited the risk of interest rate hikes. This followed stronger-than-expected inflation data that reinforced the RBA's hawkish stance. The first comprehensive monthly price release showed that price pressures remained high, with headline inflation accelerating to 3.8% in October, the fastest pace in seven months and exceeding expectations. Crucially, the RBA's preferred core price pressures gauge, trimmed mean inflation, rose to 3.3%, also exceeding expectations. Last month's unexpectedly strong quarterly inflation data and a still-tight labor market had already prompted the RBA to keep interest rates unchanged. Last week, Deputy Governor Hunt noted that the labor market was slightly above sustainable levels, with the unemployment rate declining and wage growth remaining high, supporting the central bank's cautious stance. The market is now pricing in only a 7% chance of a rate cut in May next year, down from 40% previously, and even sees a 40% chance of a rate hike by the end of 2026.
The Australian dollar traded around 0.6558 against the US dollar last week, hitting a near three-week high. Technical analysis on the daily chart shows that the pair has been trading within a sideways channel between 0.6436 and 0.6580 recently, reflecting a neutral bias. The 14-day Relative Strength Index (RSI) on the daily chart is around 56.86, indicating a continued tug-of-war between bulls and bears. On the other hand, the pair has broken above the 20-day simple moving average at 0.6504 and the psychological level of 0.6500, suggesting strengthening bullish momentum in the short term. The AUD/USD pair may target the monthly high of 0.6580, followed by the psychological level of 0.6600. A further break above this overlapping resistance zone would support the pair's exploration of the October 1st high near 0.6630. On the downside, the pair may find initial support at the 20-day simple moving average at 0.6504, coinciding with the psychological level of 0.6500. A break below this key support area would prompt the AUD/USD to test the 200-day simple moving average near 0.6463, consistent with the five-month low of 0.6414 recorded on August 21.
Consider going long on the AUD today near 0.6540; Stop loss: 0.6528; Target: 0.6585; 0.6600
GBP/USD
The GBP/USD pair rose for seven consecutive trading days last week, reaching as high as approximately $1.3268, its strongest level since October 29, as the market reassessed Chancellor Rachel Reeves' latest budget and her renewed commitment to fiscal discipline. It is currently trading near 1.3200. The GBP/USD strengthened as expectations of a December rate cut by the Federal Reserve intensified, with the dollar weakening. Reports that White House National Economic Council Director Kevin Hassett is a leading candidate for the next Federal Reserve Chair further solidified market expectations for further rate cuts. Traders also anticipate three more rate cuts by the end of 2026. As the pound strengthened, GBP/USD also rose, with traders reassessing Chancellor Rachel Reeves' latest budget and her renewed commitment to maintaining fiscal discipline. However, market sentiment fluctuated following the Bank of England's earlier forecasts from the Office for Budget Responsibility, which predicted weak economic growth but also revealed a larger-than-expected £22 billion fiscal buffer. Despite lingering concerns about fiscal tightening, the overall signal of improved public finances helped stabilize the currency.
GBP/USD has rebounded for seven trading days to a near one-month high of 1.3268 after forming a "small double bottom" at 1.3038 late this month, indicating a bullish trend for the pair, with positive oscillators on the daily chart showing positive signals. This level is likely to provide immediate support for spot prices now. Any further weakness is more likely to attract new buyers at the 1.3150 (9-day simple moving average) level and find fairly good support near the 1.3100 psychological level. However, a clear break below the latter would negate the positive bias and expose the "small double bottom" support at 1.3038. The pair could eventually fall to test the psychological level of 1.3000, or the lowest level since April reached earlier this month. On the other hand, the daily high around the 1.32668 area now appears to be an immediate hurdle; a break above this area could see the pair climb to the psychological level of 1.3300. A decisive break above this level would pave the way for further gains towards the 200-day simple moving average at 1.3312 and towards the 1.3400 level.
Consider going long on GBP/JPY today near 1.3228; Stop loss: 1.3214; Target: 1.3280; 1.3290

USD/JPY
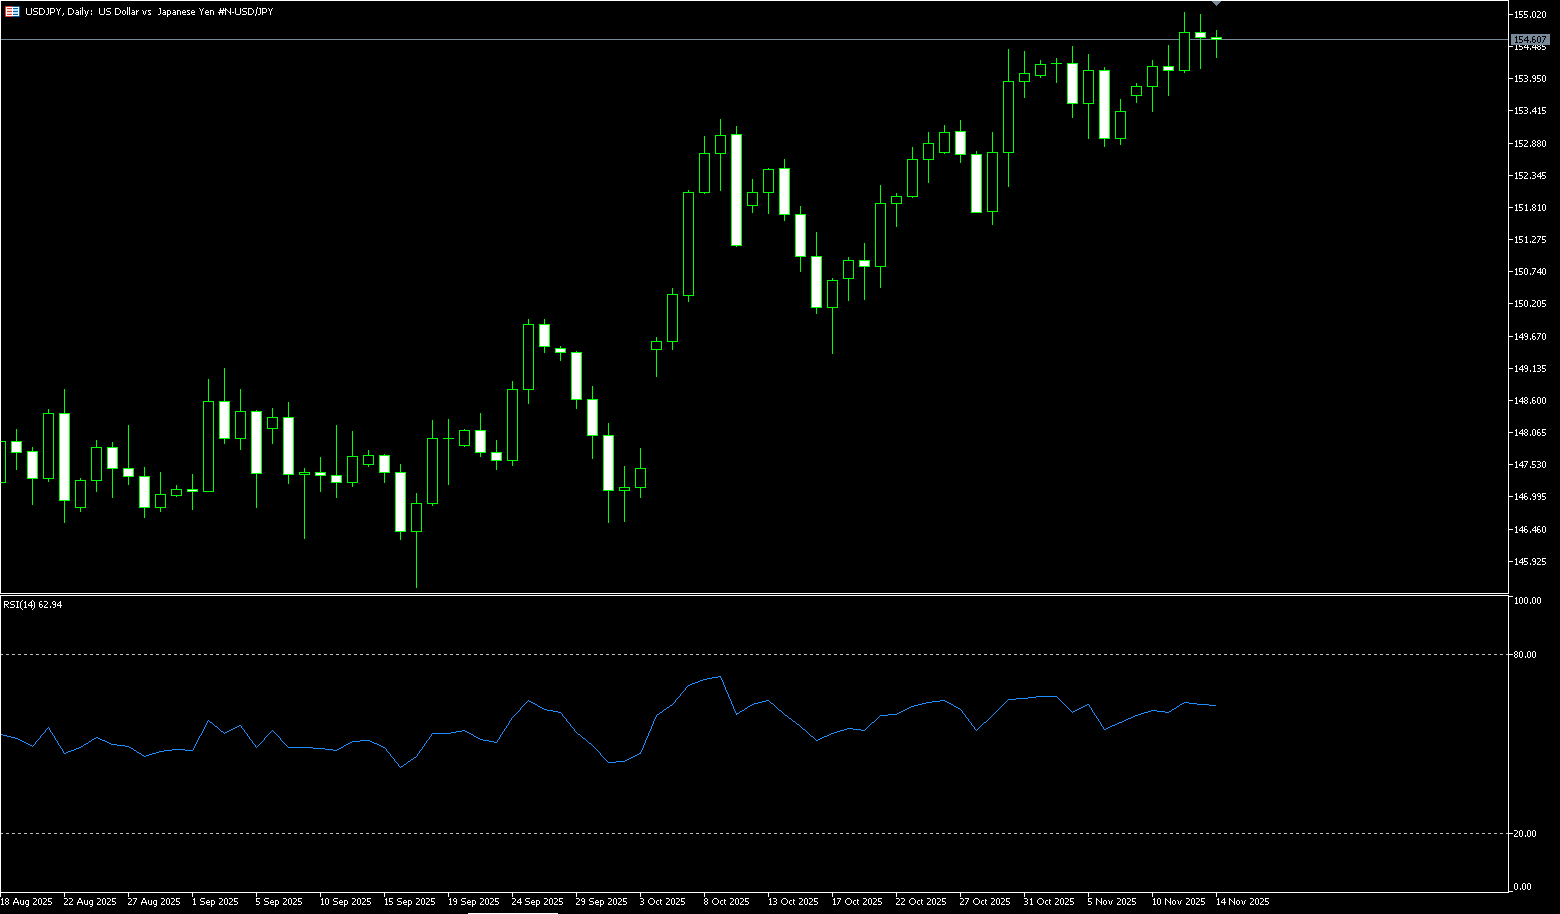
The yen remained stable around 156.00 yen per dollar last week and is on track for little change this week, supported by stronger-than-expected economic data. In the latter part of last week, the yen traded slightly negatively against a rebounding dollar, although any meaningful depreciation seemed unlikely. Investors were concerned about Japan's deteriorating fiscal situation due to the government's massive economic stimulus program, which led to a recent surge in Japanese government bond yields. In addition, optimistic market sentiment, supported by the prospect of lower US interest rates and hopes for a peace agreement between Russia and Ukraine, was a key factor weakening the safe-haven yen. October industrial production and retail sales both exceeded expectations, while the unemployment rate remained stable. Tokyo's core inflation also exceeded expectations, putting the Bank of Japan on track to raise interest rates in the coming months. Earlier last week, there was speculation that the central bank might raise rates next month, amid concerns about persistent inflation, a weak yen, and reduced political pressure to maintain low interest rates. However, the yen is expected to fall by more than 1% this month due to growing concerns about Japan's fiscal situation.
The daily chart shows that USD/JPY needs support above the 155.65 (last week's low) – 156.00 (psychological level) area to justify further gains. A subsequent rise could see USD/JPY reclaim the 157.00 level and climb further to the resistance level of 157.89 (highest since mid-January), moving towards the 158.00 area. A break above this level would target the 158.88 (highest point since the beginning of the year), and a break above this area could see the pair move towards the psychological level of 160.00. However, the 14-day RSI has fallen below overbought territory (currently at 60.65), limiting the bulls' willingness to push higher. The market may need to consolidate at higher levels or experience a moderate pullback to build momentum for the next move towards the psychological level of 160.00. On the other hand, the 155.20 (20-day simple moving average) and 155.00 (psychological level) areas may contain downside risk. Some follow-through selling could put USD/JPY at risk of testing 154.79 (25-day simple moving average). A break below this level would be seen as a new trigger for bearish traders and could set the stage for a week-long downtrend towards 154.33 (30-day simple moving average) and the 154.00 level.
Consider shorting USD today near 156.35; Stop loss: 156.55; Target: 155.40; 155.20
EUR/USD
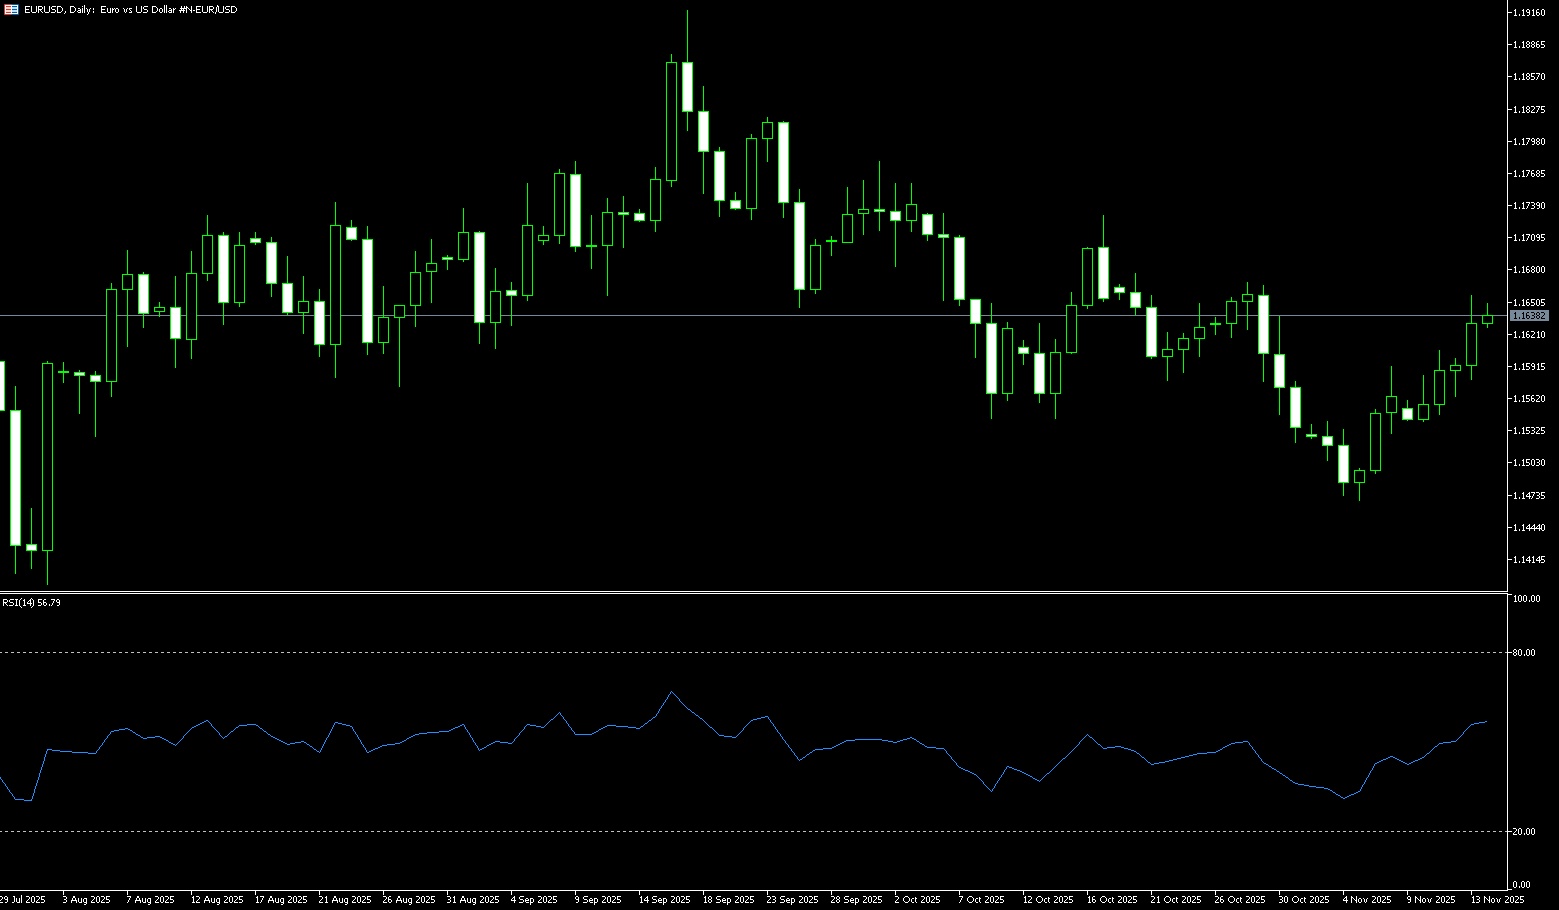
EUR/USD traded in a narrow range around 1.1600 for most of last week, but is poised for a nearly 0.72% gain this week as market expectations rise for further Fed rate cuts in December and the dollar weakens. German data was mixed. October retail sales fell short of expectations, while the import price index rose. However, the impact on the euro was minimal, as investors remained focused on the Federal Reserve's monetary policy plans. Trading activity remained subdued in the latter half of last week, with US markets operating at half speed due to disruptions on its currency platform caused by Thanksgiving celebrations and a malfunction in the CME Group's data center. On the other hand, investors anticipate multiple rate cuts by the Federal Reserve over the next 12 months, while most major central banks worldwide, including the European Central Bank, have already ended their easing cycles. The dollar recovered somewhat after a slight rebound in US Treasury yields, but the upward attempt failed. The dollar index is on track for its worst weekly performance since July.
The euro/dollar pair rebounded from last week's low near 1.1500, but was capped below last week's high of 1.1635 and the 1.1633 area (the 55-day simple moving average), and short-term momentum has lost. The 14-day Relative Strength Index (RSI) on the daily chart is trending downwards, although it remains above 50. Additionally, the Moving Average Convergence/Divergence (MACD) has crossed below the signal line, indicating weakening bullish momentum. Immediate support lies at the previous resistance levels of 1.1506 (the 180-day simple moving average) and the 1.1500 (psychological level) area. Further down, the November 5th low of 1.1468 will pose a challenge to the bears. Conversely, for a trend reversal to be confirmed, the bulls need to break above last week's high of 1.1635 and the 1.1633 (55-day simple moving average) area, and also take note of the October 28th high (near 1.1670). The next target is the 1.1700 level.
Consider trading the Euro around 1.1588 today; Stop loss: 1.1575; Target: 1.1640; 1.1650
Disclaimer: The information contained herein (1) is proprietary to BCR and/or its content providers; (2) may not be copied or distributed; (3) is not warranted to be accurate, complete or timely; and, (4) does not constitute advice or a recommendation by BCR or its content providers in respect of the investment in financial instruments. Neither BCR or its content providers are responsible for any damages or losses arising from any use of this information. Past performance is no guarantee of future results.
Lebih Liputan


Pendedahan Risiko:Instrumen derivatif diniagakan di luar bursa dengan margin, yang bermakna ia membawa tahap risiko yang tinggi dan terdapat kemungkinan anda boleh kehilangan seluruh pelaburan anda. Produk-produk ini tidak sesuai untuk semua pelabur. Pastikan anda memahami sepenuhnya risiko dan pertimbangkan dengan teliti keadaan kewangan dan pengalaman dagangan anda sebelum berdagang. Cari nasihat kewangan bebas jika perlu sebelum membuka akaun dengan BCR.
BCR Co Pty Ltd (No. Syarikat 1975046) ialah syarikat yang diperbadankan di bawah undang-undang British Virgin Islands, dengan pejabat berdaftar di Trident Chambers, Wickham’s Cay 1, Road Town, Tortola, British Virgin Islands, dan dilesenkan serta dikawal selia oleh Suruhanjaya Perkhidmatan Kewangan British Virgin Islands di bawah Lesen No. SIBA/L/19/1122.
Open Bridge Limited (No. Syarikat 16701394) ialah syarikat yang diperbadankan di bawah Akta Syarikat 2006 dan berdaftar di England dan Wales, dengan alamat berdaftar di Kemp House, 160 City Road, London, City Road, London, England, EC1V 2NX. Entiti ini bertindak semata-mata sebagai pemproses pembayaran dan tidak menyediakan sebarang perkhidmatan perdagangan atau pelaburan.

 English
 简体中文
简体中文
 繁體中文
繁體中文
 Bahasa
Melayu
Bahasa
Melayu
 Tiếng
Việt
Tiếng
Việt
 ไทย
ไทย
 日本語
日本語
 한국어
한국어
 ភាសាខ្មែរ
 español