


0
US Dollar Index
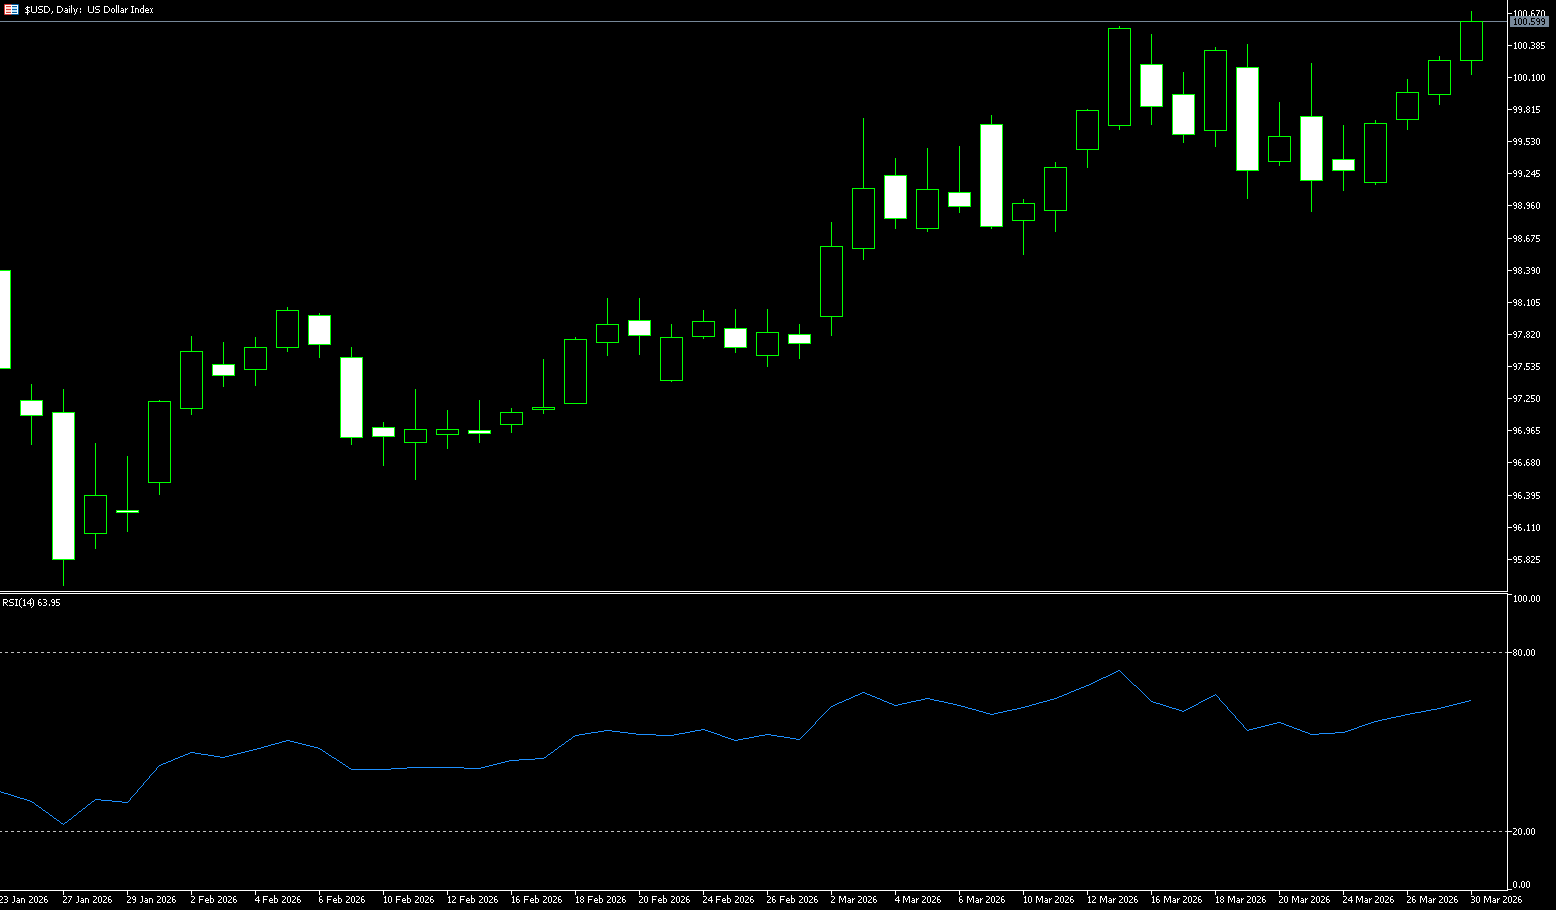
The US dollar index rose last week, posting its biggest monthly gain in nearly a year, driven by safe-haven demand. Escalating tensions in the Middle East and fading hopes for de-escalation, along with rising market expectations of a US interest rate hike this year, also supported the dollar. Regarding market sentiment, Iran is expected to counter the US ceasefire proposal last Friday. US Secretary of State Rubio stated that the war is expected to last weeks rather than months and will not require ground troops, but the Iranian Revolutionary Guard reiterated its ban on all ships associated with US and Israeli allies passing through the Strait of Hormuz. The dollar index rose above 100, gaining 2.57% so far in March, on track for its best monthly performance since July 2025. The yen came under significant pressure, falling 0.34% against the dollar to 160.35 yen, breaking below the 160 level for the first time since July 2024, increasing the likelihood of Japanese intervention in the foreign exchange market. The yen has fallen 2.74% this month; Japan's high dependence on imported energy makes it more vulnerable to price increases than many major economies.
The US dollar index fluctuated slightly higher, maintaining above the psychological level of 100 during the session. Although the cumulative increase over several days was limited, the overall increase in March was nearly 2%, the strongest monthly performance in the past eight months. The Iranian government continued to deny substantive progress in negotiations, and concerns about the long-term geopolitical conflict remained. Safe-haven funds continued to flow into the US dollar, while high oil prices pushed up inflation expectations. These two factors jointly supported the resilience of the US dollar. The short-term 5/10/20-day moving averages showed a clear bullish arrangement, and the index stood firmly above 99.80, indicating that the short-term trend was still strong. The medium- and long-term 50/200-day moving averages maintained a good golden cross, supporting the US dollar index to continue testing the 100 level. RSI (14) and MACD: The RSI is currently around 60-65, which is strong but has not yet entered the overbought extreme zone. The MACD histogram continues to expand, and the momentum indicator still supports the bulls. It is necessary to be wary that if the RSI quickly falls back below 60, there may be short-term profit-taking. Key levels and patterns: Intraday resistance levels to watch are 100.54 (March 13 high) and the 101 (psychological level). Support levels are 99.63 (9-day moving average) and 99.00 (psychological level).
Consider shorting the US Dollar Index at 100.60 today, with a stop-loss at 100.75 and targets at 100.10 and 100.00.
WTI Crude Oil
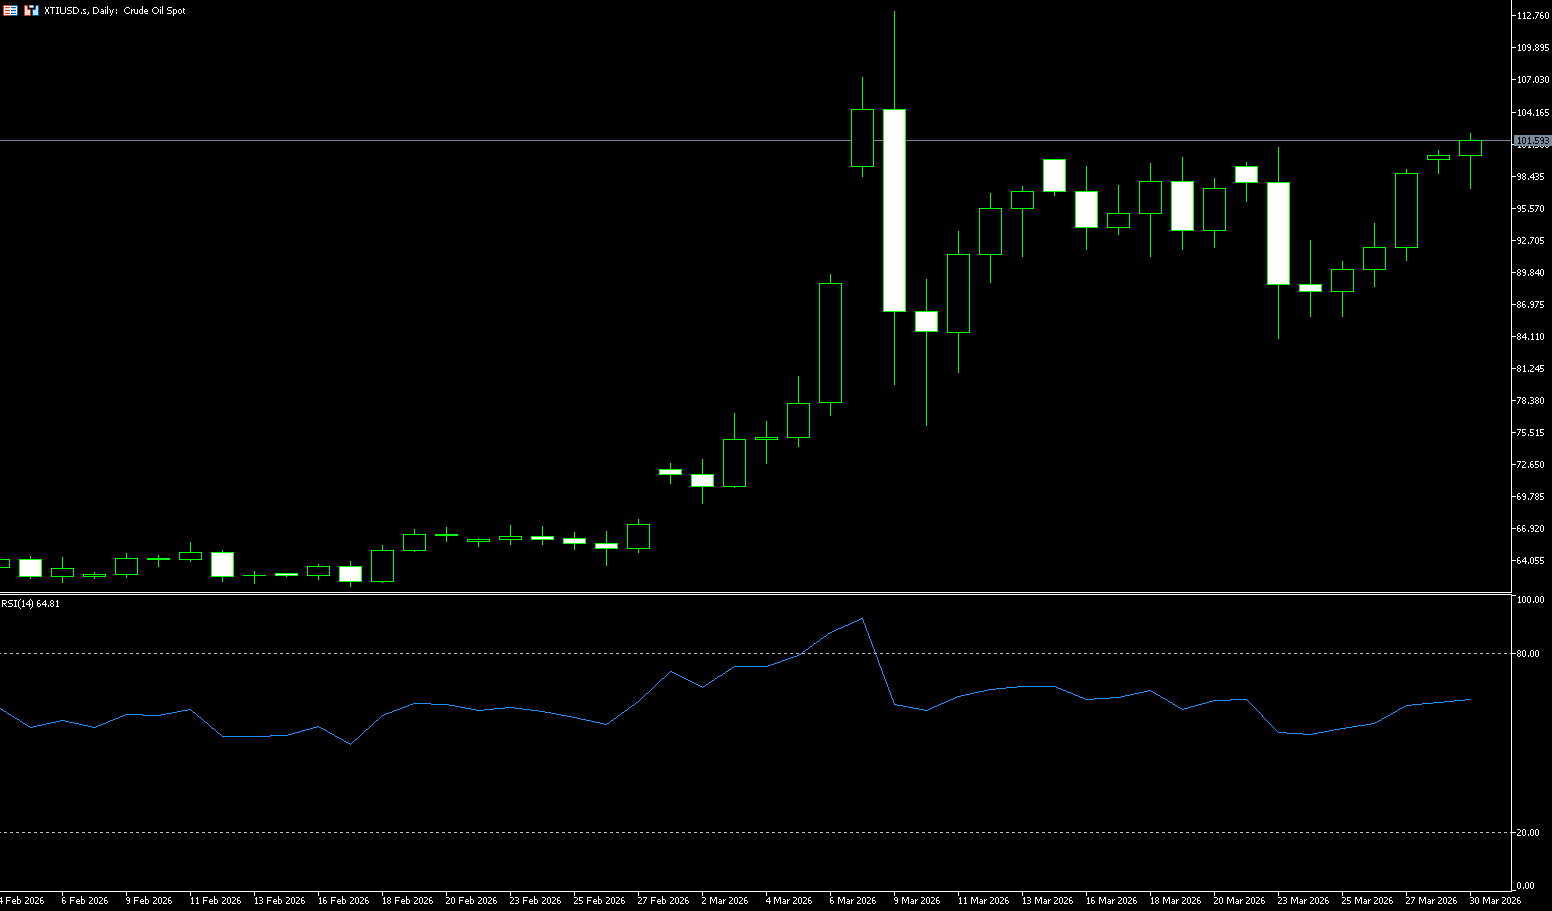
Oil prices rose on Friday, posting a weekly gain, as traders remained skeptical about the prospects of a ceasefire in the Iranian war. Brent crude futures closed up 4.2% at $112.57 a barrel, while WTI crude futures closed up 5.5% at $99.64 a barrel. This morning in Asian trading, WTI spot crude climbed back above the $100 mark, initially trading at $100.50. Traders were cautious about Trump's comments on negotiations with Iran. One Iranian official called the US proposal "unilateral and unfair," while another senior official said that the US calling for negotiations while simultaneously attacking Iran was "unacceptable." Tehran has not yet decided whether to respond. Investors are focused on the protracted nature of the war rather than headlines; a prolonged blockade of the Strait of Hormuz or damage to infrastructure will maintain a significant risk premium in prices. The oil market will be immune to Trump's conciliatory rhetoric, especially given his intention to send an additional 10,000 troops. If the war begins to subside quickly, oil prices will fall rapidly but will remain above pre-war levels; if the war continues until the end of June, oil prices could rise to $200. Furthermore, Russian oil producers have warned buyers that they may declare force majeure on supplies from major Baltic ports due to Ukraine's attacks on Russian energy infrastructure.
Although WTI crude oil experienced a brief pullback during the week due to tariff comments and rumors of diplomatic contacts, Brent and WTI crude still recorded weekly gains of over 0.3% and 1% respectively. The price center of gravity has slowly shifted upward amid fluctuations, reflecting the extreme vulnerability of short sellers in the face of a significant supply gap. International oil prices are currently in a transitional phase from "panic-driven" to "logic reshaping." Technically, WTI crude oil is currently above $100/barrel, having reached a high of $113.28 this year. Although it has recently retreated, the extreme widening of the Bollinger Bands indicates that volatility will remain high. While the MACD indicator shows a contraction in the red bars, indicating a slowdown in short-term upward momentum, this is more of a technical correction based on the previous overbought condition. This week, the market's attention will be focused on the psychological and technical level of $100. If US oil can effectively hold above triple digits, the next targets are $113.28 and $120.00 (a psychological level). On the downside, watch the $98.59 (Monday's low) and the $94.38 (9-day moving average) area.
Today, consider going long on spot crude oil at $101.80, stop loss: $101.60; target: $105.00; $104.00
Spot Gold
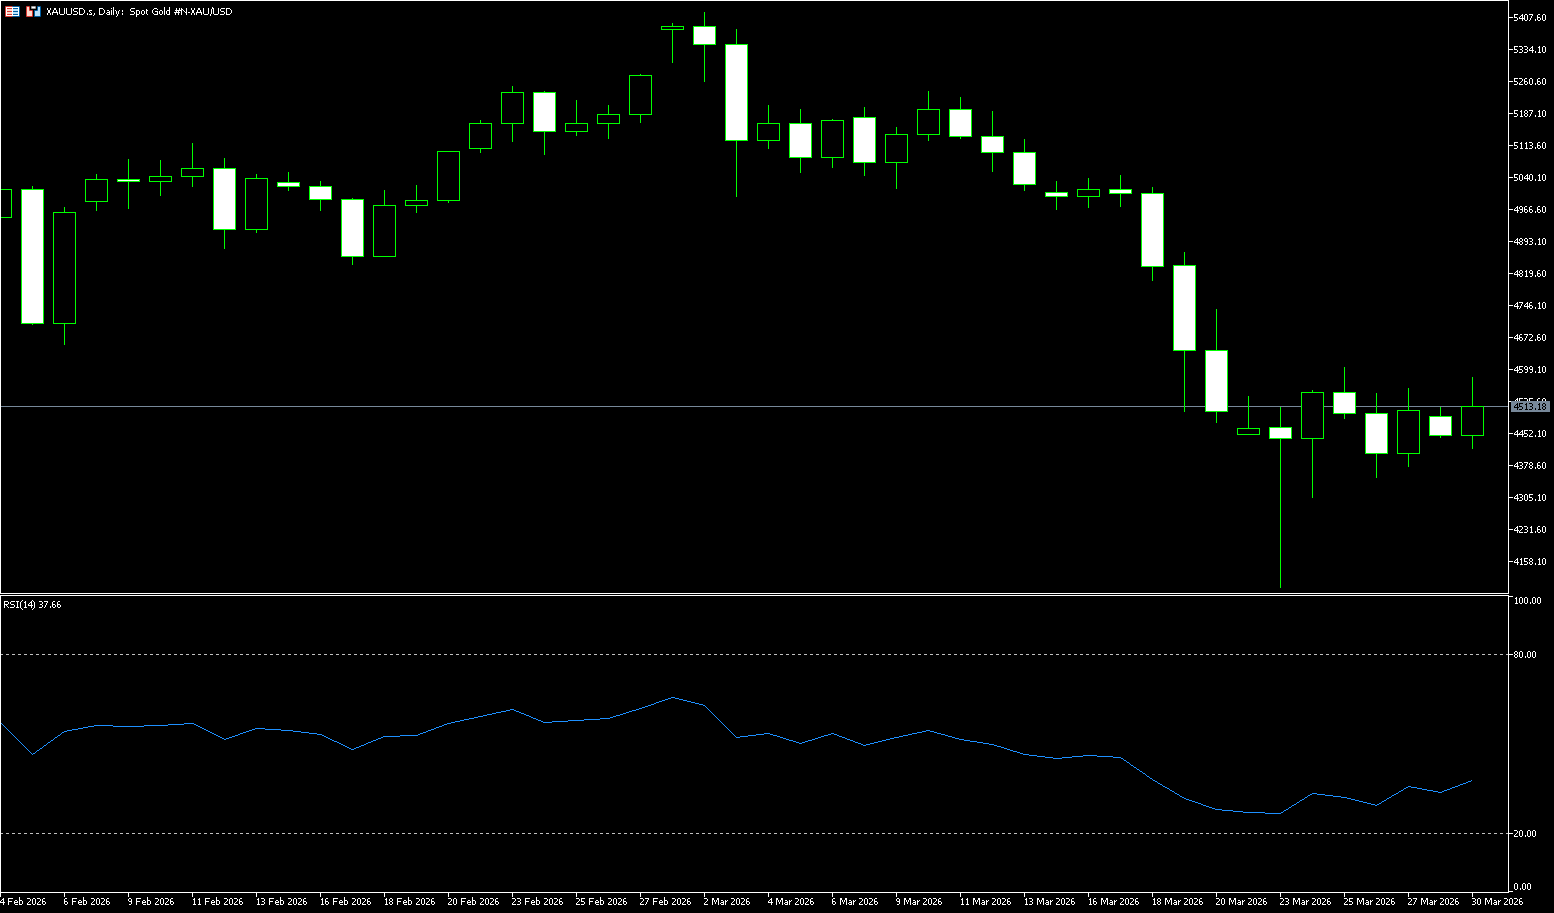
On Monday morning in Asian trading, spot gold traded around $4,500 per ounce. Although gold prices rose on Friday due to bargain hunting, the renewed tensions in the Middle East over the weekend, coupled with the Houthi rebels joining the attack on Israel, increased uncertainty and the market has completely ruled out the possibility of a US interest rate cut in 2026. On Saturday (March 28), the latest positioning data showed that as of the week ending March 24, net long positions in gold decreased significantly, with funds shifting from precious metals to agricultural products. Data shows that gold speculators significantly reduced their bullish sentiment, with COMEX gold net long positions decreasing by 13,144 contracts to 92,775 contracts. This suggests that short-term safe-haven buying is retreating. Meanwhile, This largely reflects a phase of profit-taking. With the dollar holding structure relatively stable, the attractiveness of gold, a non-interest-bearing asset, has temporarily given way to assets with stronger fundamental drivers in terms of holding logic.
The escalating conflict in the Middle East—from the Houthi "joining the war" and the increase in US troops to the increased frequency of Tehran airstrikes and shipping threats—is continuously pushing up global uncertainty. In the short term, gold prices may maintain a high-level consolidation pattern, depending on the progress of ceasefire negotiations, the duration of the war, and the Fed's policy signals. From a technical analysis perspective, although gold's intraday volatility is high, the overall bearish structure has not yet been broken. Gold is currently in a "momentum-lacking" rebound. Gold is still being suppressed by the combined resistance of the 9-day (4522) and 20-day (4838) simple moving averages, while stronger resistance lies at the $5,000 psychological level. The low of $4,098 reached last Monday is currently the most important psychological defense line. If the US-Iran conflict escalates beyond expectations, leading to further out-of-control inflation data, the support at this level will face a severe test. Before that, First, focus on the April 2nd low of $4,402. Further downside targets the lower Bollinger Band (approximately $4,232), a key medium- to long-term support level.
Today, consider going long on spot gold at $4,506, with a stop-loss at $4,500 and a target of $4,560. 4,550
AUD/USD
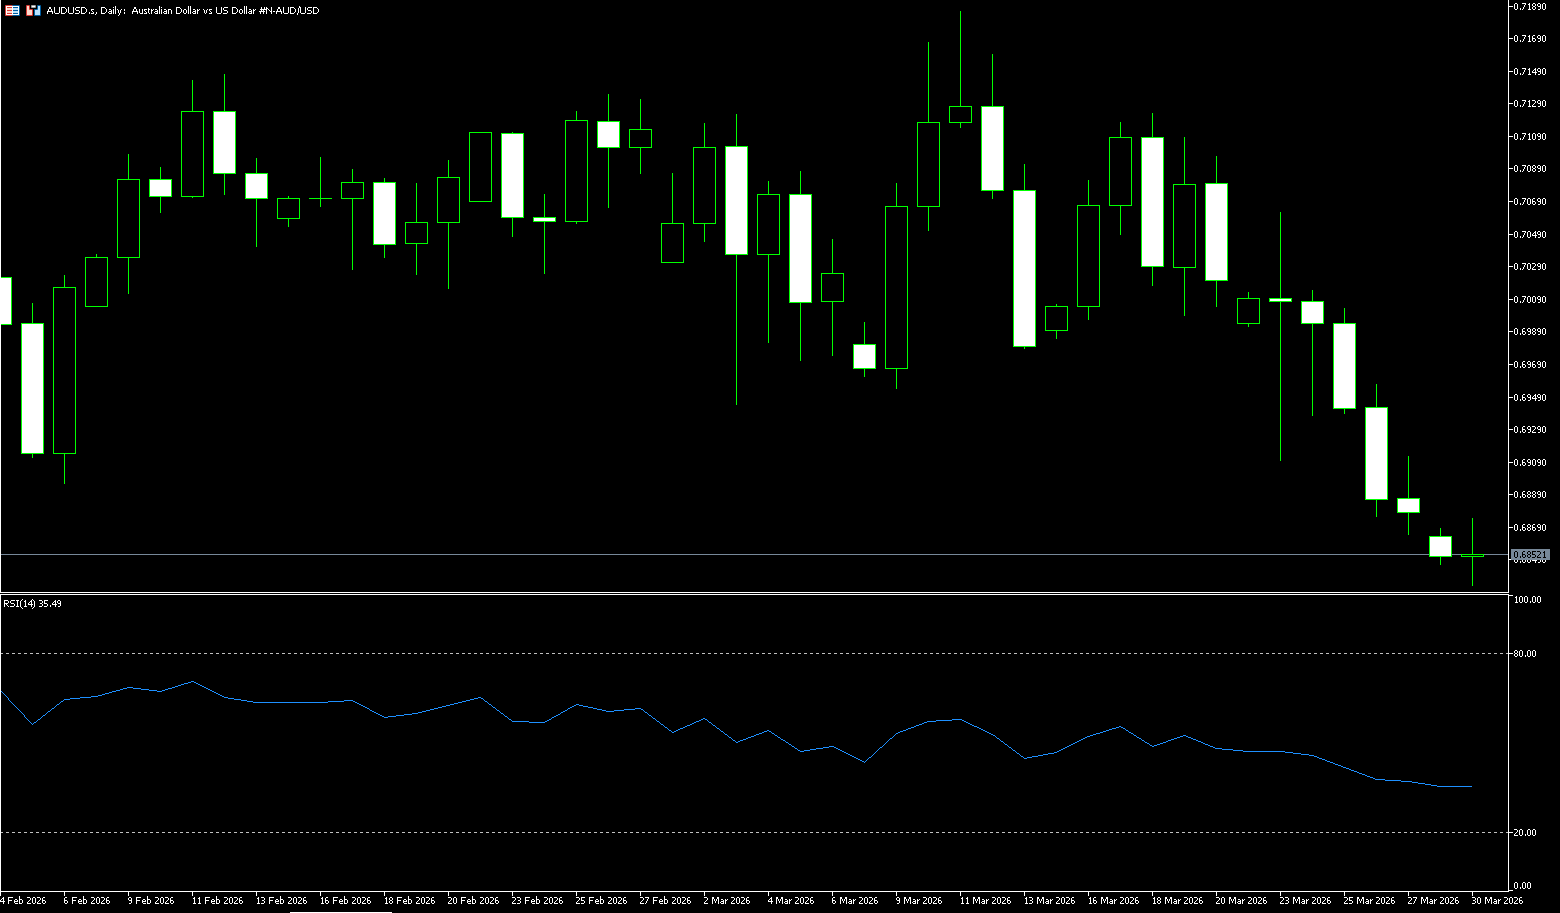
The Australian dollar depreciated to around US$0.6850, hitting a two-month low, as concerns about an energy shock from the Middle East conflict weighed on global economic growth prospects and dampened demand for commodities. Support for relatively high Australian interest rates began to weaken as markets increasingly anticipated further policy tightening in other major economies, narrowing the yield advantage. Meanwhile, a sharp rise in petrol prices is expected to push up domestic inflation while squeezing household spending. Economists warned that inflation could accelerate further, with the overall consumer price index potentially rising to 4.5% soon, and even approaching 5% in the second quarter if energy costs remain high. Earlier, Reserve Bank of Australia Assistant Governor Christopher Kent warned that a prolonged Gulf conflict could put pressure on economic growth, although they remain focused on keeping inflation expectations stable. Markets currently imply a 68% probability of a rate hike in May, with rates expected to reach 4.75% by the end of the year.
From a technical perspective, the outlook for AUD/USD turned bearish after breaking below the psychological level of 0.7000, a level closely coinciding with the 50-day simple moving average at 0.7017. The Relative Strength Index (RSI) fell back to around 36 on the 14th, indicating weakening momentum but not yet entering oversold territory, suggesting further downside potential. The Moving Average Convergence/Divergence (MACD) indicator remains below the signal line, with the negative range deepening and the negative histogram slightly expanding, reinforcing the short-term bearish tone. On the downside, recent support lies at the 100-day simple moving average around 0.6819. A daily close below this level could expose the next bearish target, the psychological level of 0.6700, a previous breakout area that may limit further declines. On the upside, the 0.6900 area is now recent resistance, having previously been a key support level. A sustained break above the psychological level of 0.7000 would help alleviate bearish pressure and signal a continuation of the uptrend.
Consider going long on the Australian dollar today at 0.6840, with a stop-loss at 0.6830 and a target of 0.6910. 0.6920
GBP/USD
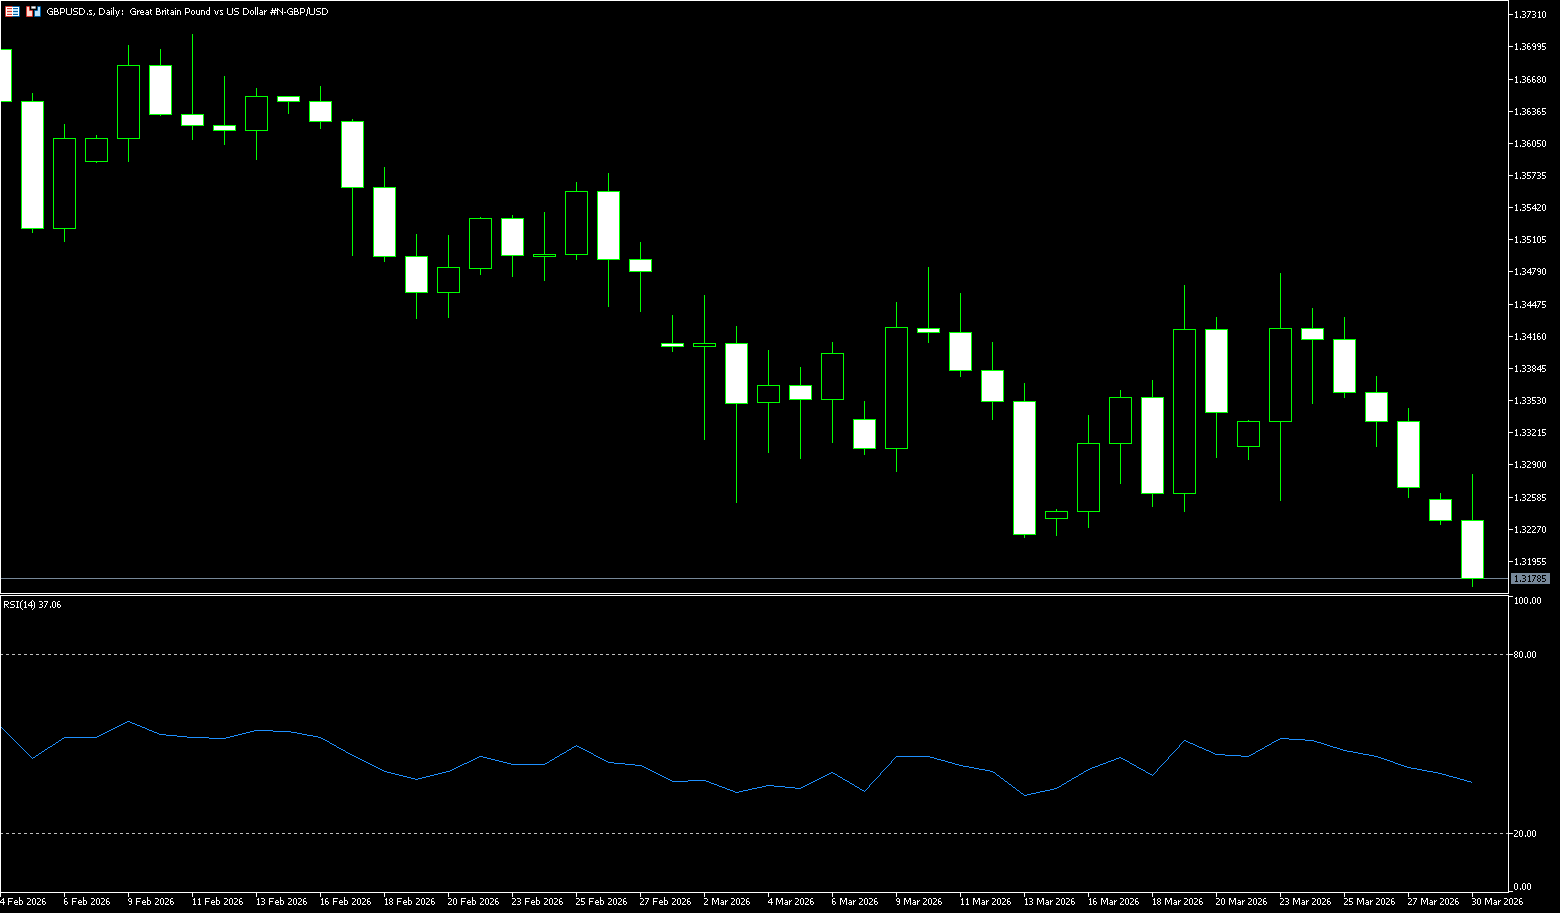
The pound fell below 1.3200 against the dollar in early trading this week, its lowest level in nearly two weeks. Market concerns about a potential US ground invasion of Iran put downward pressure on the pound/dollar, dampening demand for risk assets. The dollar index, which tracks the dollar against six major currencies, rose for the fifth consecutive session on Monday, reaching near 100.55. Further escalation of tensions in the Middle East pushed oil prices higher, negatively impacting the currencies of economies reliant on oil imports for energy needs, such as the UK. On the macro front, the main factor influencing the pound/dollar's movement this week will be the release of key US economic data, including several labor market-related indicators, particularly non-farm payrolls and the ISM Purchasing Managers' Index, which will influence market expectations regarding the Federal Reserve's monetary policy outlook.
On the daily chart, the pound/dollar is slightly bearish in the short term, as the spot price remains below the flattening 9-day simple moving average {1.3343} and trading below the Bollinger Band middle line {1.3354}, keeping price action in the lower half of the trading range. The 14-day Relative Strength Index (RSI) is around 40, reinforcing the loss of bullish momentum rather than obvious selling pressure, indicating that sellers still have the upper hand, but the decline is showing a restrained rather than impulsive movement. Near-term support lies near the recent low of 1.3179 from December 1st of last year. A break below this area would expose the next downside targets around 1.3100 (the psychological level) and 1.3080 (the low from November 24th of last year). Initial resistance is at the 1.3300 level, paving the way for a further challenge below the 9-day simple moving average (1.3343) and trading around the Bollinger Bands (1.3354) and 1.3560.
Consider going long on GBP today at 1.3170, with a stop loss at 1.3160 and a target of 1.3250. 1.3240
USD/JPY
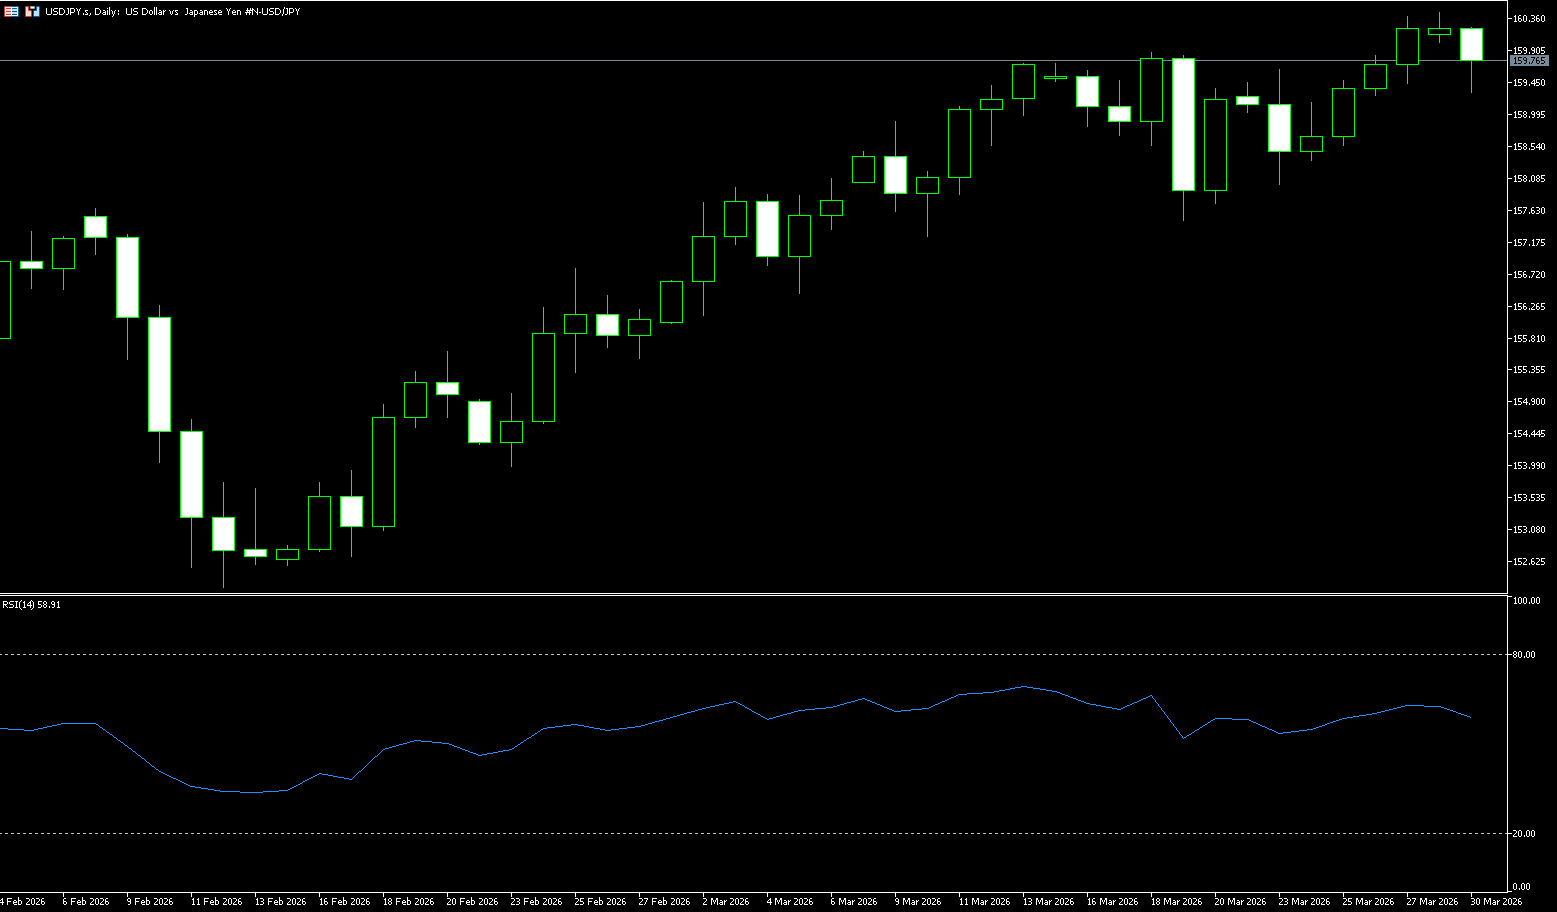
The yen strengthened above 160 against the dollar on Monday, reversing earlier losses, as the country's chief monetary official intensified verbal warnings of currency depreciation. Atsushi Mimura, the vice finance minister for international affairs, told reporters that markets were concerned about growing speculation in the crude oil futures and foreign exchange markets. He added that the government would take decisive action if necessary. His comments came after the yen broke through the key level of 160 against the dollar, a level Tokyo had previously intervened in during July 2024. The yen has been pressured by soaring oil prices linked to the Middle East conflict, as higher import costs threaten Japan's economic recovery. The war with Iran shows no signs of abating, with the Iranian-backed Houthi rebels joining the conflict in Yemen, and more U.S. troops arriving in the region.
The yen hovered near the key psychological level of 160 against the dollar, a crucial threshold for authorities' multiple interventions in the foreign exchange market in 2024. Against the backdrop of a recent rebound from the key 50-day simple moving average (156.60), a sustained hold above the 160.00 level would be seen as a new trigger for bullish traders. The 14-day Relative Strength Index (RSI) hovers around 60, remaining in bullish territory and not overbought, indicating continued buying pressure but a reduced urgency to extend the rally. However, the MACD line is flattening above the zero line, only slightly above its signal line, suggesting weakening momentum but still positive. Therefore, the next target is the next significant resistance around 160.50, followed by a challenge of the psychological level of 161.00. Initial support lies at 159.23 (the 9-day simple moving average), followed by the stronger demand zone around 157.70, the previous breakout area.
Consider shorting the US dollar at 159.90 today. Stop Loss: 160.00; Target: 158.60; 158.50
EUR/USD
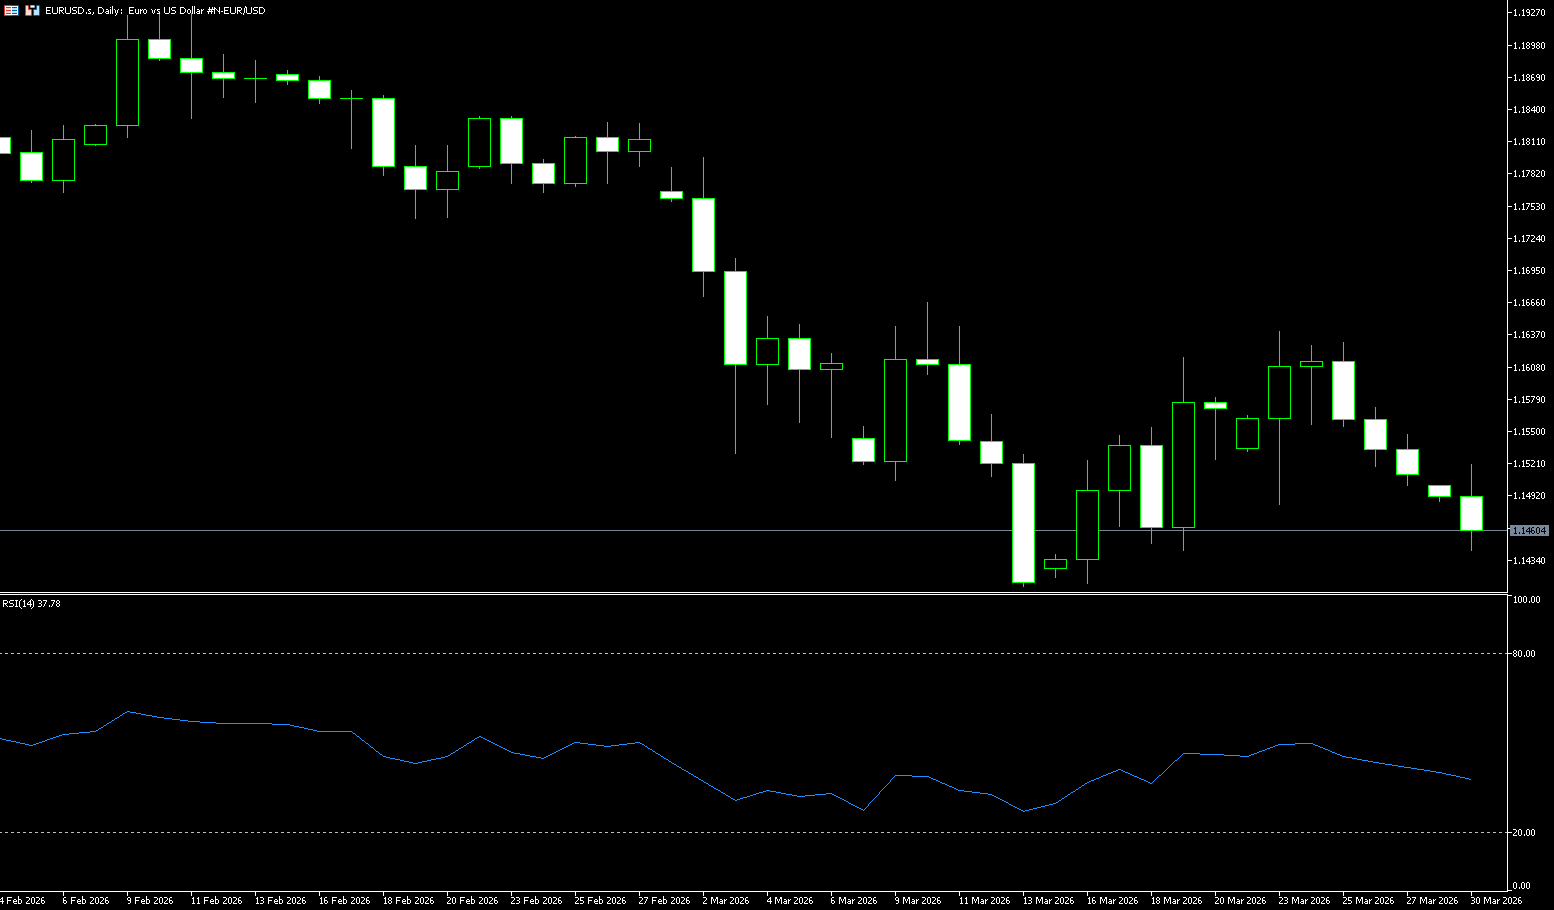
The euro/dollar pair fell for the fifth consecutive trading day on Monday, dropping to near 1.1458. Market sentiment turned risk-averse after Iranian Brigadier General Ibrahim Zolfarkari issued a strong warning on Iranian state television, stating that US ground troops would become "delicious food for the sharks of the Persian Gulf," putting pressure on the major currency pair. Meanwhile, the dollar index, which tracks the dollar against six major currencies, rose to near 100.55. On Thursday, the Wall Street Journal reported that the Pentagon plans to send an additional 10,000 troops to Iran despite President Donald Trump's claims of negotiations with Tehran. On the macro front, investors will be closely watching inflation data, as it will influence market expectations regarding the outlook for the European Central Bank's monetary policy. The impact on eurozone interest rate expectations will be significant, as it reflects the effects of rising energy prices caused by the Middle East conflict.
From a technical perspective, the euro/dollar pair presents a bearish pattern. The daily chart shows that the pair failed to hold above the bearish 20-day simple moving average (1.1560) and the psychological level of 1.1600, which is firmly trending downwards. The 100-day and 200-day SMAs are converging and showing no clear direction. Meanwhile, momentum indicators have regained downward momentum after testing the midline, remaining firmly in negative territory. The 14-day Relative Strength Index (RSI) is holding steady around 40, failing to provide a clear directional signal but reinforcing the dominant bearish tone. Support is seen at 1.1470, a long-term static support zone, followed by the 2026 low of 1.1411. A break below the latter would confirm the long-term downside bias and expose the 1.1400 psychological level.
Consider going long on EUR/USD at 1.1450 today. Stop loss: 1.1440; Target: 1.1500; 1.1520
Disclaimer: The information contained herein (1) is proprietary to BCR and/or its content providers; (2) may not be copied or distributed; (3) is not warranted to be accurate, complete or timely; and, (4) does not constitute advice or a recommendation by BCR or its content providers in respect of the investment in financial instruments. Neither BCR or its content providers are responsible for any damages or losses arising from any use of this information. Past performance is no guarantee of future results.
More Coverage


Risk Disclosure:Derivatives are traded over-the-counter on margin, which means they carry a high level of risk and there is a possibility you could lose all of your investment. These products are not suitable for all investors. Please ensure you fully understand the risks and carefully consider your financial situation and trading experience before trading. Seek independent financial advice if necessary before opening an account with BCR.
BCR Co Pty Ltd (Company No. 1975046) is a company incorporated under the laws of the British Virgin Islands, with its registered office at Trident Chambers, Wickham’s Cay 1, Road Town, Tortola, British Virgin Islands, and is licensed and regulated by the British Virgin Islands Financial Services Commission under License No. SIBA/L/19/1122.
Open Bridge Limited (Company No. 16701394) is a company incorporated under the Companies Act 2006 and registered in England and Wales, with its registered address at Kemp House, 160 City Road, London, City Road, London, England, EC1V 2NX. This entity acts solely as a payment processor and does not provide any trading or investment services.

 English
 简体中文
简体中文
 繁體中文
繁體中文
 Bahasa
Melayu
Bahasa
Melayu
 Tiếng
Việt
Tiếng
Việt
 ไทย
ไทย
 日本語
日本語
 한국어
한국어
 ភាសាខ្មែរ
 español


