


0
Currency & Commodity Analysis:
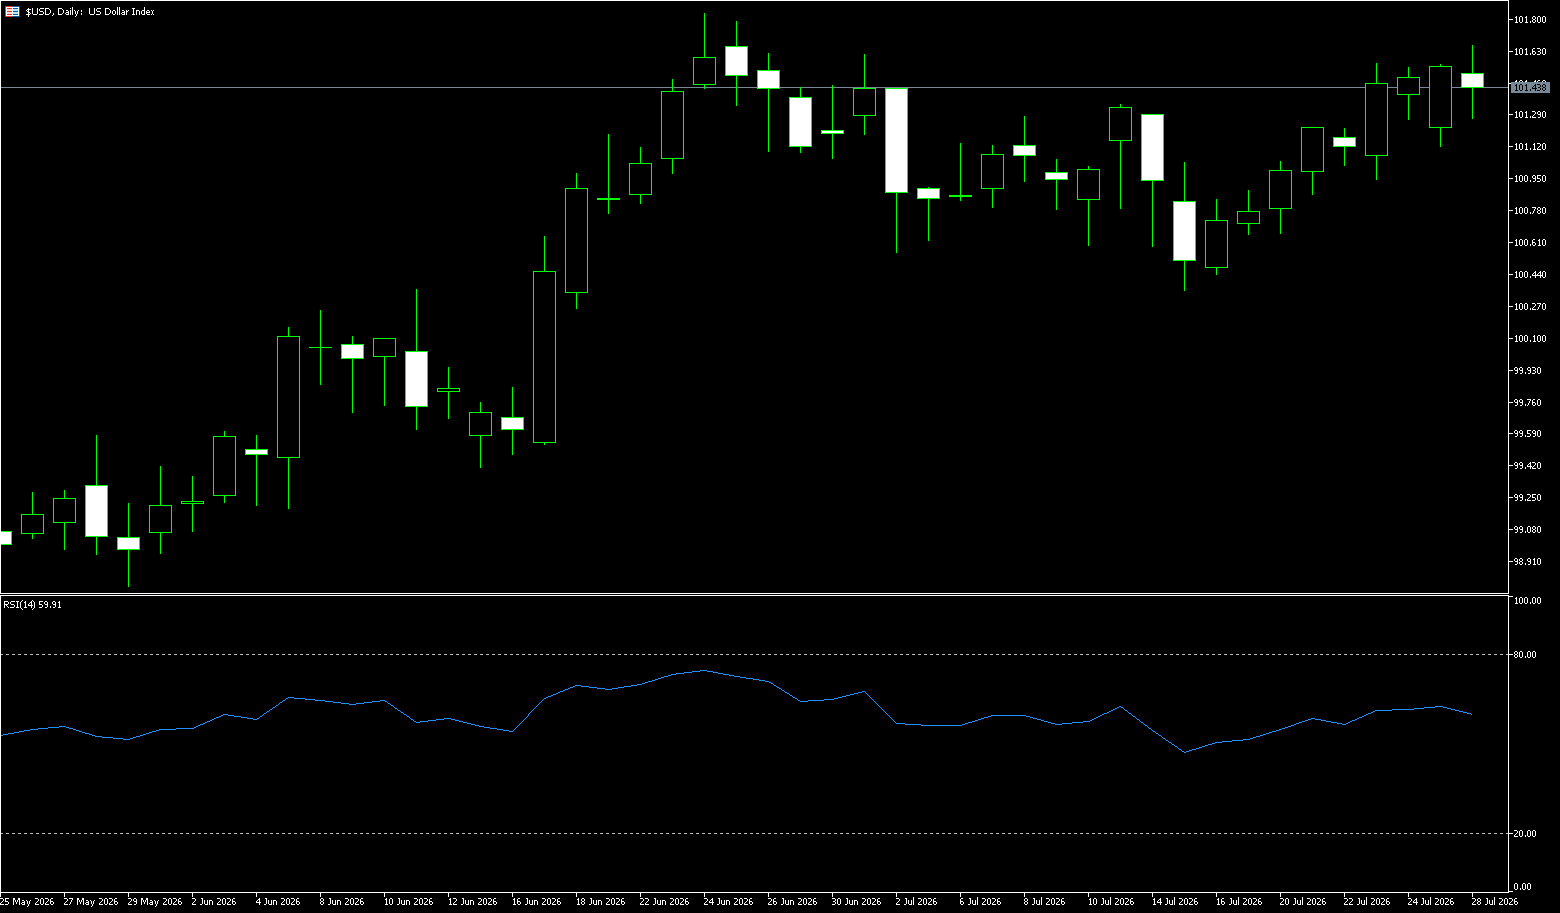
US Dollar Index
The US dollar index fell to 101.40 on Tuesday, after testing a 15-month high of 101.6 in the previous trading session, as weaker energy prices limited the Fed's rate hike prospects this year. US officials emphasized that a diplomatic solution to the war with Iran is still possible, pushing fuel prices down from local highs and reducing the risk of a rebound in energy inflation. However, fuel prices remain at historically high levels due to persistently low exports from the Middle East. Some Federal Open Market Committee members recently indicated that higher inflation and strong labor market evidence may necessitate higher interest rates. The Fed is expected to keep policy rates unchanged tomorrow, but interest rate futures still reflect a consensus on a rate hike this year. While political volatility in the UK has sustained the recent appreciation of the pound, the dollar's recent gains against the euro and yen have persisted.
The daily chart shows the dollar index remaining above 101.13 (the 25-day moving average), indicating that the corrective structure that started from nearby has not been broken, but the 101.54 to 101.66 area presents significant and dense resistance. In the MACD indicator, although the fast and slow lines remain slightly positive, the gap is extremely narrow, suggesting that upward momentum is approaching a critical point. This pattern is closer to high-level equilibrium than trend acceleration. Structurally, 101.13 (the 25-day moving average) is also an important reference area for the recent rebound slope. If the US dollar index continues to hold above this level, the market is still pricing in an inflation and policy tightening premium. A return to 101.13 (the 25-day moving average) and 100.00 (a psychological level) would be crucial, with 100.56 becoming a key area to gauge whether this rebound has ended. On the upside, watch the June high of 101.80 and the 102.00 (psychological level); a break above these levels would indicate the market is accepting a higher interest rate path again.
Today, consider shorting the US dollar index at 101.50, with a stop-loss at 101.60 and targets at 101.10 and 101.20.
WTI Crude Oil
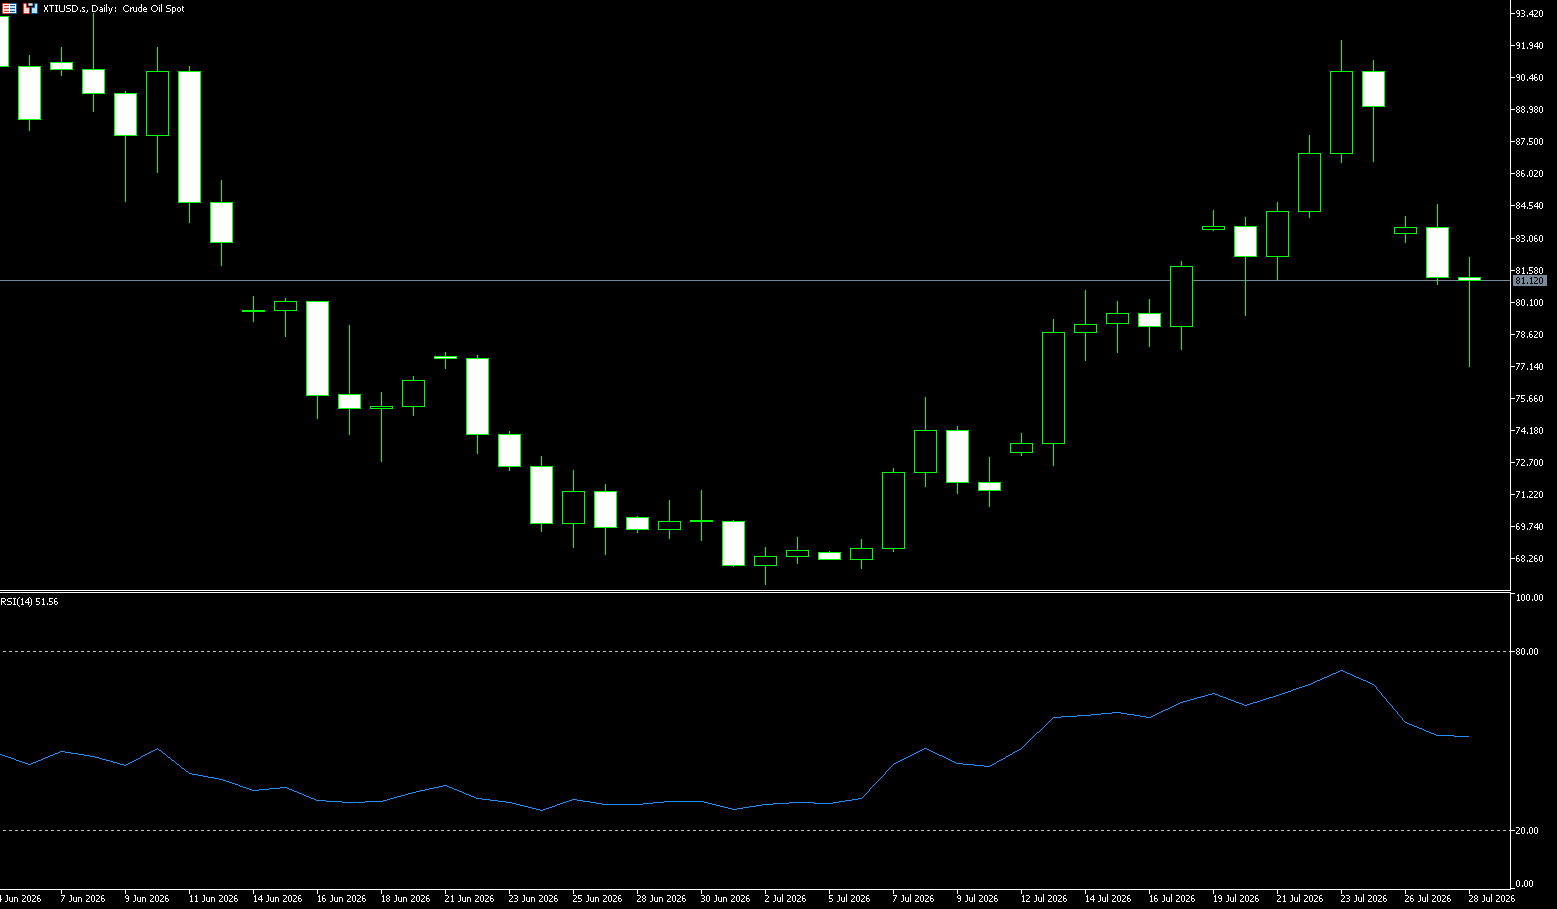
On Tuesday, crude oil prices fell below about $79 a barrel, hitting their lowest level in more than a week, as renewed diplomatic efforts in the Strait of Hormuz improved the outlook for Middle Eastern oil supplies. Iranian Foreign Minister Abbas Araqchi held separate talks with the foreign ministers of Saudi Arabia and Oman, focusing on restoring security to the strategic waterway after disruptions caused by the conflict between the United States and Iran. Oman has proposed establishing a joint regional mechanism to manage the strait, allowing Iran to collect voluntary transit fees; this plan has reportedly received support from Gulf states. Furthermore, President Trump stated that negotiations between Washington and Tehran are "progressing well," although he warned that military strikes could resume if diplomacy fails, and Iran has threatened retaliation. Despite diplomatic progress, regional risks remain high following Saudi Arabia's interception of drones targeting oil facilities and the Houthi rebels' claim to have attacked the Kingdom's East-West pipeline in Yemen.
In the short term, if the situation in the Red Sea continues to deteriorate and Saudi Arabia's alternative export routes are further hampered, oil prices could retest $100/barrel or even higher. Conversely, if a substantial breakthrough is achieved in US-Iran diplomacy, the geopolitical risk premium could be quickly reversed—but given the current situation, the former is more likely to dominate the market narrative than the latter. For traders, the bullish logic for crude oil remains, but the magnitude and speed of volatility will far exceed normal levels. Technically, WTI crude oil retreated from its highs, breaking through the key levels of $83.88 (9-day moving average) and $80.00 (psychological level), finding support near $77.73 (20-day moving average). A break below this level would test the $75.00 mark. Initial resistance is currently at $80.00 (psychological level) and $83.88 (9-day moving average).
Today, consider going long on crude oil at $78.15, with a stop-loss at $78.00 and targets of $80.00 and $81.00.
Spot Gold
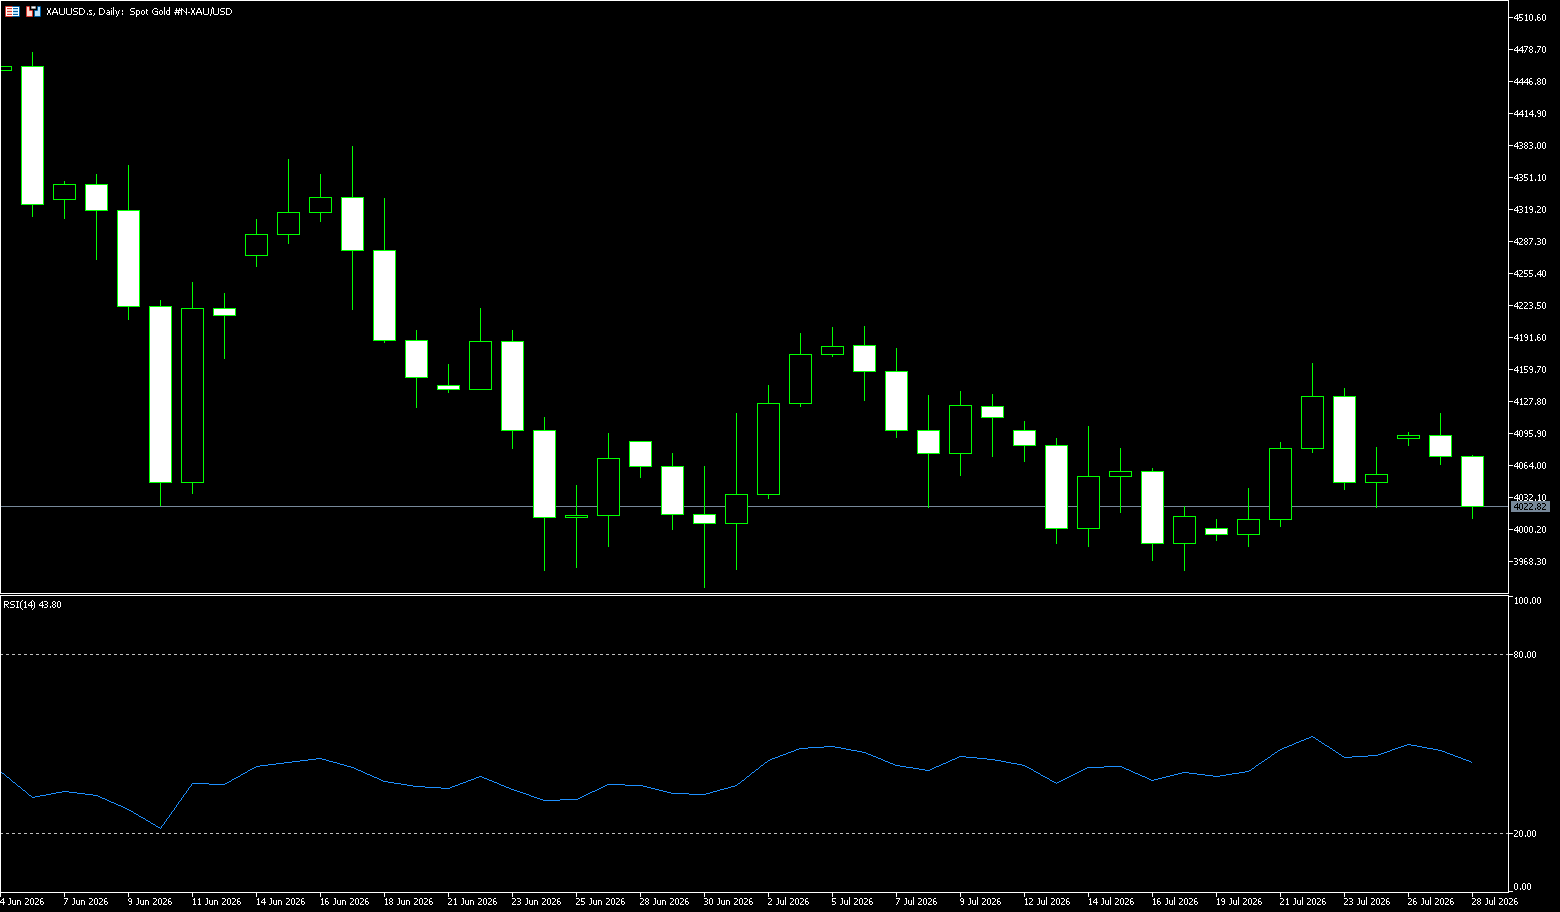
Gold fell to around $4,025 per ounce on Tuesday, erasing gains from the previous session, as concerns persisted about a potential Fed rate hike this week. The market currently expects a greater than one-third probability of a Fed rate hike on Wednesday, indicating unusually high uncertainty so close to the Fed meeting, unlike in recent years. Citadel Securities also stated that it expects the Federal Reserve to raise interest rates this week to bolster Chairman Kevin Warsh's credibility in combating inflation, following repeated promises from central bank governors to restore price stability. Despite President Trump's statements that the US is engaging in "good negotiations" with Iran to end the Middle East conflict, pushing down oil prices and easing concerns about inflation and interest rate hikes, gold remains under pressure. However, Trump warned that the US is prepared to resume strikes against Iran if negotiations fail.
From a technical perspective, gold has fallen more than 27% since its all-time high of $5,596 in February 2026. Gold prices repeatedly broke below the $4,000 mark in July, but were quickly recovered each time. The $4,000 level has become a significant psychological and technical support level. Gold ETF flows also reflect market hesitation. After experiencing continuous net outflows, the outflow trend of the SPDR Gold ETF slowed significantly in July, even showing net inflows in some weeks. This indicates that bargain hunters have begun to gradually position themselves around $4,000. Therefore, watch the following support levels: $4,000 (a psychological level for bulls and bears) and $3,968.80 (the lower Bollinger Band). On the upside, watch the $4,100 (a psychological level) and the $4,166 (last week's high-level consolidation) area.
Today, consider going long on gold at $4,020, with a stop-loss at $4,015; targets: $4,060 and $4,070.
AUD/USD
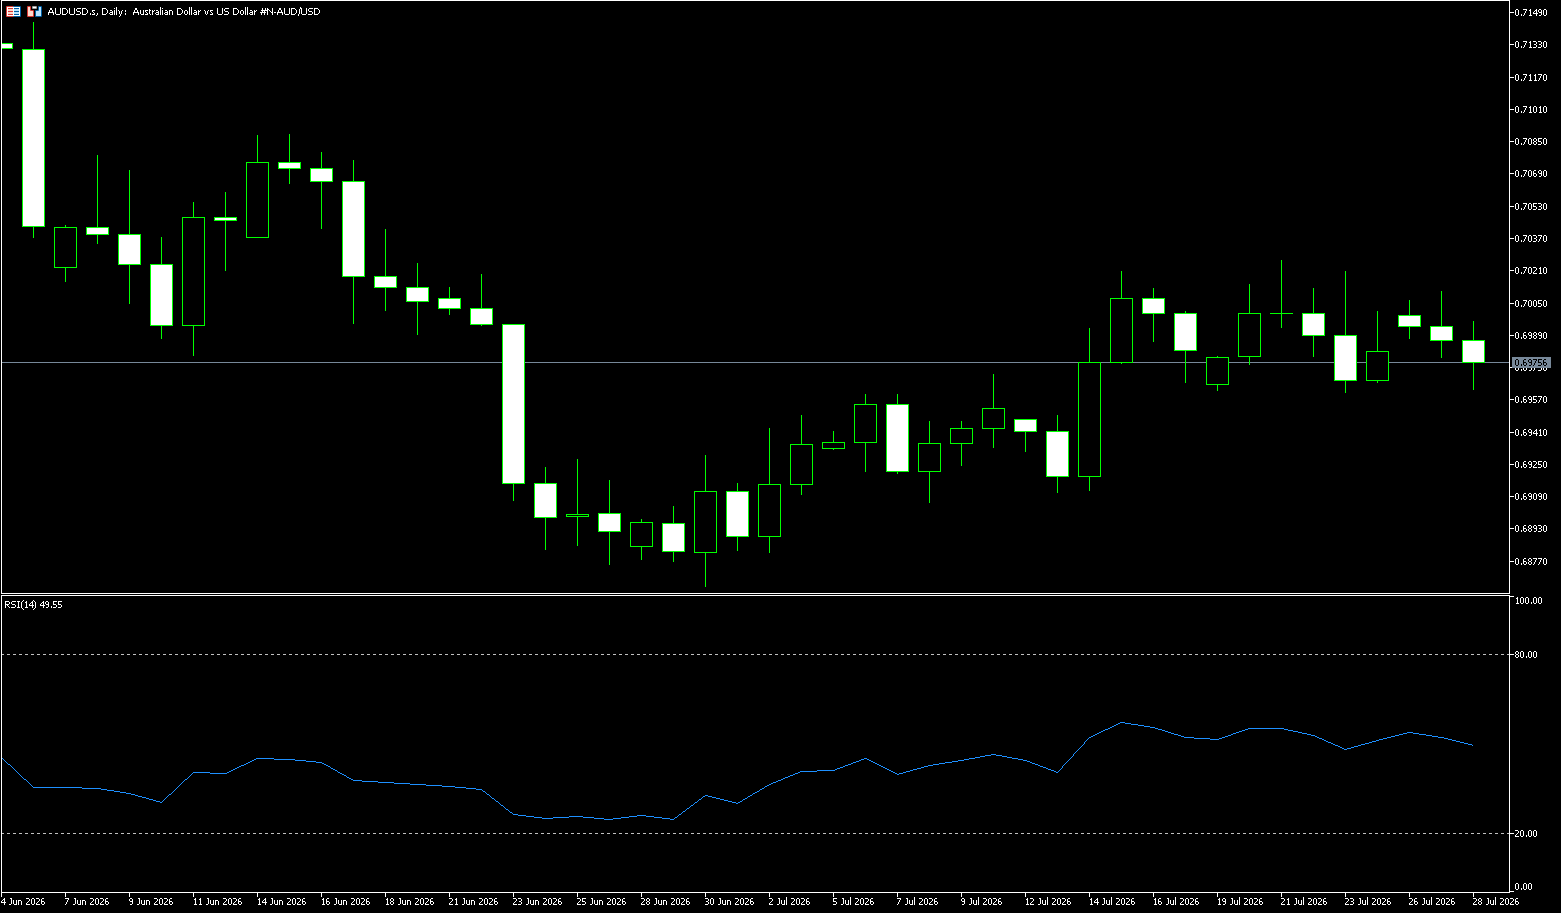
The Australian dollar remains near US$0.70 as investors await this week's inflation data for clues about the Reserve Bank of Australia's policy outlook. The second-quarter Consumer Price Index (CPI) report, expected on Wednesday, is anticipated to show core inflation rising 0.9% this quarter, bringing the annual rate up to 3.7% from 3.5%. The projected reading is well above the Reserve Bank of Australia's (RBA) target range of 2%-3%, further reinforcing market bets that policymakers will maintain a tightening stance. The market currently suggests a 30% probability of the RBA raising the cash rate from 4.35% in August, with a rate hike by November almost fully priced in. Meanwhile, the pause in the US-Iran conflict supported risk appetite. Oil prices fell, and the US dollar weakened after Washington suspended its nearly two-week strikes against Iran, with Tehran stating it had ended its retaliatory attacks. Elsewhere, the market is focused on the upcoming US Federal Reserve monetary policy meeting, with interest rates expected to remain unchanged.
The Australian dollar is currently trading above its 20-day simple moving average of 0.6960 against the US dollar, with short-term moving averages turning from resistance to support. The 50-day, 100-day, and 200-day moving averages continue to diverge upwards, solidifying the medium-term uptrend. The previous high of 0.7277 forms a key medium-term resistance level. In terms of indicators, the MACD indicator shows the DIFF and DEA lines closely following the zero line, with the histogram showing weak red bars, indicating that bearish momentum is continuing to weaken while bullish forces are recovering moderately, but a strong bullish offensive has not yet formed. The RSI value is 48.13, near the 50 level, which is the dividing line between bullish and bearish sentiment. It has moved out of the previous oversold zone, and the bulls have a slight advantage in the short term. It has not entered the overbought zone, and there is still some room for upward movement. The upside targets are 0.7000 (a psychological level) and 0.7024 (the upper Bollinger Band). On the downside, if it breaks below the 20-day simple moving average at 0.6960, the next target for this currency pair is the psychological level of 0.6900.
Consider going long on the Australian dollar at 0.6965 today, with a stop loss at 0.6955 and targets at 0.7020 and 0.7030.
GBP/USD
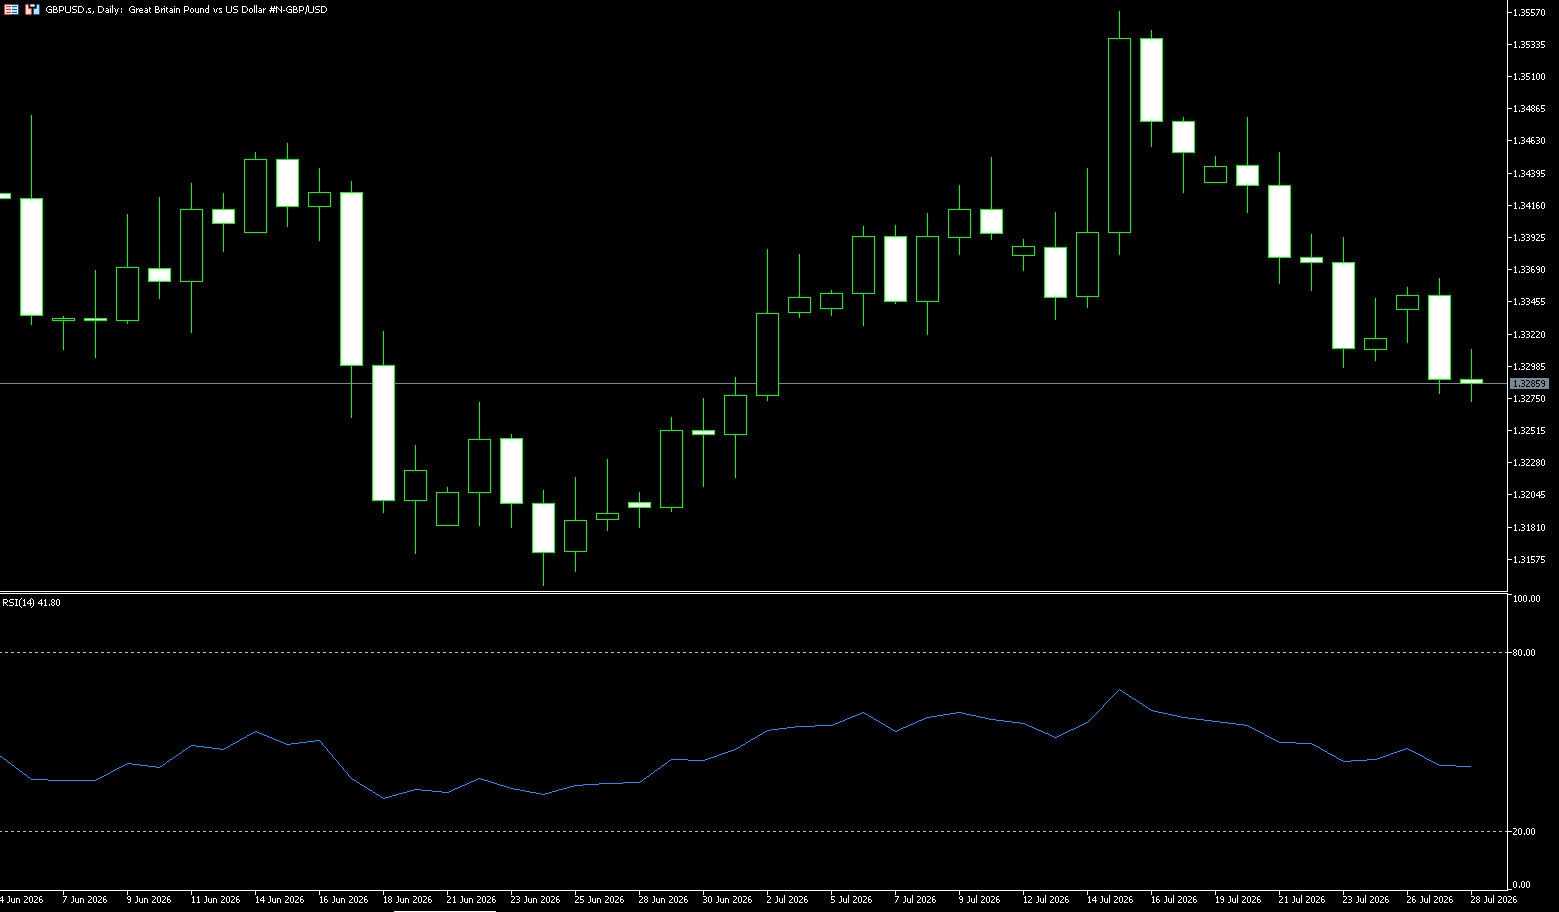
The pound is currently slightly higher against the dollar and challenged the 1.3300 area on Tuesday. In fact, the pound regained some balance against the dollar amid a weaker dollar, all ahead of Wednesday's Federal Reserve meeting and Thursday's Bank of England meeting. Despite the dollar being flat on the day, the pound still fell 0.13%. Market risk appetite worsened due to news that a Chinese state-owned company is producing chip manufacturing equipment, prompting a sell-off in Netherlands-based ASML. The pound/dollar pair is currently trading at 1.3295 after hitting a high of 1.3363. Furthermore, recent developments led to a sharp drop in oil prices and eased inflation concerns, cooling bets on a Fed rate hike and further pressuring the dollar. Additionally, the market is awaiting the outcome of the two-day FOMC meeting. Investors will be looking for more clues about the Fed's policy path, which, along with geopolitical developments, will drive the dollar and provide some meaningful upward momentum for the pound/dollar pair.
The British pound has retreated from a high of 1.3558 against the US dollar, currently trading at 1.3290, neutral to slightly weak, making it the worst-performing non-US dollar currency. The pair broke through the downtrend resistance line from the May high but remains capped below the 200-day simple moving average at 1.3398. A break above this level would target the highs of June 15th and July 10th, around 1.3455. Momentum indicators on the daily chart are neutral to slightly bullish, with the Relative Strength Index (RSI) hovering above 49 and the Moving Average Convergence Divergence (MACD) in positive territory, indicating short-term bearish dominance but limited momentum. On the downside, the bottom of the trading range over the past two weeks at 1.3330 could pose a challenge to the bears. Further down, the initial targets are 1.3298 (last week's low), which has already been broken, and 1.3300 (a psychological support level); while the highs of June 22nd and 30th around 1.3270, and the 1.3200 level will be the next targets.
Consider going long on GBP at 1.3278 today, with a stop loss at 1.3270 and targets at 1.3340 and 1.3330.
USD/JPY
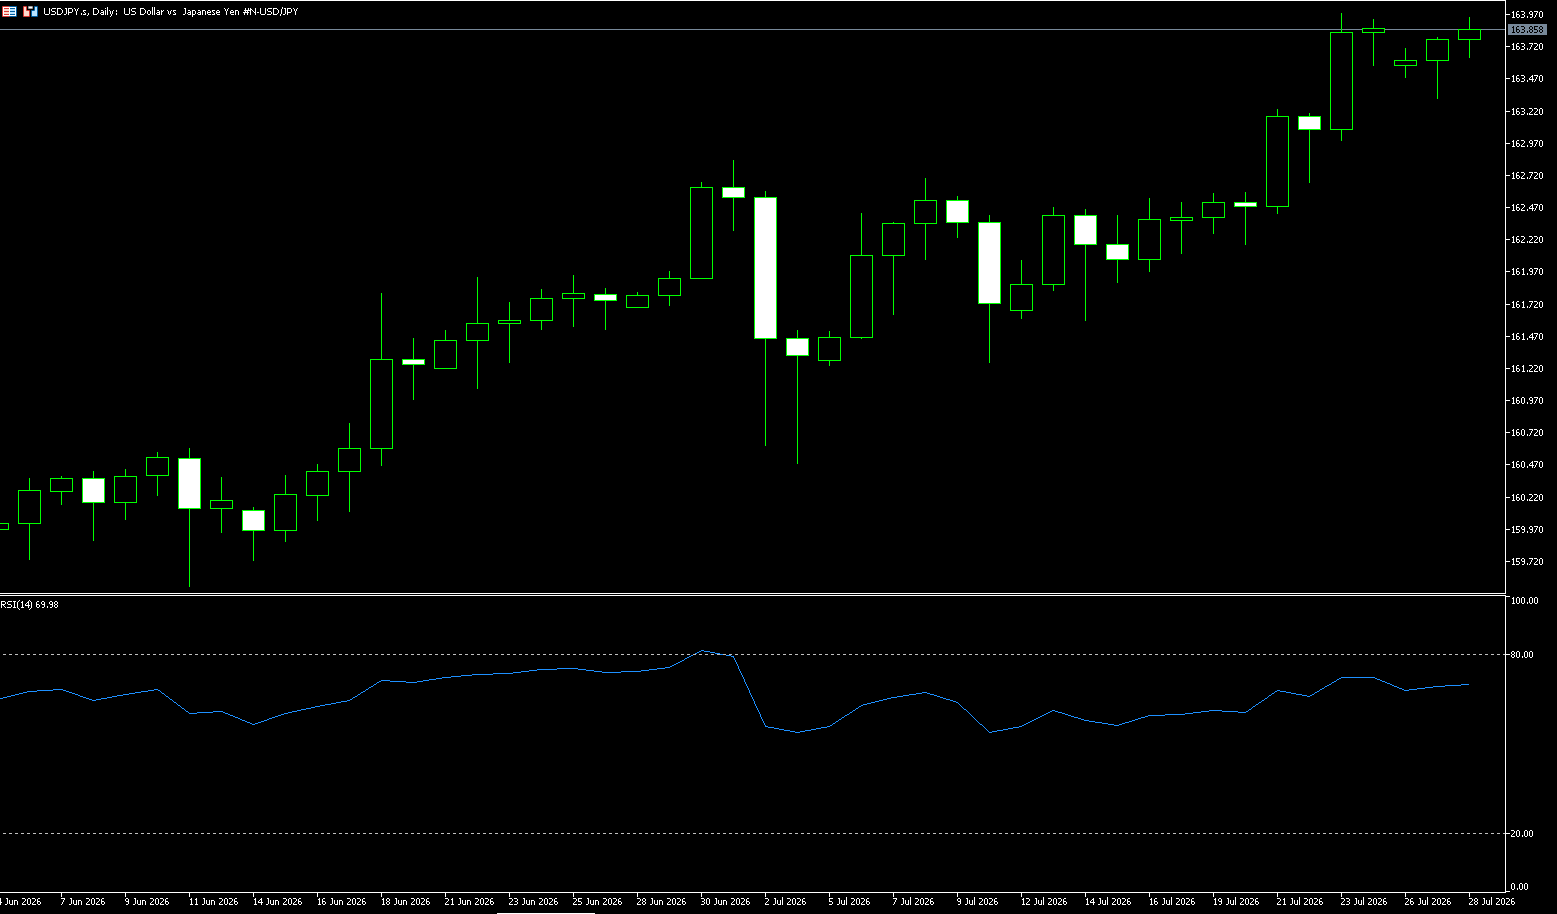
The yen traded around 163.85 per dollar on Tuesday, hovering near its lowest level in forty years, as the dollar remained strong amid market speculation that the Federal Reserve might raise interest rates this week. Meanwhile, the market widely expects the Bank of Japan to keep its policy rate unchanged on Friday, while maintaining the possibility of further rate hikes to help curb currency depreciation. Verbal intervention by Japanese authorities has so far had limited support for the yen, and the Bank of Japan remains unclear about the pace and timing of future policy tightening. Even after President Donald Trump stated that the US and Iran were in "good negotiations" to end the Middle East conflict, currencies remained under pressure. This news led to a drop in oil prices, easing concerns about inflation and tighter monetary policy.
The core contradiction for USD/JPY currently lies in changes in the USD/JPY interest rate differential and the flow of safe-haven funds. On the one hand, US economic data and inflation trends will determine the Federal Reserve's policy path; on the other hand, the pace of the Bank of Japan's policy normalization and changes in energy prices will affect the yen's medium-term performance. From a daily chart perspective, USD/JPY has recently shown signs of adjustment in the high-level area. The price is still trading above 160, and although the overall trend remains strong, short-term momentum has weakened. Currently, the exchange rate is affected by declining safe-haven sentiment and a weaker dollar, repeatedly testing the lower support area. If the price continues to break below the support near 163.00, it may further seek support in the 161.80-162.00 area; the resistance level to watch is the 164.50-165.00 area. A break above this area could potentially resume the previous upward trend. Overall, the daily trend remains bullish, but the upward momentum is undergoing a correction.
Today, consider shorting the US dollar at 164.10, with a stop loss at 164.30 and targets at 163.20 and 163.30.
EUR/USD
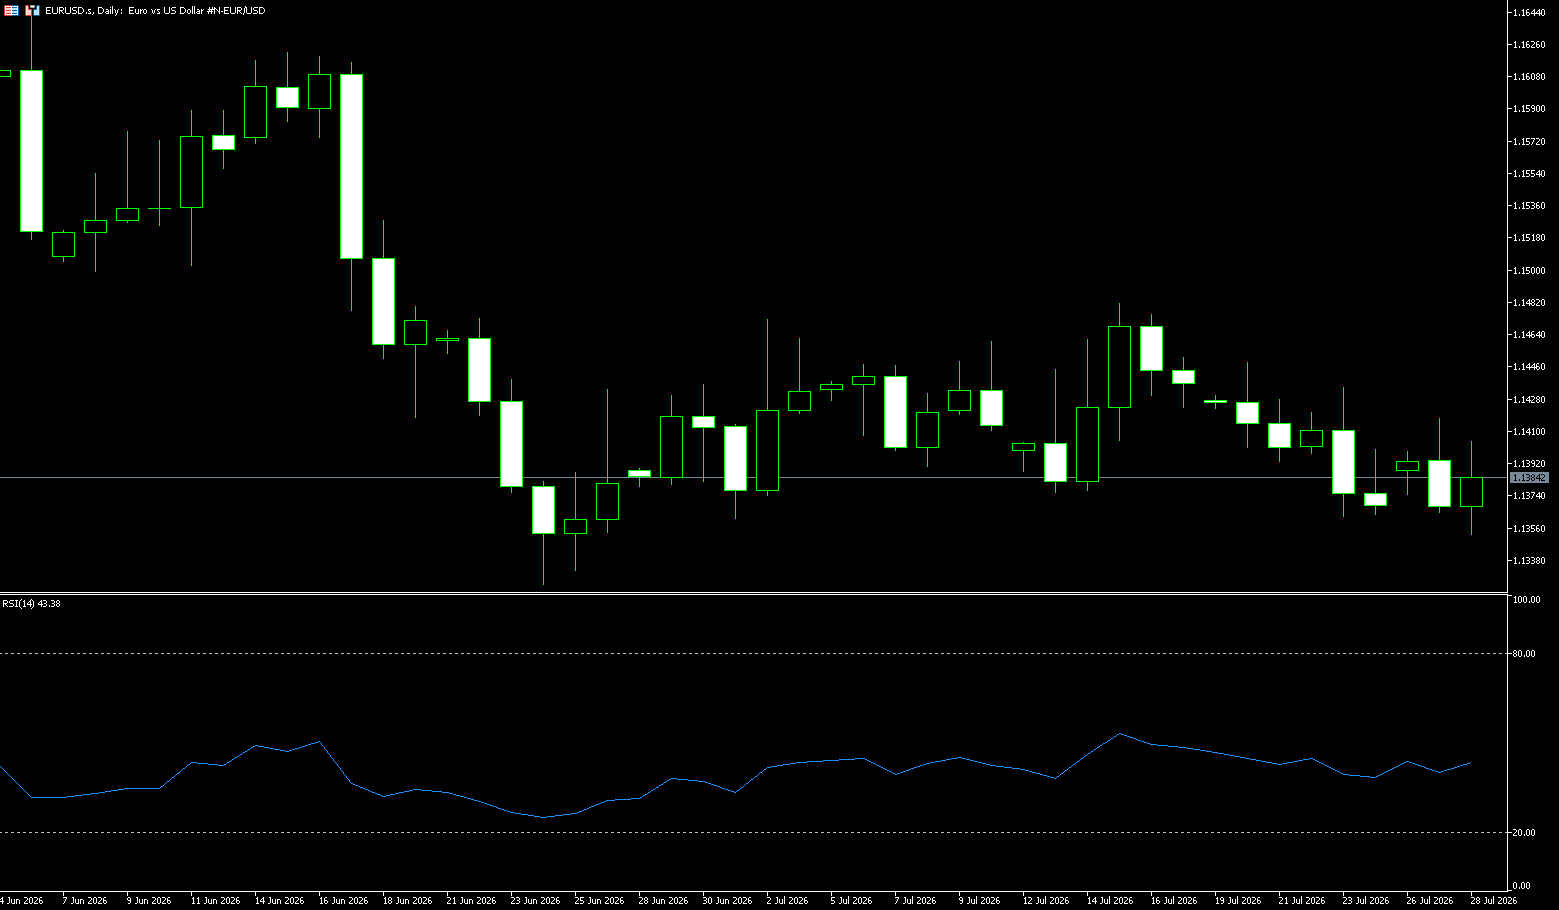
The euro is currently trading around 1.1390 against the US dollar, having rebounded slightly from the previous trading day, but remains within the medium-term downtrend range formed since April. Furthermore, the Federal Reserve will hold its policy meeting on July 28-29. Energy prices, inflation risks, and employment data are collectively increasing policy uncertainty, shifting the euro/dollar exchange rate from simple data-driven trading to a multi-faceted pricing strategy considering policy path, energy shocks, and term spreads. Energy remains the most non-linear variable in euro/dollar pricing. Brent crude recently rose above $100 per barrel, with the rapid price increase reflecting the impact of the US-Iran conflict and transportation risks in the Persian Gulf and Red Sea on supply chain expectations. Even if energy prices experience a single-day pullback, as long as the absolute level remains high, transportation, chemical, and end-fuel costs are likely to continue to be passed on to core prices. This shock is not a one-way issue for the euro. Rising energy import costs typically worsen terms of trade and squeeze corporate profits, putting pressure on the euro; however, if the ECB maintains a tight policy to control a second round of inflation, short-term interest rates may provide some support.
Looking at the daily chart, the euro/dollar exchange rate has been declining steadily since its April highs, with recent rebounds repeatedly encountering resistance in the 1.1470-1.1485 area. Recent highs on the chart are at 1.1472 and 1.1482, before the exchange rate fell back to around 1.1360, indicating that the selling pressure above is not a single technical resistance, but rather the result of a combination of interest rate differential expectations and energy risks. Only then can the technical structure shift from weak consolidation to equilibrium. The MACD indicator remains below the zero line, with the DIFF at -0.0026 and the DEA at -0.0029. Although the histogram has slightly turned positive, it is more likely that the downward momentum has temporarily weakened than that the trend has reversed. The area between 1.1353 (lower Bollinger Band) and 1.1361 (Tuesday's low) has been repeatedly tested. The market will focus more on whether the price will continue to fall after the 1.1300 level is broken by the bears, rather than the magnitude of a single day's rebound. Above, 1.1472 and 1.1482 form a continuous resistance zone. Only if the price fluctuation center continues to move upwards can further gains be expected.
Today, consider going long on the Euro at 1.1376, with a stop loss at 1.1366 and targets at 1.1420 and 1.1430.
Stock Analysis:
Australian ASX 200 Stock Index
Basic Market Overview:
The Australian Securities Exchange (ASX) 200 index rose 54 points, or 0.6%, to close at 8,948 on Tuesday, rebounding from earlier weakness and marking its second consecutive day of gains. Market sentiment improved after US President Trump indicated that Washington was in “good talks” with Iran and that a deal was possible, easing concerns about supply disruptions and causing oil prices to fall. Locally, Australia is considering building a new refinery for the first time in over six decades, as Middle East wars have compressed supply. Gains were broad, mainly driven by the business services, healthcare, transport, and financial sectors.
The four major banks rose between 0.7% and 1.2%. Additionally, Sonic Healthcare rose 2.2%, Sigma Healthcare rose 1.8%, and Ramsay Health rose 1.2%. Conversely, Origin Energy fell slightly after warning of a cybersecurity incident that could affect approximately 900,000 customers. Traders are now awaiting Australia's June and second-quarter inflation reports, with persistent price pressures remaining a concern despite the Reserve Bank's three rate hikes this year.
Sector Performance:
Leading Sectors:
1. Consumer Discretionary (+2.7%): Highest interest rate sensitivity, boosted by rising expectations of rate cuts; Aristocrat Leisure surged.
2. Information Technology: WiseTech Global, Xero, and TechnologyOne saw significant gains.
3. Financials (Big Four Banks): Gains of 0.7%~1.2%, with declining bond yields benefiting bank valuations.
4. Healthcare: CSL and Sonic Healthcare strengthened.
Leading Sectors:
1. Materials (Mining): BHP and Rio Tinto were under pressure, dragged down by volatile iron ore and precious metal prices.
2. Utilities and Traditional Energy: Origin Energy and Woodside saw slight declines.
Technical Analysis:
The Australian Securities Exchange 200 Index closed at 8947.8 on Tuesday. The AUD/USD pair rose 53.80 (+0.60%); it opened lower and fluctuated in the morning, but rallied strongly in the afternoon, boosted by the RBA Governor's speech, completing a bottoming-out and rebound within the day, closing at the intraday high, a six-week high. The AUD/USD 200 index rebounded from a low of 8650 and is currently testing the upper resistance level of its trading range; the key focus is whether it can effectively hold above 8950. The candlestick closed as a medium-sized bullish candle, engulfing the morning's losses, indicating a significant recovery in bullish momentum; the index has stabilized above all short-term moving averages. Currently, the 50-day moving average is turning upwards, and the price has stabilized above the 200-day moving average, suggesting a bullish bias in the medium-term consolidation pattern; however, there is significant historical resistance above. The daily RSI indicator has risen to around 62, gradually approaching overbought territory, limiting the potential for a sustained one-sided rally in the short term, and a period of consolidation to digest the pressure is likely. If the index continues to trade sideways within a narrow range of 8910-8960, do not open new positions. Wait for a breakout from this range and then follow the trend to avoid the risk of being stopped out by repeated fluctuations within the trading range.
Trading Strategies:
The following are technical trading ideas only and do not constitute investment advice. Leveraged trading may result in losses exceeding the principal.
**Trend-Following Long Position (Preferred)**
• Entry Conditions: Enter when a pullback to the 8900-8910 range shows a reversal candlestick pattern.
• Stop Loss: Below 8870 (Abandon the long position if the price breaks below the recent trading range).
• First Target: 8960; Second Target: 9010
• Exit Rules: Take profit in batches when the price encounters resistance near 9010 and the RSI enters above 70.
**Under Pressure Short Position (Alternative, Speculating on a Rally and Pullback)**
• Entry Conditions: A rally to the 8980-9010 range shows a long upper shadow and momentum exhaustion signals.
• Stop Loss: Above 9035
• Downside Targets: 8910 → 8830
**Key Risk Warning:**
ASX200 The index is heavily weighted towards banks and resource stocks; fluctuations in iron ore, international gold prices, and the Australian dollar exchange rate could cause sudden volatility.
The psychological level of 9000 points faces significant selling pressure, and a breakthrough based solely on sentiment is unlikely in one go; be wary of a pullback after a surge.
Overnight performance in US stocks and geopolitical tensions in the Middle East are impacting commodities, indirectly affecting the Australian resource sector.
The Australian earnings season begins in August, and divergent earnings results will increase sector rotation volatility.
China Shanghai Composite Index
Basic Market Overview:
On Tuesday, the Shanghai Composite Index fell 1.16% to close at 3813.3 points, while the Shenzhen Component Index plummeted 4.52% to 13509.7 points, its lowest level since early April, dragged down Asian markets by a broad sell-off in semiconductor stocks. The sector faced significant pressure due to growing concerns that large-scale investments in artificial intelligence might not quickly generate sufficient returns to justify high valuations. The development of China's semiconductor industry also dampened market sentiment, highlighting the country's rapid technological progress and intensifying competition in the global chip market.
Companies experiencing the largest declines include Cambricon Technologies (-9.11%), InnoLight Technology (-15.69%), Accelink Technologies (-17.13%), GigaDevice Semiconductor (-10%), and SMIC (-4.92%). Investors are now focused on the Politburo meeting later this week, where policymakers are expected to provide new guidance on China's economic strategy for the second half of the year.
Sector Performance:
Leading Sectors (Net Inflow of Main Funds, Defensive Theme)
1. Baijiu/Food & Beverage: Strongest against the market trend, preferred by domestic demand defensive funds seeking safe haven;
2. State-Owned Banks (Banking Sector): Core hedging force for the Shanghai Composite Index, high-dividend blue chips;
3. Automobile Manufacturing, Retail, Education, Hotels & Restaurants;
Logic: Existing funds are shifting between high and low valuations, avoiding high-priced technology stocks, and positioning themselves in undervalued defensive assets.
Leading Declining Sectors (Large Net Outflow from Major Players)
1. Semiconductors, Memory Chips, PCB/Passive Components (Significant Declines);
2. CPO Computing Hardware, Communication Equipment, Electronic Chemicals;
3. Photovoltaic Lithium Batteries, Rare Metals, Commercial Aerospace Themes;
Catalyst: Overnight, overseas AI hardware giants saw sharp declines in their stock prices, raising market concerns about a long-term oversupply in the computing power industry chain. Profit-taking occurred in previously high-performing technology sectors.
Technical Analysis:
Shanghai Composite Index closing at 3813.31, -1.16%; The index opened lower and trended downwards throughout the day, with the center of gravity continuing to shift downwards; the intraday low was 3797.37 points, and the high was 3844.01 points. Total turnover in the two markets was 2.03 trillion yuan, a decrease of approximately 50 billion yuan compared to the previous day, indicating increased willingness to cash out and a wait-and-see attitude among new investors. The price action closed with a medium-sized bearish candlestick, breaking below the 5-day moving average (around 3847), thus disrupting the short-term rebound trend. The previous day's high of 3858 has transformed from support into strong short-term resistance. The MACD histogram is rapidly converging, suggesting a potential death cross; the KDJ indicator has fallen from its high and entered a downward trend, indicating increased short-term bearish momentum. In the short term, a downward channel has formed, with the rebound strength continuously weakening. If trading volume continues to shrink, the 3790 support level is likely to be tested repeatedly. A decisive break below 3790 without a quick recovery will trigger a second pullback, testing the 3740 low. If the price holds above 3800, the range-bound trading will continue.
Trading Strategy:
This information is for market analysis and reference only and does not constitute any trading or investment advice.
For those holding positions:
• If the rebound reaches above 3830: Reduce positions in high-flying sectors in batches to realize profits;
• For defensive blue-chip stocks: Continue to hold above 3780, reduce positions if it falls below 3780;
• For high-flying tech stocks: Reduce positions on rebounds, do not add to average down costs.
• For those holding no positions/preparing to buy on dips:
• If a stabilization signal appears in the 3780-3790 range (low volume, signs of bottoming out, and capital inflow), a small position (10-20%) can be taken, prioritizing defensive sectors with solid performance;
• Buying above 3840 is strictly prohibited;
• If the price breaks below 3780 with high volume, abandon buying on dips and continue to observe.
Key Risk Warning:
Structural Sector Risk (Primary Risk)
Previously popular sectors such as AI computing power and semiconductors are experiencing loosening of positions, and short-term selling pressure has not been fully released. A pullback in these sectors could drag down the ChiNext and STAR Market 50, thereby suppressing market sentiment. External Macroeconomic Risks
With the Federal Reserve's interest rate meeting approaching this week, a hawkish stance could push up US Treasury yields, continuing to suppress high-valuation growth stocks. Escalating global geopolitical conflicts could also drive up oil prices, reinforcing stagflation concerns and dampening risk appetite.
Liquidity and Funding Risks
Month-end institutional fund settlement pressures remain. The market is currently a zero-sum game, with rapid rotation of hot sectors and weak sustainability of themes; chasing highs is highly likely to result in losses.
Technical Breakdown Risks
If the Shanghai Composite Index effectively breaks through the key low of 3740, the current rebound structure that started from 3741 will be declared over, opening up a larger-scale correction.
Disclaimer: The information contained herein (1) is proprietary to BCR and/or its content providers; (2) may not be copied or distributed; (3) is not warranted to be accurate, complete or timely; and, (4) does not constitute advice or a recommendation by BCR or its content providers in respect of the investment in financial instruments. Neither BCR or its content providers are responsible for any damages or losses arising from any use of this information. Past performance is no guarantee of future results.
More Coverage





Risk Disclosure:Derivatives are traded over-the-counter on margin, which means they carry a high level of risk and there is a possibility you could lose all of your investment. These products are not suitable for all investors. Please ensure you fully understand the risks and carefully consider your financial situation and trading experience before trading. Seek independent financial advice if necessary before opening an account with BCR.
BCR Co Pty Ltd (Company No. 1975046) is a company incorporated under the laws of the British Virgin Islands, with its registered office at Trident Chambers, Wickham’s Cay 1, Road Town, Tortola, British Virgin Islands, and is licensed and regulated by the British Virgin Islands Financial Services Commission under License No. SIBA/L/19/1122.
Open Bridge Limited (Company No. 16701394) is a company incorporated under the Companies Act 2006 and registered in England and Wales, with its registered address at Kemp House, 160 City Road, London, England, EC1V 2NX. Open Bridge Limited acts solely as a payment processor for BCR Co Pty Ltd and does not provide any financial, trading, or investment services on its behalf. Open Bridge Limited's role is limited to payment processing.


 English
 简体中文
简体中文
 繁體中文
繁體中文
 Bahasa
Melayu
Bahasa
Melayu
 Tiếng
Việt
Tiếng
Việt
 ไทย
ไทย
 日本語
日本語
 한국어
한국어
 ភាសាខ្មែរ
 español