


0
US Dollar Index
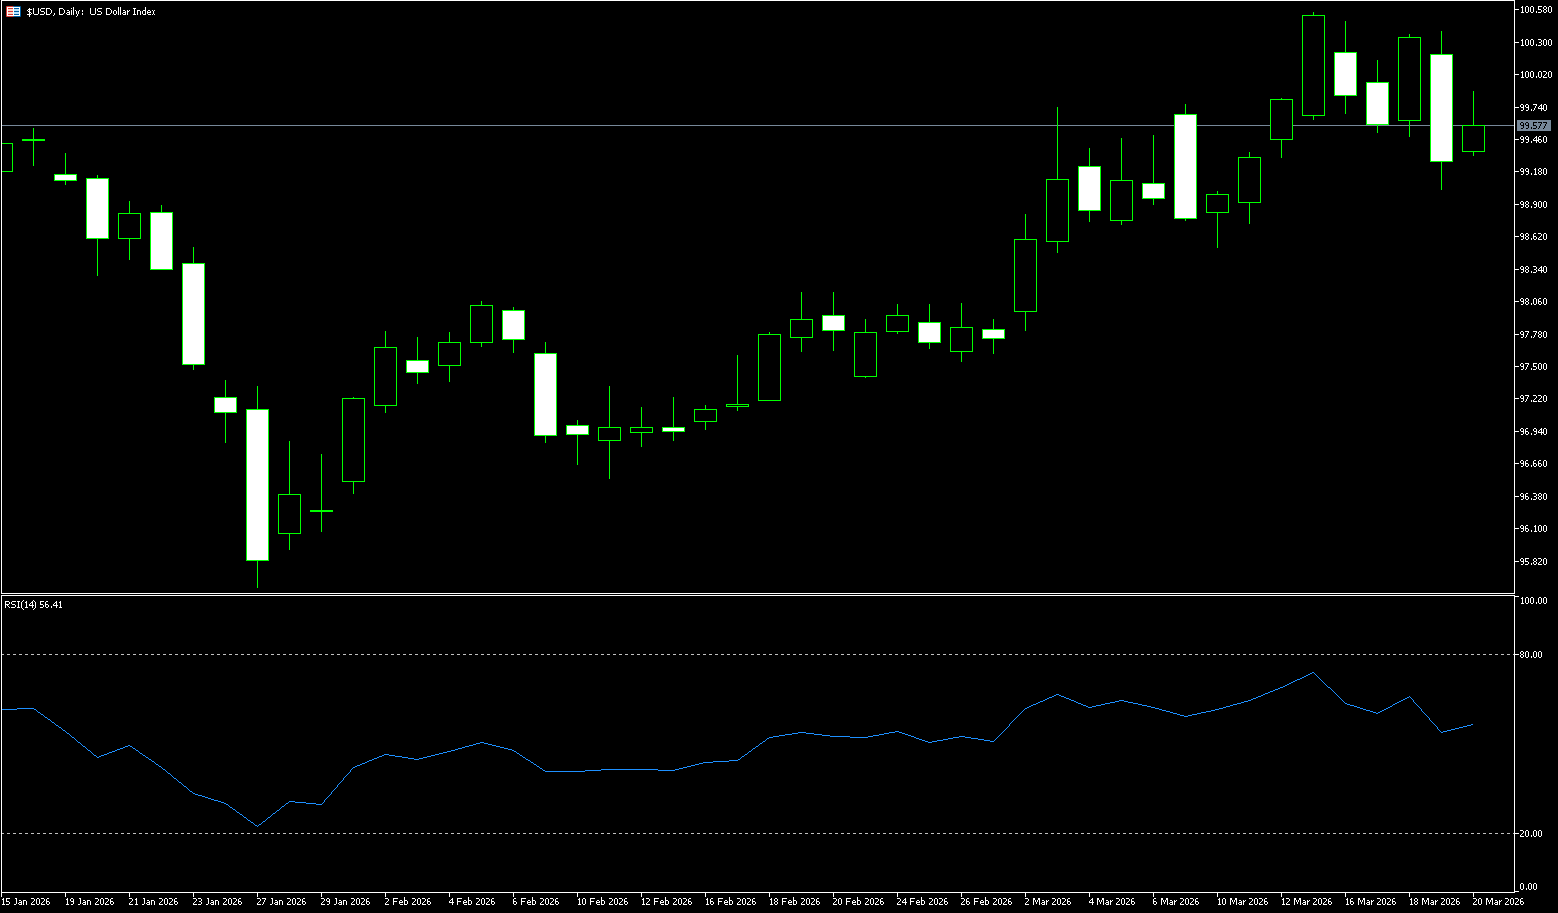
The US dollar index rose to 99.80 on Friday, after falling 0.8% in the previous session, as the prospect of a swift resolution to the ongoing war with Iran remained bleak. Oil prices fluctuated wildly but remained near 2022 highs, increasing concerns about their inflationary impact, as central banks adopted a more cautiously hawkish stance. The Federal Reserve kept the federal funds rate unchanged on Wednesday. Updated forecasts still point to one rate cut this year, but policymakers emphasized the uncertainty surrounding the economic impact of the conflict and noted that upside risks to inflation remained high. The dollar generally strengthened, particularly against the yen. Despite Friday's gains, the dollar still fell nearly 1% this week. Meanwhile, the dollar weakened last week, with the dollar index surging mid-week after the Fed's decision to keep interest rates in the 3.50%-3.75% range before falling back below 100.00 on Friday, closing at 99.50. As the Iran war nears its third weekend, the Strait of Hormuz remains effectively closed, and oil prices remain high.
After two consecutive weeks of gains, the US dollar reversed sharply, with the dollar index briefly testing levels below 99.00 after firmly establishing itself above 100.00. Last week, the dollar index initially declined before rising, exhibiting an overall high-level consolidation with a slightly bullish bias. The Fed's hawkish decision and Middle East geopolitical risks were the core drivers. Technically, it shows short-term strength but awaits confirmation in the medium term. At the beginning of the week, the index fell from a high of 100.47, reaching a low of 99.22. Before the weekend, it consolidated at high levels, closing at 99.510, with the weekly chart showing a small positive candle, holding the key support level of 99.0. On the daily chart, the MACD golden cross is valid, with the DIFF and DEA lines diverging above the zero line and the red histogram showing ample momentum, indicating bullish dominance. The RSI (14-day) remains in the 55-60 range, not showing overbought conditions, indicating that bullish momentum has not weakened and there is still room for further upward movement. Currently, the Fed's hawkish stance and Middle East geopolitical risks provide support, and the index is likely to remain range-bound between 98.55 and 101.00. A break above 101.00 would require stronger data or risk events; a break below 98.55 would indicate a return to a weak consolidation. In the short term, the US dollar index is showing a slightly bullish bias at high levels, with 100.00 (a psychological level) serving as a key support/resistance level. A firm hold above 100.00 could lead to a test of 100.47 (last week's high) - 101.00 (the psychological level); a break below 99.00 would likely see a pullback to the support zone of 98.98 (last week's low) - 98.55 (the 134-day simple moving average).
Today, consider shorting the US dollar index at 99.60, with a stop-loss at 99.70 and targets at 99.10 and 99.00.
WTI Crude Oil
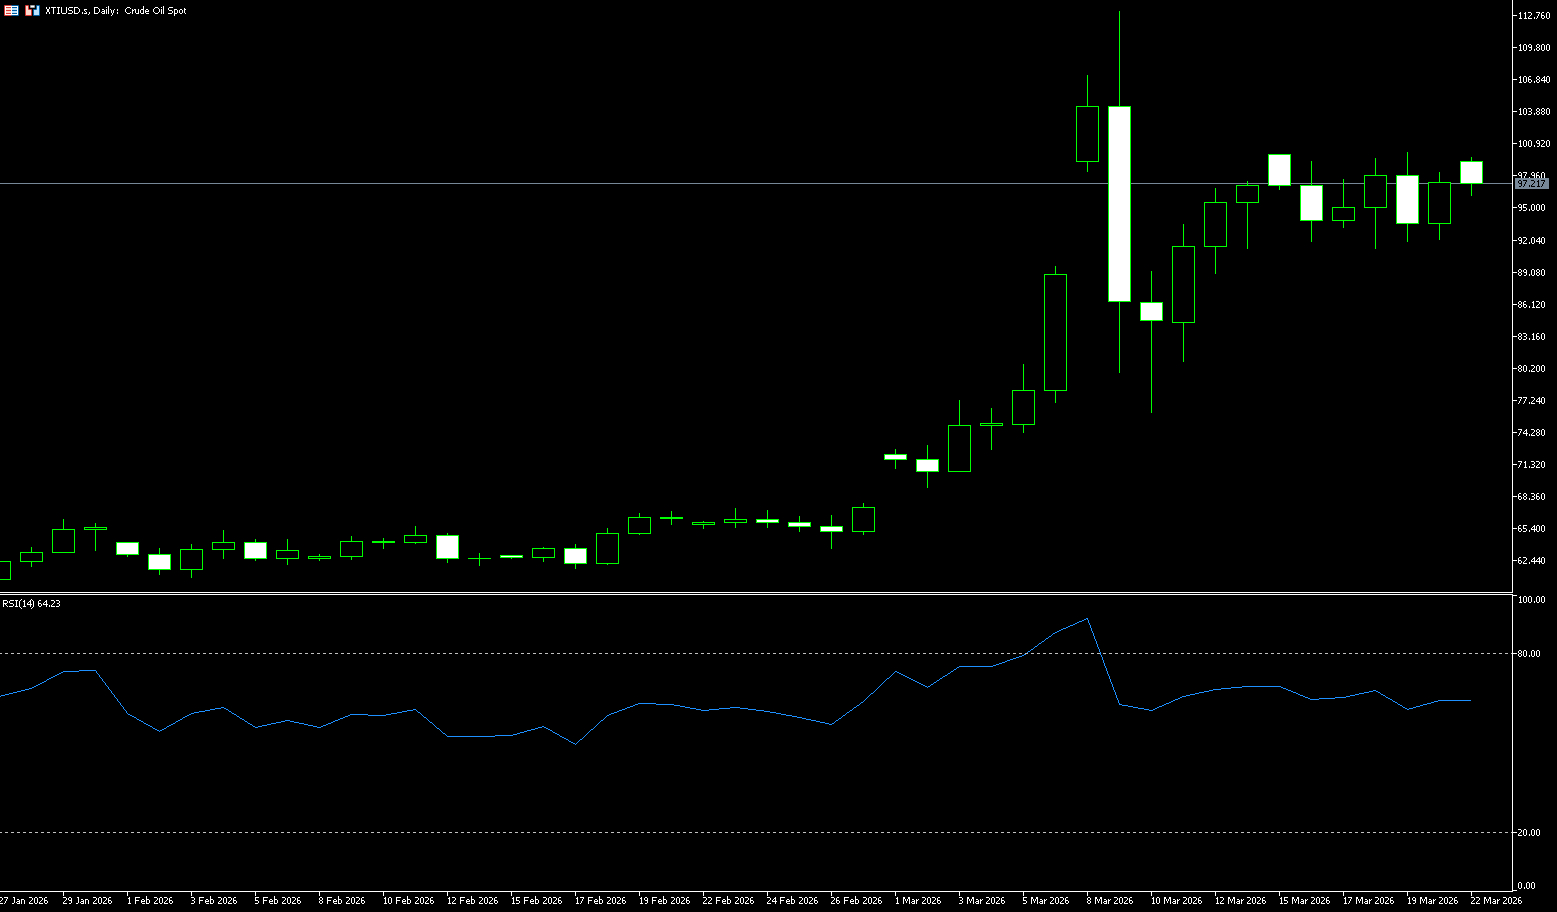
WTI Spot crude oil prices rose above $98 a barrel before the end of last week, with investors focused on the latest escalation of the conflict in the Middle East. The market is now pricing in actual supply disruptions as Iraq declared force majeure on all its oil fields and drones attacked a Kuwaiti refinery. Meanwhile, President Trump rejected a ceasefire proposal from Iran and expressed confidence in the openness of the Strait of Hormuz, despite the Pentagon deploying thousands of additional Marines and considering plans to seize Kark Island. The geopolitical risk premium widened following reports of drone attacks on the Kuwaiti refinery and heavy ground troop readiness. The market is now discounting a diplomatic solution and instead preparing for a prolonged disruption to global energy flows. Despite the International Energy Agency releasing 400 million barrels of reserves, the geopolitical risk premium still widened as the impact of the emergency stockpiling measures was offset by a sharp drop in tanker traffic. In addition, crude oil inventories at Cushing, Oklahoma, rose to 27.52 million barrels. Faced with soaring oil prices and political pressure from the domestic midterm elections, the Trump administration quickly adjusted its strategy. Treasury Secretary Bessant announced on Thursday that the US might "soon" lift sanctions on Iranian crude oil stranded on tankers, involving approximately 140 million barrels of oil. If this batch of crude oil enters the market, it would be equivalent to 10 to two weeks of global consumption, potentially curbing oil price increases over the next 10 to 14 days.
Last week, WTI crude oil was quoted at $97.50 per barrel, down 0.10% for the week. Technically, it showed a pattern of high-level pullback, short-term bearish reversal, and continued medium-term support. The trend structure shows that after a strong upward move, a large bearish candlestick appeared at a high level, breaking below the 5-day and 10-day simple moving averages, disrupting the short-term bullish formation and entering a pullback phase; the 20-day simple moving average (approximately 82.26) is a key medium-term support level. As for the chart pattern, a "dark cloud cover" pattern formed at the high level, breaking below 100... The US dollar is facing a psychological barrier, dampening bullish sentiment. The MACD technical indicator shows a death cross above the zero line, with expanding green bars indicating increasing bearish momentum. The 14-day RSI is at 71, entering overbought territory, suggesting a potential restart of the pullback. The short-term trend is expected to be a bearish pullback, targeting the support zone between $90.00 (market psychological barrier) and $88.80 (14-day simple moving average). A break below $90.00 could lead to a further decline to $82.26 (20-day simple moving average). Conversely, if the price holds above $93.84 (9-day simple moving average), the next target will be last week's high of $99.91 and the $100.00 (market psychological barrier) area. A break below this level would target $106.70 (upper Bollinger Band on the daily chart).
Today, consider going long on spot crude oil at $97.30, with a stop-loss at $97.10 and a target of $99.00. 100.00
Spot Gold
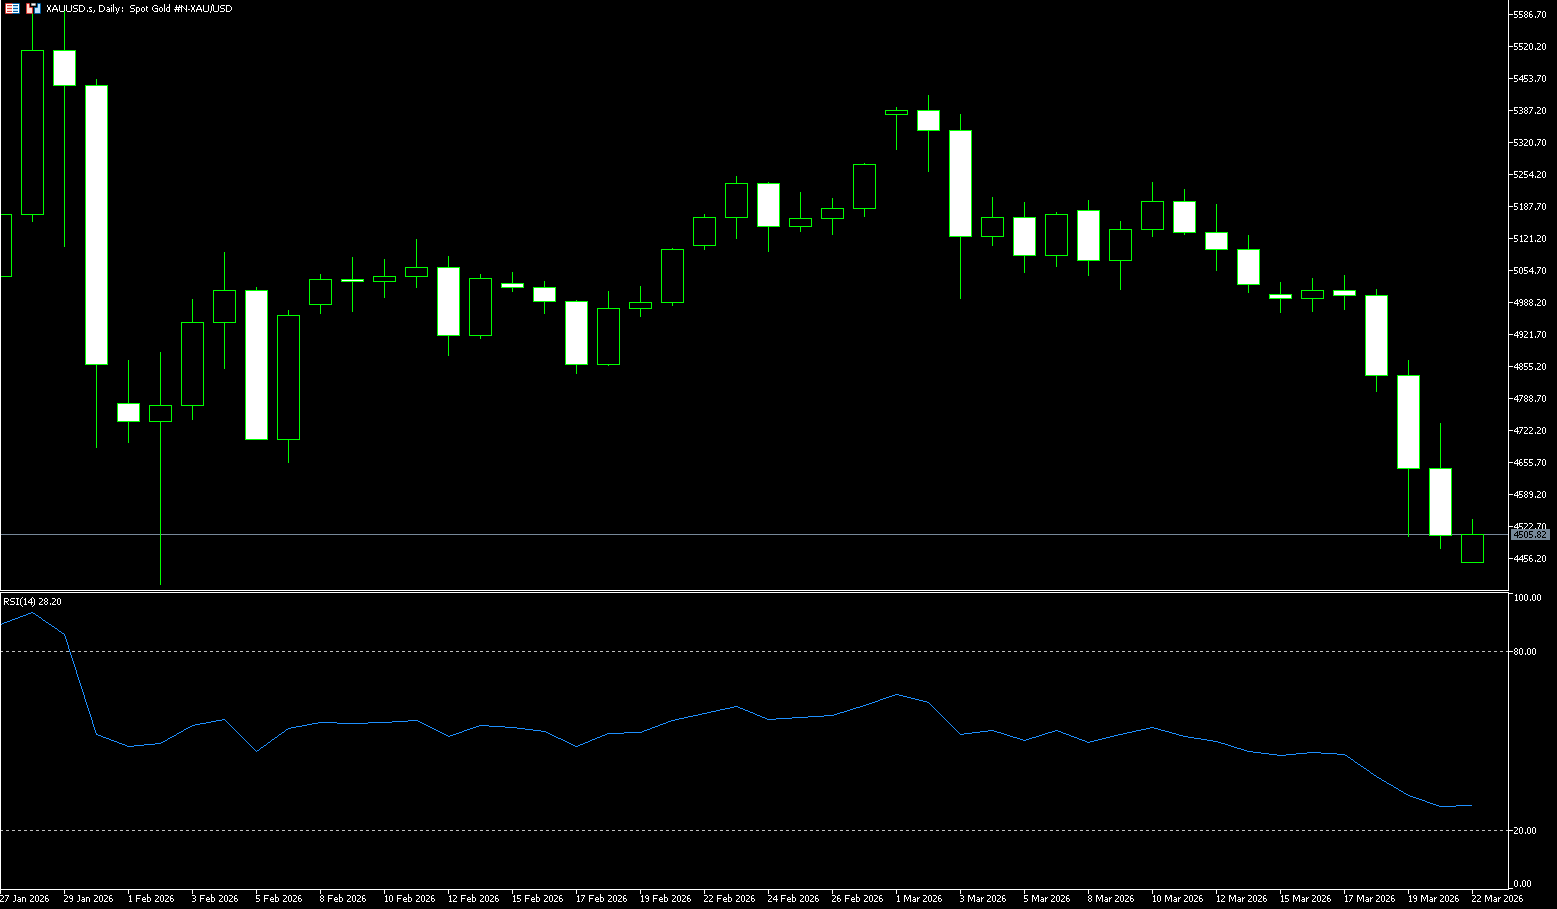
Gold fell more than 10% to $4,477 an ounce on Friday, heading toward its biggest weekly drop since 1983, as escalating tensions in the Middle East sent energy prices soaring and dampened hopes for a near-term interest rate cut. Prices fell further after news broke that the Pentagon had deployed three warships and thousands of Marines, with traders setting the probability of a Federal Reserve rate hike in October at 50% amid heightened concerns about persistent inflation. The safe-haven metal has been falling weekly since last month’s U.S.-Israeli strike on Iran, pressured by Treasury yields. Rising yields, a stronger dollar, and profit-taking pressure from investors covering losses elsewhere contributed to the decline. Earlier, the Federal Reserve, the European Central Bank, the Bank of England, and the Bank of Japan kept interest rates unchanged but indicated they were prepared to tighten policy further if inflationary pressures persisted. Last week, gold prices fell due to profit-taking by short-term futures traders, while a stronger dollar index also weighed on metal prices. The gold market appears to be caught in a tug-of-war between war-induced safe-haven demand and concerns about persistently high interest rates. The market is currently highly focused on the Federal Reserve's March interest rate meeting (expected). The unchanged interest rate and US energy inventory data, coupled with any unexpected developments in the Middle East situation, could trigger sharp fluctuations.
Affected by rising geopolitical risks and inflation expectations, the US dollar index and US Treasury yields rose in tandem, creating a double pressure on gold prices. On the one hand, a stronger dollar significantly reduces the attractiveness of dollar-denominated gold to non-dollar holders; on the other hand, rising US Treasury yields further highlight the disadvantage of gold holdings without interest income, accelerating the outflow of funds from the precious metals market. Looking at the daily chart for gold, the price is attempting to stabilize around $4,604, near the 100-day simple moving average. Gold prices are currently above the 50-day simple moving average (around $4975.80), but earlier broke below this level, signaling increased short-term selling pressure. In terms of indicators, the Relative Strength Index (RSI) is hovering around 29, nearing oversold territory, but the current bearish momentum remains strong; the Average Directional Index (ADX) is still rising, indicating that the bearish momentum has not been exhausted and a rapid reversal is unlikely in the short term. If gold prices break below Thursday's low of $4,502, the next support level will test the April 2nd low of $4,402, with further downside targeting the 160-day simple moving average (around $4276), a key medium- to long-term support level. If gold prices can rise back above the 100-day simple moving average at 4.604, a technical rebound is expected. The first resistance level is the 65-day simple moving average ($4847.60), and a break above this level will challenge the psychological barrier of $5,000. If it holds above $5,000, the second short-term resistance level is $5,200, a key level for determining whether gold prices have reversed.
Today, consider going long on spot gold at 4,485, with a stop loss at 4.480 and a target of 4,600. 4,650
AUD/USD
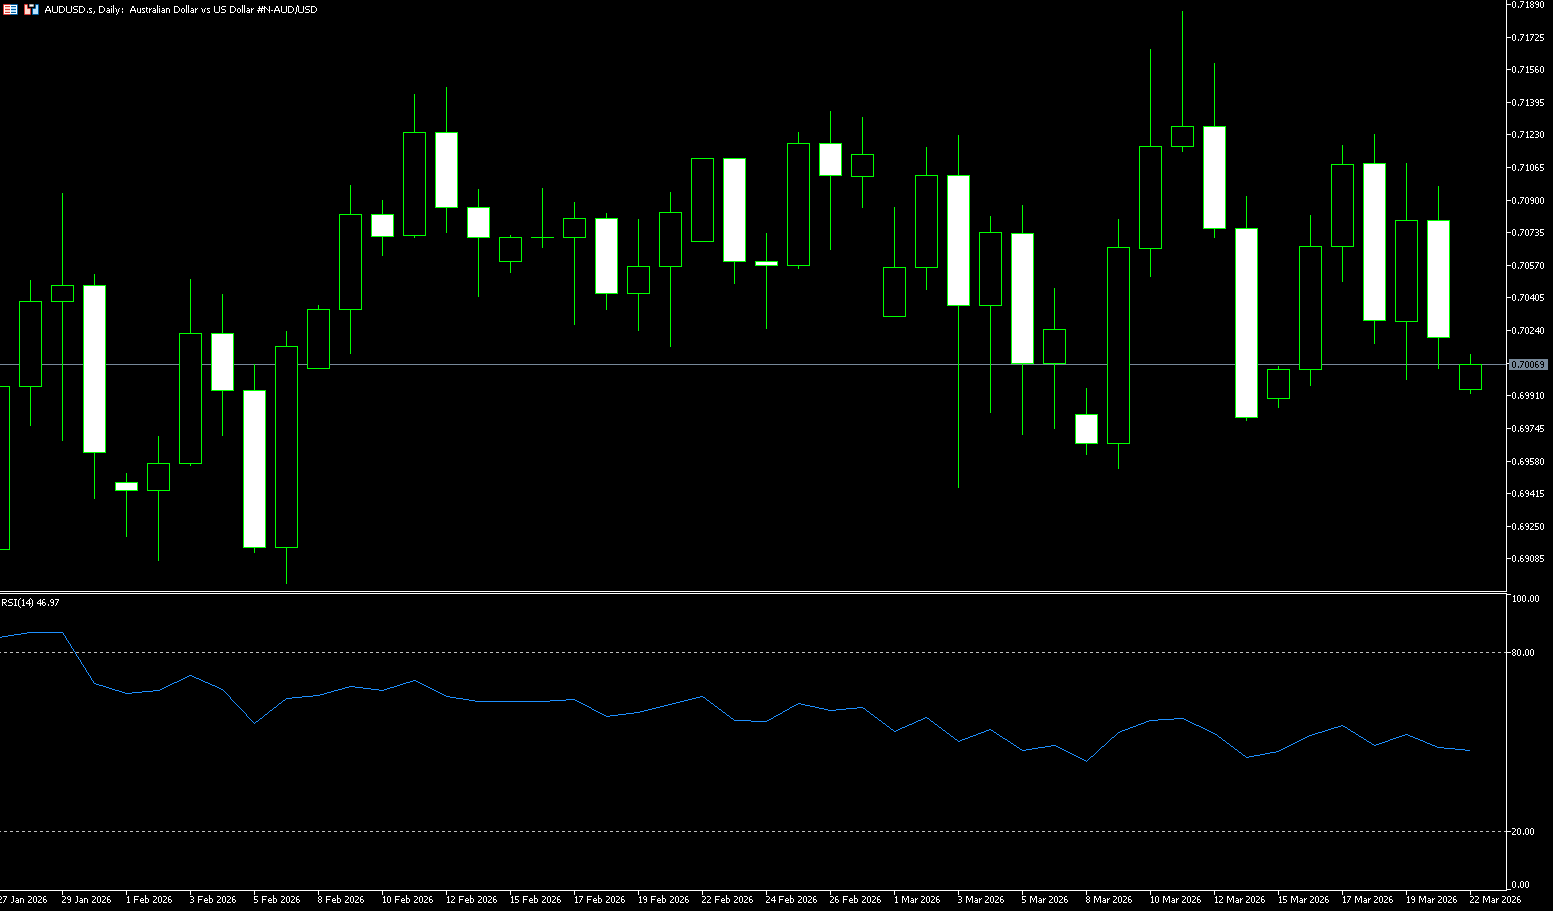
The Australian dollar traded above US$0.7000 for most of last week, maintaining its recent gains and poised for its biggest weekly gain since mid-January, as escalating Middle East conflict led to a surge in oil prices, fueling inflation concerns and increasing the risk of further tightening of the Reserve Bank of Australia's (RBA) policy. The RBA warned on Thursday that the conflict posed a substantial risk to the domestic economy. Governor Michel Block also repeatedly warned of the risks of persistent inflation, adding that the board remained uncertain whether policy was tight enough. A relatively strong jobs report further reinforced the central bank's view that the economy could withstand tighter policy. This followed the RBA's consecutive rate hikes earlier this week. Markets remain divided on potential moves in May, with an August rate hike already fully priced in. Meanwhile, following Tehran's attacks on the Gulf region, investors weighed signals from the US and Israel indicating restraint against further attacks on Iranian energy infrastructure. The People's Bank of China kept its benchmark lending rates unchanged last week. The one-year and five-year Loan Prime Rates (LPRs) remained at 3.00% and 3.50%, respectively. The Federal Reserve, meanwhile, maintained its target range for interest rates at 3.50% to 3.75%. The median dot plot still projects a 25-basis-point rate cut later in 2026, although some officials now expect no cuts this year.
The Australian dollar traded in a range against the US dollar last week, with a core range of 0.6980–0.7130. Short-term direction is highly dependent on Fed policy signals, while the medium-term technical outlook remains bullish. The Australian dollar's short-term outlook remains optimistic, benefiting from persistently high inflation and the Reserve Bank of Australia's hawkish stance. This combination could pave the way for further gains in the Australian dollar against the US dollar, while also providing support for occasional sell-offs. On the daily chart, the 200-day moving average is trending upwards, indicating a bullish medium-term trend; short-term moving averages (5/10/20) are flat/slightly downwards, exerting downward pressure on prices, suggesting a slightly weak short-term trend; while the 50-day moving average... The daily moving average provides strong support around 0.6990. As for the MACD daily golden cross pattern, it is intact, the medium-term bullish momentum has not been destroyed, the short-term momentum has weakened, and the bulls and bears are locked in a stalemate; at the same time, the RSI (14) is in the neutral range around 50, with no obvious overbought/oversold conditions, and the oscillation characteristics are obvious. Once the Australian dollar breaks through 0.7071 {20-day moving average} and 0.7100 {integer level} and holds, it will further challenge the 0.7185 {Wednesday high} and 0.7200 {psychological level} area, and if it breaks through, it will point to the 0.7283 {May 2022 high} level. Conversely, if the currency pair falls instead of rising, it may test the 0.7000–0.6980 {psychological core defense line last week, which has been tested multiple times without being broken}. The next level to test is the 0.6941 (60-day moving average) level.
Consider going long on the Australian dollar today at 0.7012, with a stop loss at 0.7000 and a target of 0.7060. 0.7070
GBP/USD
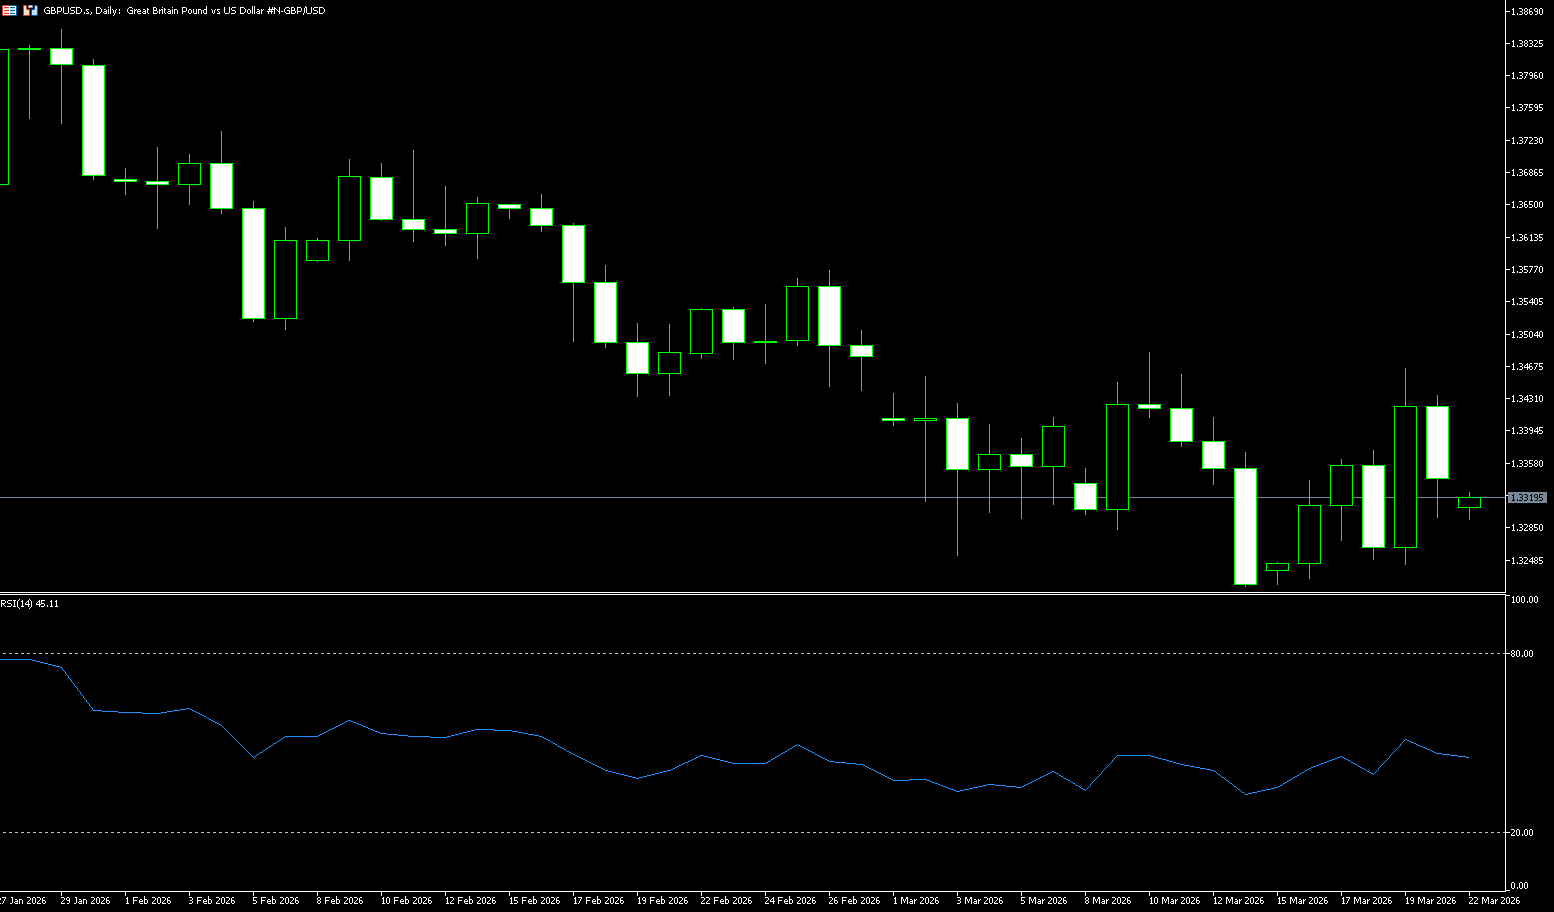
GBP/USD rose in the latter part of last week, approaching 1.3470, supported by improved risk appetite that limited the dollar's rebound. The pound maintained its weekly gains, driven by the Bank of England's unexpected hawkish turn. The Bank of England's unanimous decision last week to keep interest rates unchanged and the sharp repricing of short-term rates pushed UK yields significantly higher, thus supporting the pound. Worsening tensions in the Middle East and rising energy prices could impact equities, reversing some of the tightening and weakening yield support for the pound. The Bank of England's unexpected decision and soaring yields boosted the pound. However, if the situation in the Middle East continues to deteriorate and energy prices rise further, the resilience of equities could change, and a sharp decline in equities could reverse some of the tightening. The pound is receiving support from soaring yields (although less significant compared to such a large interest rate change), and this support could disappear if broader risk conditions worsen. Meanwhile, The repricing of interest rate expectations by the European Central Bank and the Bank of England kept the euro/pound relatively stable, with all volatility occurring primarily in the pound/dollar pair. Oil prices have now regained their dominance, but the Bank of England's hawkish stance provided additional support for the pound.
Last week, the pound initially weakened against the dollar before rebounding. On Thursday, driven by the Bank of England's ultra-hawkish decision and the Federal Reserve's dovish shift, the pound surged over 1% in a single day, closing with a large bullish candle on the weekly chart, establishing a bullish dominance. Currently, it is consolidating at high levels, digesting overbought pressure. The pair attracted buyers for three consecutive days, rising to a more than one-week high around 1.3467 on Thursday. This rise further supports the possibility of a continuation of the rebound from the previous week's low near 1.3218, a three-month low. A strong break above the key 1.34 level in late last week, holding above the 5-day, 10-day, and 20-day moving averages, turned the moving average system into a bullish alignment; the previous descending channel was effectively broken, shifting the medium-term trend from bearish to bullish. The moving average system shows that 5/10/20 The daily moving averages are in a bullish alignment, with the 50-day moving average (around 1.3505) acting as strong resistance in the near term. A breakout would open up more upside potential. The daily RSI (14) has rebounded from its low to around 45-50, showing a neutral to bullish bias, not overbought, and still has room for further upward movement. As for the MACD, a golden cross has formed, and the red bars have expanded, indicating strong bullish momentum with a slight contraction, which is a normal pullback. If the pound/dollar pair can hold the 1.3344 (9-day moving average) support, it will target the 1.3483 (March 10 high) – 1.3500 (psychological level) area. A breakout would target the 1.3600 (psychological level). On the other hand, if it falls below 1.3400 (psychological level), it will target the 1.3344 (9-day moving average). A break below this level would target the 1.3300 psychological level and further challenge the 1.3246 level (the low of March 19th).
Today, consider going long on GBP at 1.3330, with a stop-loss at 1.3320 and targets at 1.3380 and 1.3400.
USD/JPY
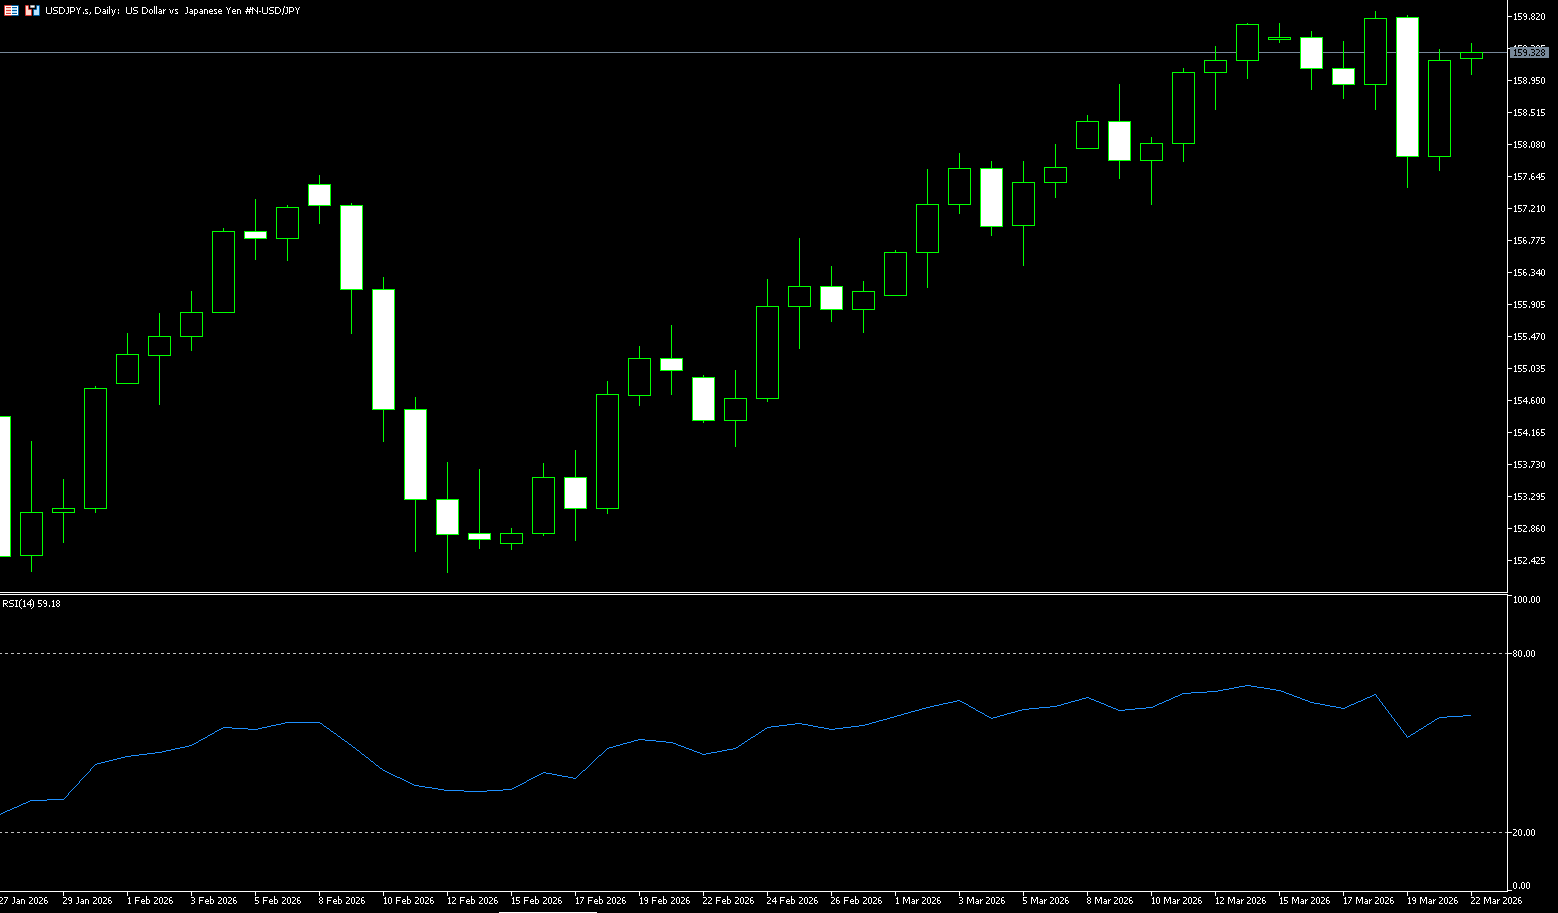
Last week, the USD/JPY pair traded in a range at high levels, having earlier touched near 160, supported by the Bank of Japan's (BOJ) inclination to tighten monetary policy in response to inflationary pressures from soaring oil prices linked to the Middle East conflict. The USD/JPY pair experienced heavy selling on Thursday, falling to around 159.00 in the first half of the European session, erasing most of the gains from the previous day's high since July 2024. The yen strengthened to 157.50 after Governor Kazuo Ueda's post-meeting press conference, following the BOJ's decision to keep interest rates unchanged. The BOJ kept its policy rate at 0.75% as expected, despite a dissenting opinion from board member Hajime Takada, who suggested raising the rate by 25 basis points to 1% if inflation risks rise—the second consecutive meeting to make such a suggestion. BOJ Governor Ueda also stated that a rate hike remains possible if the economic slowdown caused by the Iranian conflict proves temporary and core inflation persists. The yen further benefited from falling oil prices after US President Donald Trump ruled out the possibility of deploying ground troops to the Middle East and Israeli Prime Minister Benjamin Netanyahu pledged not to launch additional attacks on Iranian energy infrastructure.
The USD/JPY pair traded in a generally strong, high-level consolidation pattern last week, dominated by bulls but facing resistance from the 160 level and expectations of Japanese intervention. The pair continued its upward trend since March, closing positive for the week. On the daily chart, it consolidated at high levels, with short-term moving averages in a bullish alignment, maintaining a healthy medium-term uptrend. Last week's low was 157.50, while the high reached 159.75 (the monthly peak on March 13th). Short-term moving averages (5-day and 10-day) are in a bullish alignment, providing strong support for the exchange rate, with pullbacks failing to break below these support levels. Meanwhile, medium-term moving averages (20-day and 50-day) are diverging upwards, with the 50-day moving average continuing to provide support, confirming the medium-term bullish trend. Technical indicators show the daily RSI (14) remaining in the 55-60 range, neutral to slightly bullish, with no obvious overbought divergence, indicating further room for bullish momentum. The MACD lines are running above the zero line, with the red bars showing moderate expansion, confirming bullish dominance. Support lies in the 157.50-157.70 area (weekly low, strong support), provided by the USD/JPY interest rate differential and hawkish expectations from the Fed. A break below this level would open downside potential to the 156.55 (50-day moving average) and the 156.00 (psychological level). On the upside, the first target, tested multiple times this week, is the short-term strong resistance at 159.00 (psychological level), followed by 159.90 (March 18 high) and 160.00 (psychological level); a break above these levels would target 160.50 and the 161.30 (June 2024 high).
Today, consider shorting the US dollar at 159.50, with a stop-loss at 159.70 and targets at 158.00 and 157.80.
EUR/USD
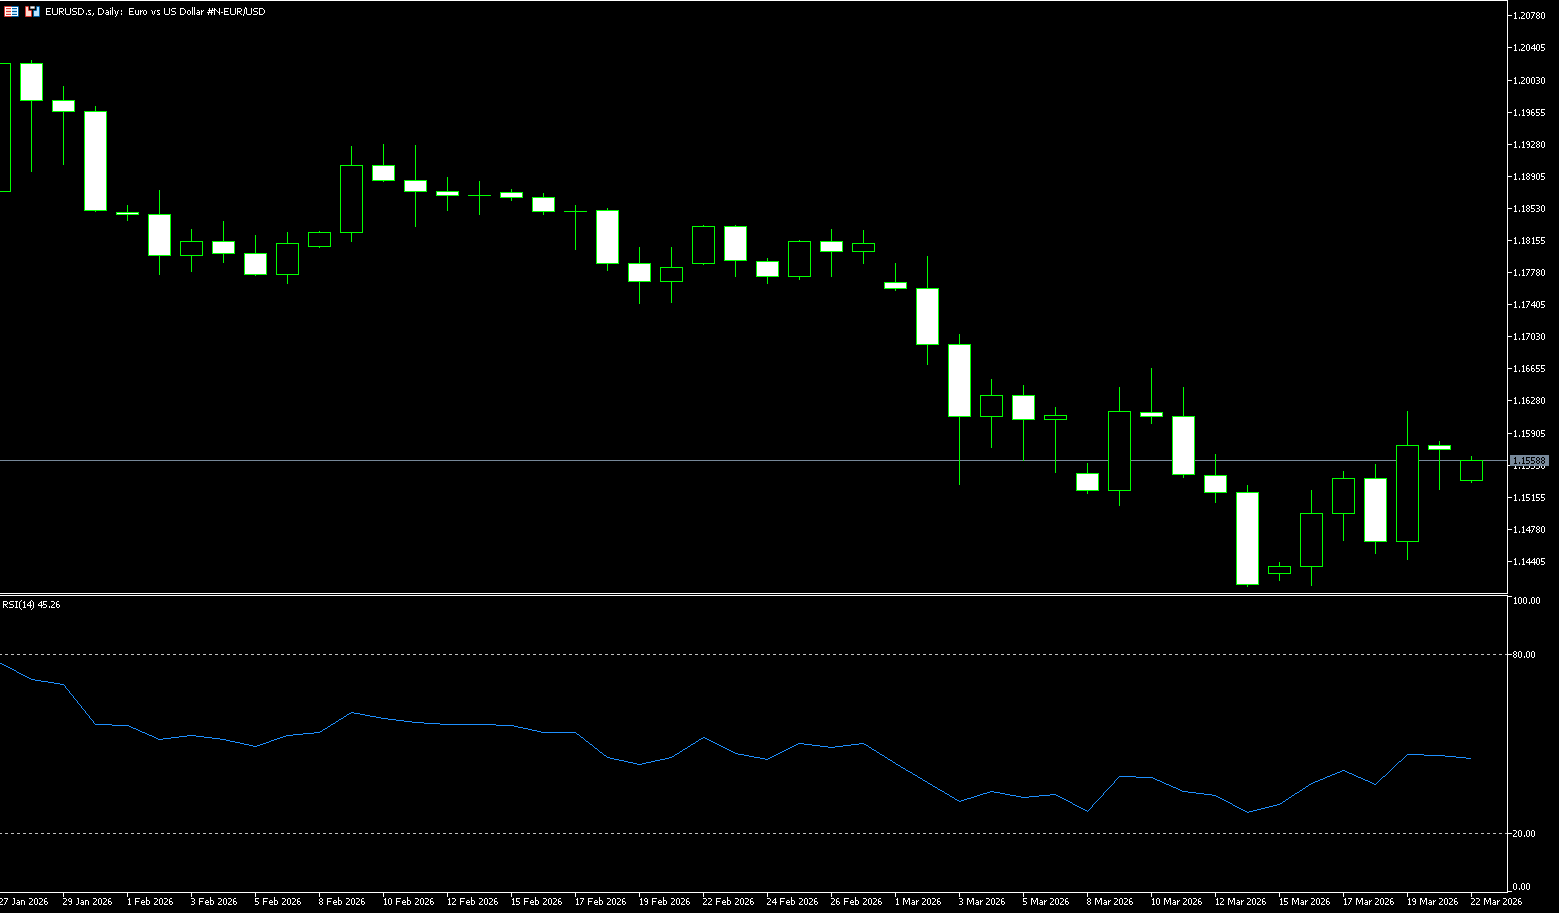
Last week, the EUR/USD pair retreated from its weekly high of 1.1616 reached on Thursday, currently trading around 1.1550 before the weekend. The major currency pair corrected as the dollar attempted a rebound after a sharp sell-off. In late last week, the dollar index fell more than 1% to near 99.00 after major central banks warned of upside risks to inflation and signaled an extended pause following energy price increases caused by the Middle East conflict. This eased market concerns about a wider policy divergence between the Federal Reserve and other global central banks. The European Central Bank decided to keep interest rates unchanged on Thursday, citing price and economic uncertainty stemming from the joint US-Israel military action against Iran. Furthermore, ECB President Christine Lagarde warned at a press conference that "rising energy prices will push inflation above 2% in the near term." Meanwhile, Reuters reported during North American trading hours on Thursday that the European Central Bank (ECB) might discuss raising interest rates in April, and could take action at its June meeting if energy prices remain high. This boosted the euro significantly. To gain more clues about the ECB's monetary policy outlook and to clarify reports of a possible April rate hike, investors will be watching comments from officials who typically comment on future monetary conditions after policy announcements.
The euro traded in a generally downward, weak consolidation pattern against the dollar last week, primarily influenced by the divergence in monetary policies between the US and Europe, a dollar rebound, and technical breakdowns. It mainly fluctuated between 1.1530 and 1.1620 last week, briefly rising to around 1.1616 before retreating. Initially boosted by hawkish ECB expectations, it weakened in the latter half of the week as the dollar index rebounded and US Treasury yields rose, exhibiting a "rise and fall, weak consolidation" pattern. The weekly chart closed with a small bearish candle with upper and lower shadows, breaking below short-term moving average support, and the RSI fell below 50, indicating a weakening short-term trend. Key Technical Analysis (Multi-Timeframe): Since the March high of 1.1670, a short-term downward channel has formed, with strong resistance at 1.1600–1.1620. Regarding the moving average system, the 5-day and 10-day moving averages have turned downwards, and the price has broken below the 20-day moving average (approximately 1.1627), forming a short-term bearish alignment; the 5-day moving average (approximately 1.1531) provides medium-term support. After a death cross on the daily MACD, the green bars continue to expand, indicating dominant bearish momentum; the DIFF and DEA are diverging below the zero line, suggesting a bearish trend. The 14-day RSI has fallen to around 44, in a weak zone but not oversold, suggesting further downside or a slight rebound potential. This week, the euro is likely to consolidate within the 1.1500 (psychological level) – 1.1616 (last week's high) range. A break below 1.1530-1.1500 would likely lead to further declines towards the 1.1414 (last week's low) and 1.1400 (psychological level) support. Conversely, holding above 1.1530-1.1500 could lead to a recovery towards 1.1616; a break below this level could extend the medium-term correction to around 1.1700.
Today, consider going long on the euro at 1.1560, with a stop-loss at 1.1550 and targets at 1.1630 and 1.1620.
Disclaimer: The information contained herein (1) is proprietary to BCR and/or its content providers; (2) may not be copied or distributed; (3) is not warranted to be accurate, complete or timely; and, (4) does not constitute advice or a recommendation by BCR or its content providers in respect of the investment in financial instruments. Neither BCR or its content providers are responsible for any damages or losses arising from any use of this information. Past performance is no guarantee of future results.
More Coverage


Risk Disclosure:Derivatives are traded over-the-counter on margin, which means they carry a high level of risk and there is a possibility you could lose all of your investment. These products are not suitable for all investors. Please ensure you fully understand the risks and carefully consider your financial situation and trading experience before trading. Seek independent financial advice if necessary before opening an account with BCR.
BCR Co Pty Ltd (Company No. 1975046) is a company incorporated under the laws of the British Virgin Islands, with its registered office at Trident Chambers, Wickham’s Cay 1, Road Town, Tortola, British Virgin Islands, and is licensed and regulated by the British Virgin Islands Financial Services Commission under License No. SIBA/L/19/1122.
Open Bridge Limited (Company No. 16701394) is a company incorporated under the Companies Act 2006 and registered in England and Wales, with its registered address at Kemp House, 160 City Road, London, City Road, London, England, EC1V 2NX. This entity acts solely as a payment processor and does not provide any trading or investment services.

 English
 简体中文
简体中文
 繁體中文
繁體中文
 Bahasa
Melayu
Bahasa
Melayu
 Tiếng
Việt
Tiếng
Việt
 ไทย
ไทย
 日本語
日本語
 한국어
한국어
 ភាសាខ្មែរ
 español