


0
US Dollar Index
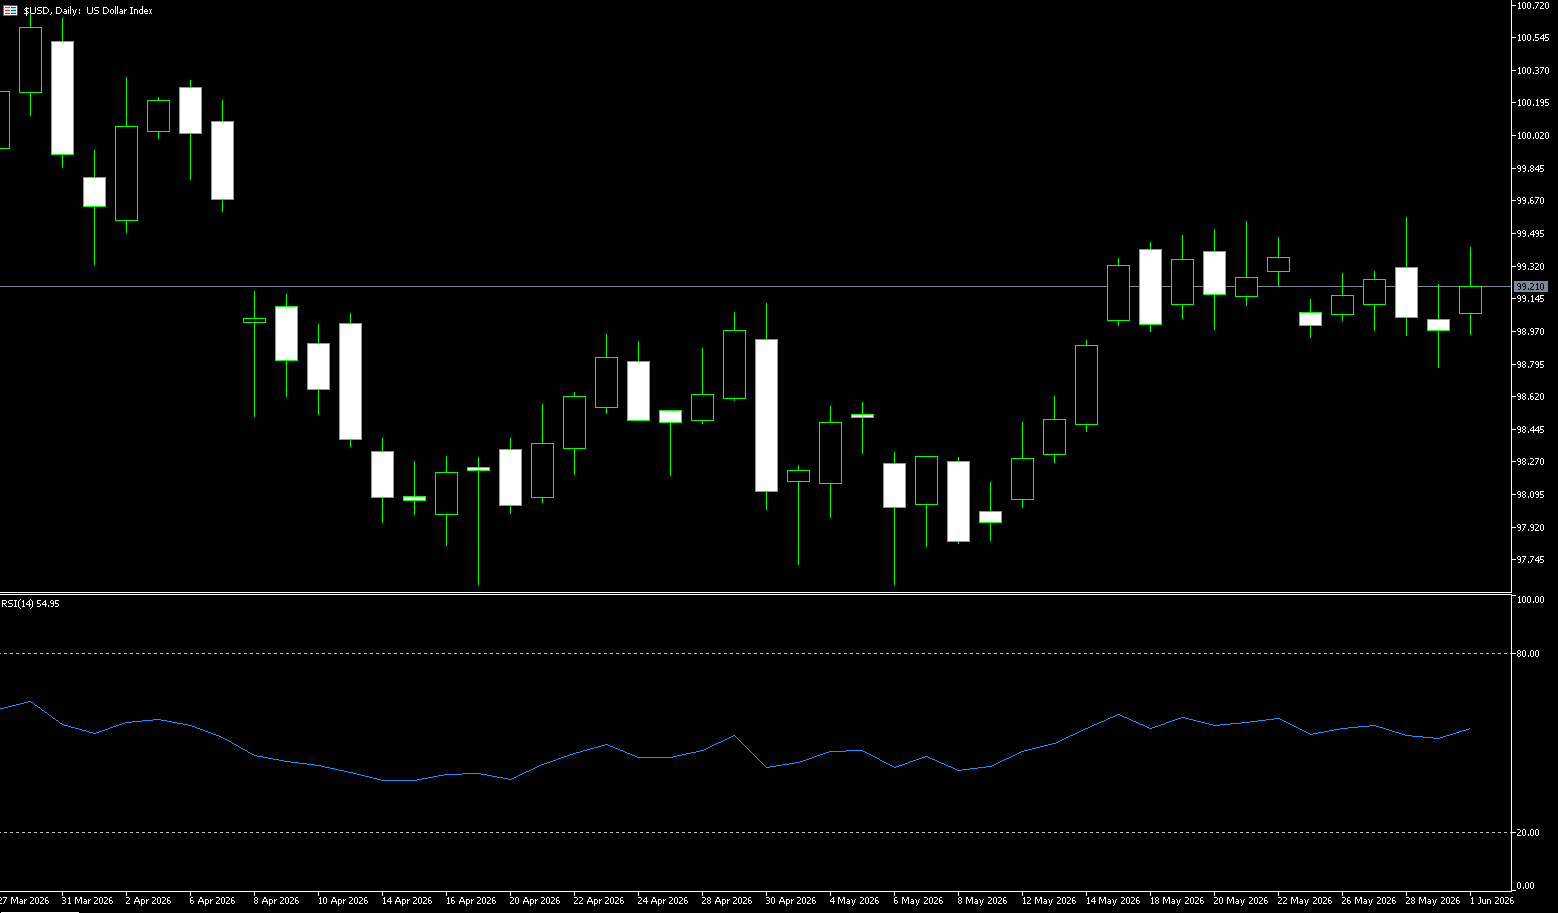
The US dollar index hovered slightly above 99 on Monday, ending a two-day losing streak, as the prospects for a long-term ceasefire agreement between the US and Iran remained uncertain. Over the weekend, Washington and Tehran exchanged proposals seeking revisions to a draft law that would extend the ceasefire and reopen the Strait of Hormuz, although there were few signs that negotiations were close to a breakthrough. President Donald Trump also reiterated his demand that Iran suspend its nuclear program and fully restore the strait's status as an open international waterway. Investors also turned their attention to the highly anticipated US non-farm payrolls report, which is expected to provide new clues about labor market conditions and the Federal Reserve's policy outlook. With inflation accelerating, the market is increasingly pricing in the possibility of a Fed rate hike this year, marking a significant shift from earlier expectations of lower interest rates.
Another uneventful trading week saw the dollar retreat slightly, but the decline was limited. Geopolitics remained the focus of market attention, especially after reports over the previous weekend that the US and Iran had allegedly reached an agreement to extend the current 60-day ceasefire. Against this backdrop, the US dollar index remained near the upper end of its recent range around 99.00, while US Treasury yields declined across most maturities as investors reassessed geopolitical risks and reduced some of the more aggressive tightening expectations that emerged earlier this month. Initial resistance is seen near 99.71 (the upper Bollinger Band), a break above which could lead to a further challenge of the psychological level of 100 and the 100.29 area (the April 6 high). Key support levels are at 98.79 (the middle Bollinger Band), 98.58 (the 200-day moving average), and around 98.20.
Consider shorting the US dollar index at 99.30 today, with a stop-loss at 99.40 and targets at 98.70 and 98.80.
WTI Crude Oil
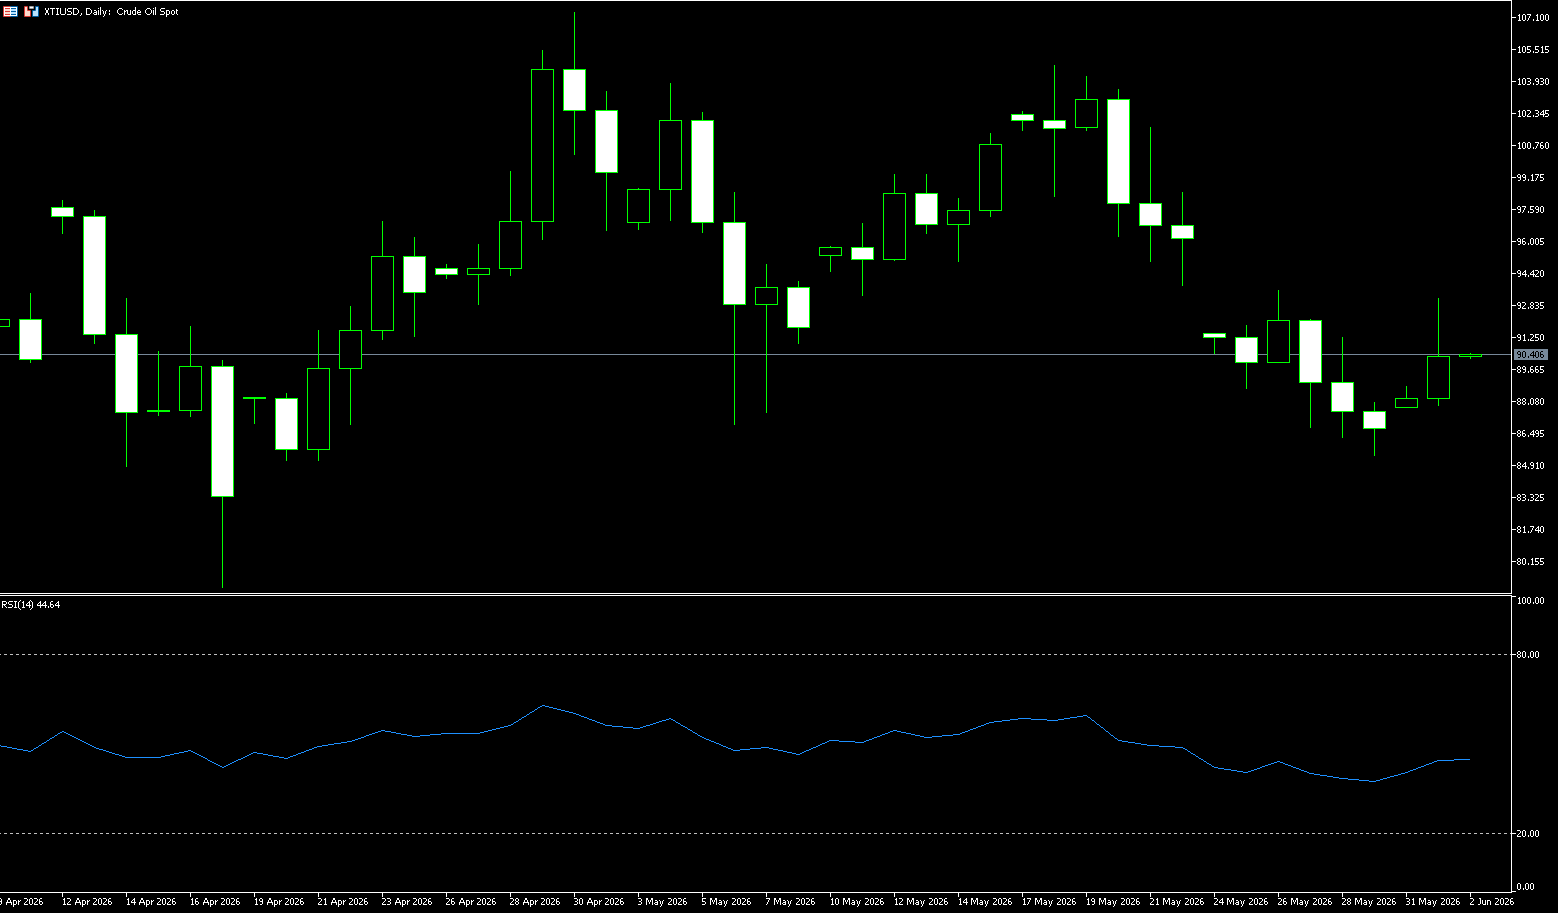
Oil prices retreated some gains on the first trading day of June but still rose sharply, with WTI crude oil up 5% and trading above $90.50 per barrel. Prices initially surged after Iranian media reported that Tehran had suspended communication with Washington in response to the Lebanese attack and was preparing to completely close the Strait of Hormuz, fueling concerns about further disruptions to global oil supplies. However, prices retreated from intraday highs after US President Trump stated that Israel and Hezbollah had agreed to cease attacks on each other in Lebanon and that discussions with Iran were continuing. Trump also downplayed Iran's decision to suspend indirect negotiations, stating he was not concerned about whether the talks ended. Nevertheless, market anxieties remain high as these developments cast doubt on the prospects of a temporary peace agreement, particularly against the backdrop of renewed clashes between US and Iranian forces near the Strait of Hormuz.
The market has shifted from its previous one-sided optimism regarding a peace agreement to a more cautious risk assessment phase. Before the details of the agreement are clear, the market prefers to retain a certain risk premium, which is one of the key reasons for Monday's oil price rebound. Looking at the daily chart, WTI crude oil is currently still in a wide-range trading pattern. After the previous rapid pullback, prices found significant support near $85.41 (last week's low) and $85.00 (a psychological level), indicating that buying power remains. The $92 (psychological level) and $91.74 (9-day moving average) areas constitute the current important resistance levels. If a breakout above $92.00-$91.74 is achieved, a further upward move towards the resistance area near $94.74 (50-day moving average) is possible; otherwise, the market may continue its range-bound trading. The RSI indicator has started to rise from the neutral zone, indicating improved market sentiment; the MACD indicator is gradually narrowing its decline, showing signs of weakening short-term bearish momentum.
Today, consider going long on crude oil at 90.60, with a stop-loss at 90.40 and targets at 92.00 and 93.00.
Spot Gold
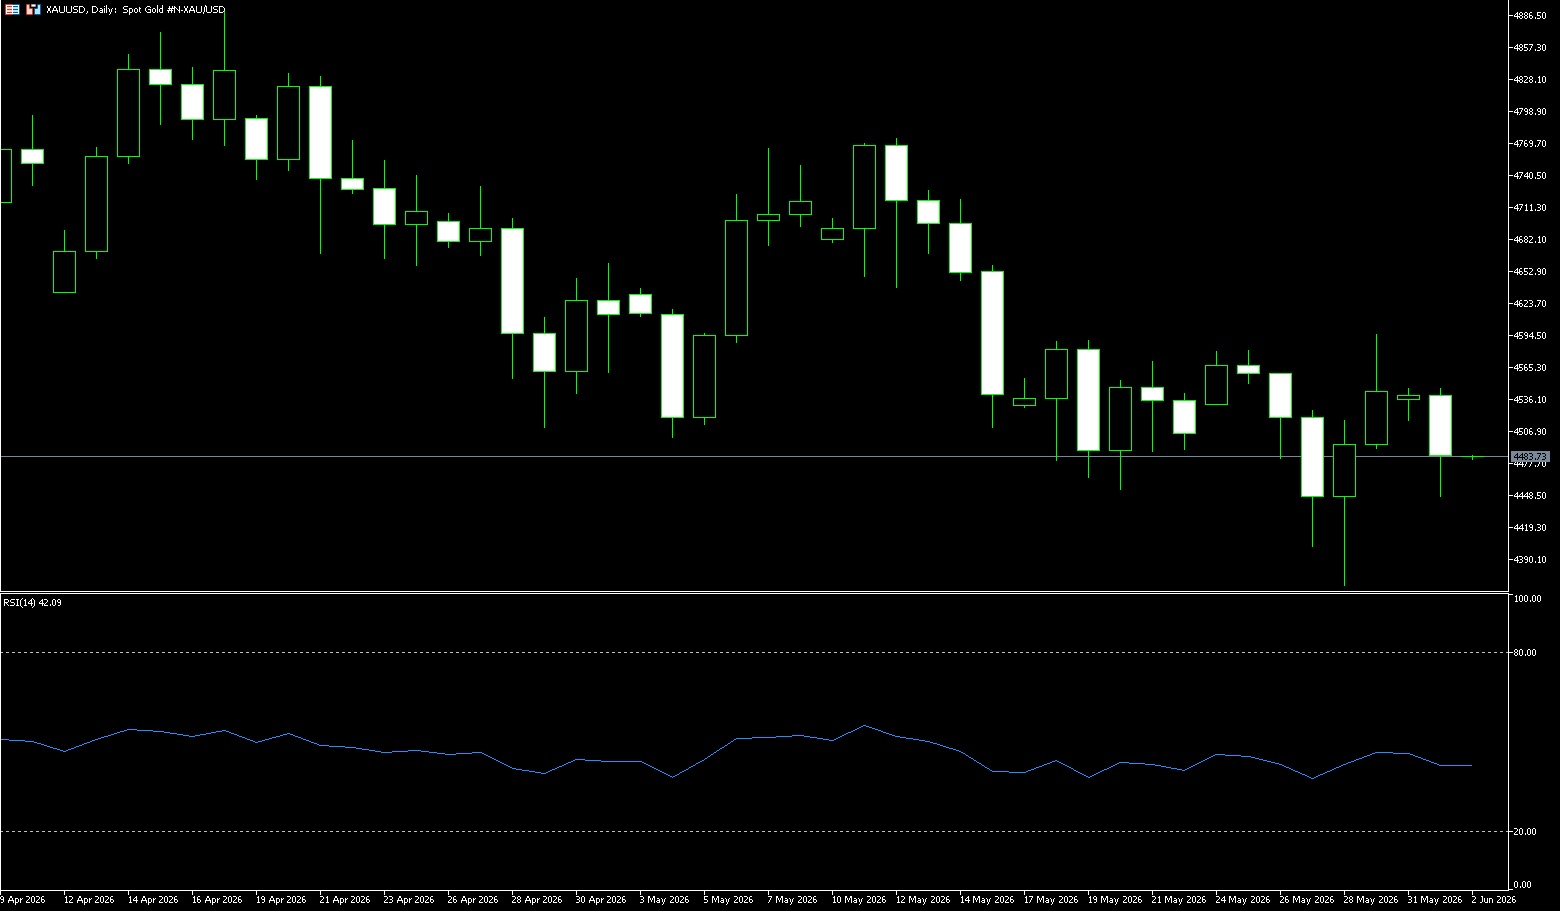
Gold prices relinquished earlier gains on the first trading day of June, falling to $4,470 per ounce, near their lowest level since the end of March. Oil prices surged as tensions between Iran and the United States escalated, and Iran decided to halt communication with the US in protest against Israel's attack on Lebanon, exacerbating inflation concerns and strengthening market expectations that central banks will maintain high interest rates for an extended period. Over the weekend, the two sides exchanged proposals to amend the draft agreement to extend the ceasefire and reopen the Strait of Hormuz, but it remains unclear whether any substantial progress was made. Market participants now assess the probability of at least one US rate hike before the end of the year at around 60%. Investors are turning their attention to this week's US jobs data and upcoming speeches by Federal Reserve officials. In his first public speech since ending his term as Fed chairman on May 15, President Jerome Powell warned of the dangers of politicizing central banks.
From a technical perspective, spot gold rebounded sharply last week from a two-month low near $4,365, indicating that bullish momentum is still building. On the daily chart, gold is trading slightly below $4,500. The metal remains under pressure in the short term as prices continue to fall below the 20-day simple moving average of $4,585 and the 50-day simple moving average of $4,628, but remain above the more distant 200-day simple moving average of $4,411. This configuration suggests a corrective bearish bias within a broader uptrend, with the Relative Strength Index (RSI) around 43, suggesting moderate but not extreme downward momentum. On the upside, initial resistance is located near the 20-day simple moving average of $4,585, followed by the 50-day simple moving average at $4,628, and then the $4,700 level. On the downside, short-term focus is on the $4,450 pivot area near the current price, followed by stronger support at $4,425. If selling pressure intensifies, the 200-day simple moving average near $4,411 will act as a deeper structural support level.
Consider going long on gold today at $4,478, with a stop-loss at $4,473 and targets at $4,530 and $4,540.
AUD/USD
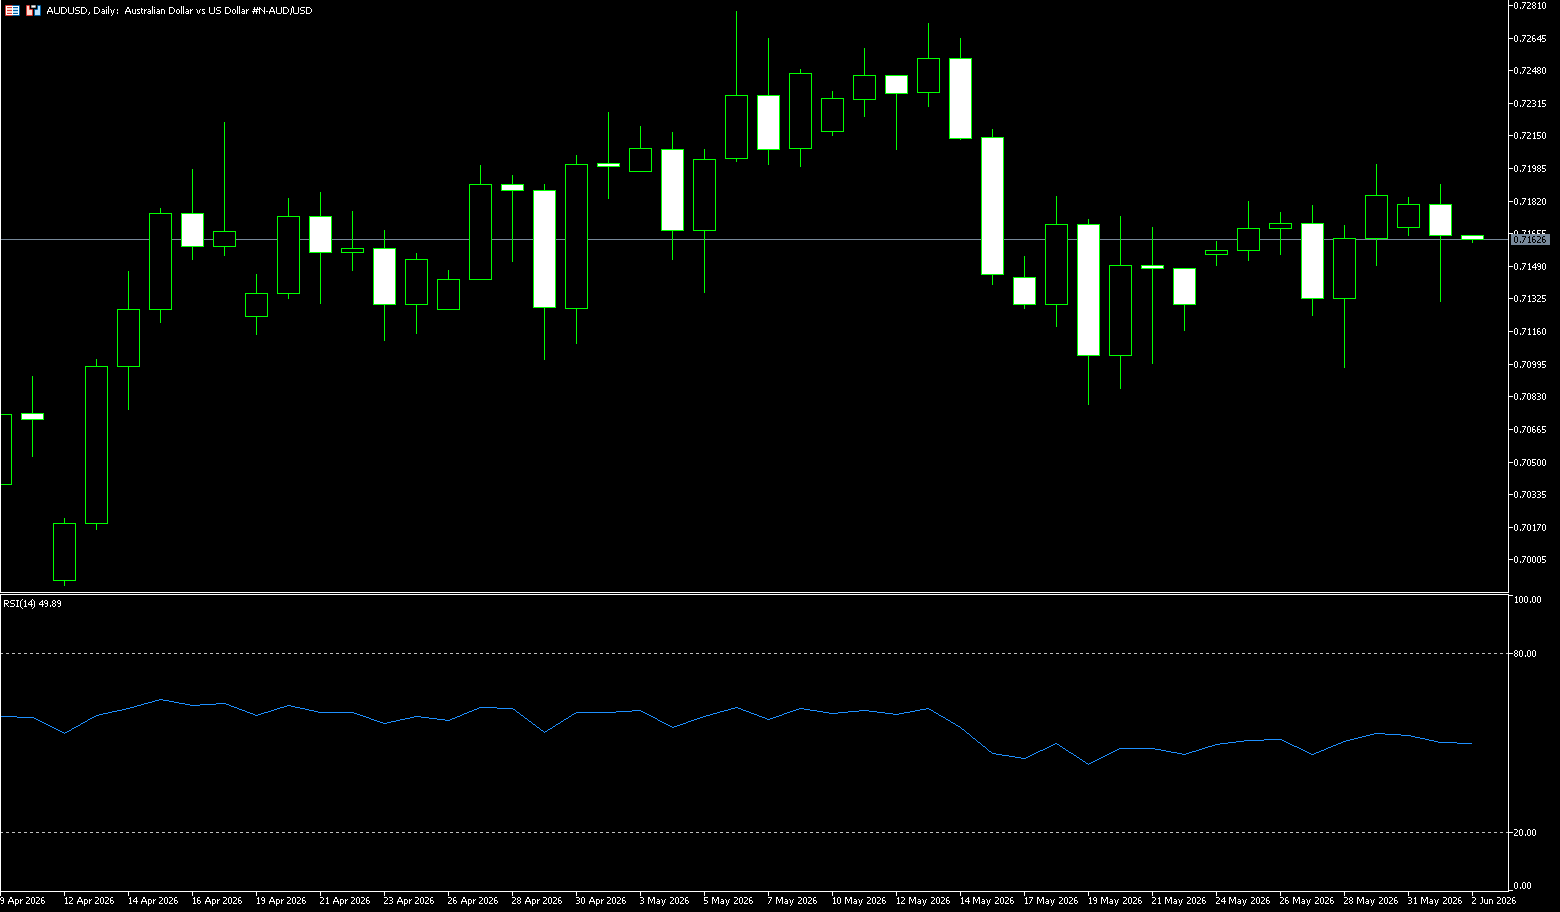
The Australian dollar traded flat on Monday at US$0.7160, near a two-week high, as markets awaited progress in Middle East peace talks and a series of key domestic data releases later this week. Key data, including the April trade balance and first-quarter current account and GDP figures, are expected to provide insights into the underlying momentum of the economy and help shape expectations for the Reserve Bank's policy outlook. The central bank has already raised interest rates three times this year, and recent disappointing employment and inflation data have significantly reduced investors' bets on another rate hike in June, currently pricing in only about a 5% probability. The market still expects a 70% chance of a final rate hike to 4.6% in the last quarter of the year. Meanwhile, global oil prices continue to rise, and the safe-haven dollar is strengthening as a ceasefire agreement between the US and Iran remains elusive, tensions in the Middle East remain high, and efforts to reopen the Strait of Hormuz have made little progress.
Spot prices have remained constrained after recently breaking below the 0.7150-0.7160 confluence zone—an area that includes the 100-period simple moving average on the 4-hour chart and the 23.6% Fibonacci retracement level of the March-May upward move. This strengthens the tight resistance zone above. Despite several failures to break below the 38.2% Fibonacci retracement level, caution is advised for AUD/USD bears, and they should be cautious before positioning for a deeper decline. Furthermore, momentum indicators are slightly constructive, with the Relative Strength Index (RSI) hovering around 53 and the Moving Average Convergence Divergence (MACD) line slightly positive. However, this only suggests that the pressure has stabilized and has not yet clearly broken through the existing upper limit. Therefore, a sustained hold above the psychological resistance area of 0.7200 is needed to alleviate the current pressure and expose the next resistance level around 0.7270, the four-year high reached earlier this month. On the downside, initial support lies at the 38.2% Fibonacci retracement level of 0.7109, followed by deeper retracement support at 0.7056. A decisive break below the latter would reopen the path to the 0.7000 (psychological level) support level.
Consider going long on the Australian dollar at 0.7150 today, with a stop loss at 0.7140 and targets at 0.7200 and 0.7210.
GBP/USD
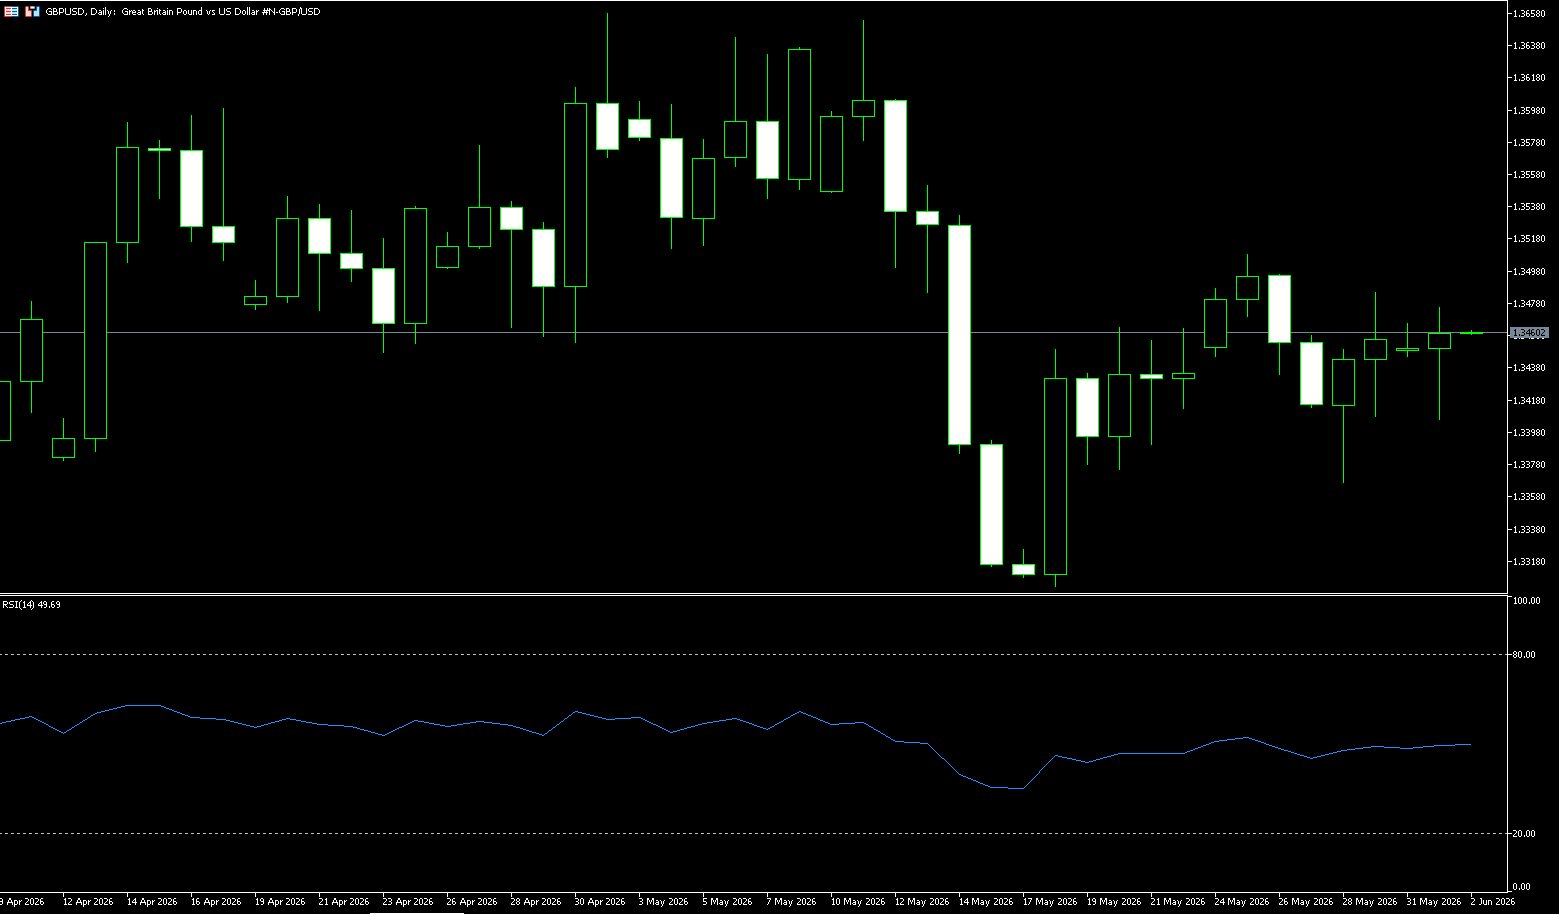
The GBP/USD pair struggled to capitalize on the strong rebound following Thursday's 18-week low, starting the new week in a narrow range around 1.3450-1.3460. The US dollar regained some positive momentum amid uncertainty surrounding a potential US-Iran peace deal and hawkish bets from the Federal Reserve, considered a key resistance factor limiting further gains in spot prices. On the other hand, the pound was pressured by market expectations that the Bank of England would postpone interest rate hikes, particularly after weak inflation data and an unexpected rise in unemployment. However, traders are waiting for this week's important US macroeconomic data releases and a public appearance by Bank of England Governor Andrew Bailey before positioning themselves for the next directional move in GBP/USD. On the monetary policy front, investors have slightly lowered their expectations for further interest rate hikes by the Bank of England this year, as oil prices retreated from four-year highs and recent UK data showed signs of a cooling labor market, lower-than-expected inflation, and slowing economic activity.
From a technical perspective, spot prices are capped below the 200-period simple moving average (SMMA) at 1.3500 on the 4-hour chart, which should continue to act as overhead resistance. However, the uptrend line support near 1.3356 has solidified the overall uptrend. Meanwhile, momentum indicators are slightly positive, but more indicative of stabilizing downward pressure than a clear bullish shift in GBP/USD. In fact, the Relative Strength Index (RSI) is hovering above 50, while the Moving Average Convergence Divergence (MACD) is slightly positive. This suggests that further gains are more likely to encounter strong resistance near the psychological level of 1.3500 (the 200-period SMMA). A sustained break above this resistance would open a path to higher levels towards 1.3551 (the May 13 high). On the downside, the next significant support level coincides with the previous uptrend support line, around 1.3356, where buying is expected on a deeper pullback. A decisive break below this area would suggest a more pronounced deterioration in the medium-term bullish structure towards the 1.3300 level.
Consider going long on GBP at 1.3445 today, with a stop-loss at 1.3435 and targets at 1.3480 and 1.3490.
USD/JPY
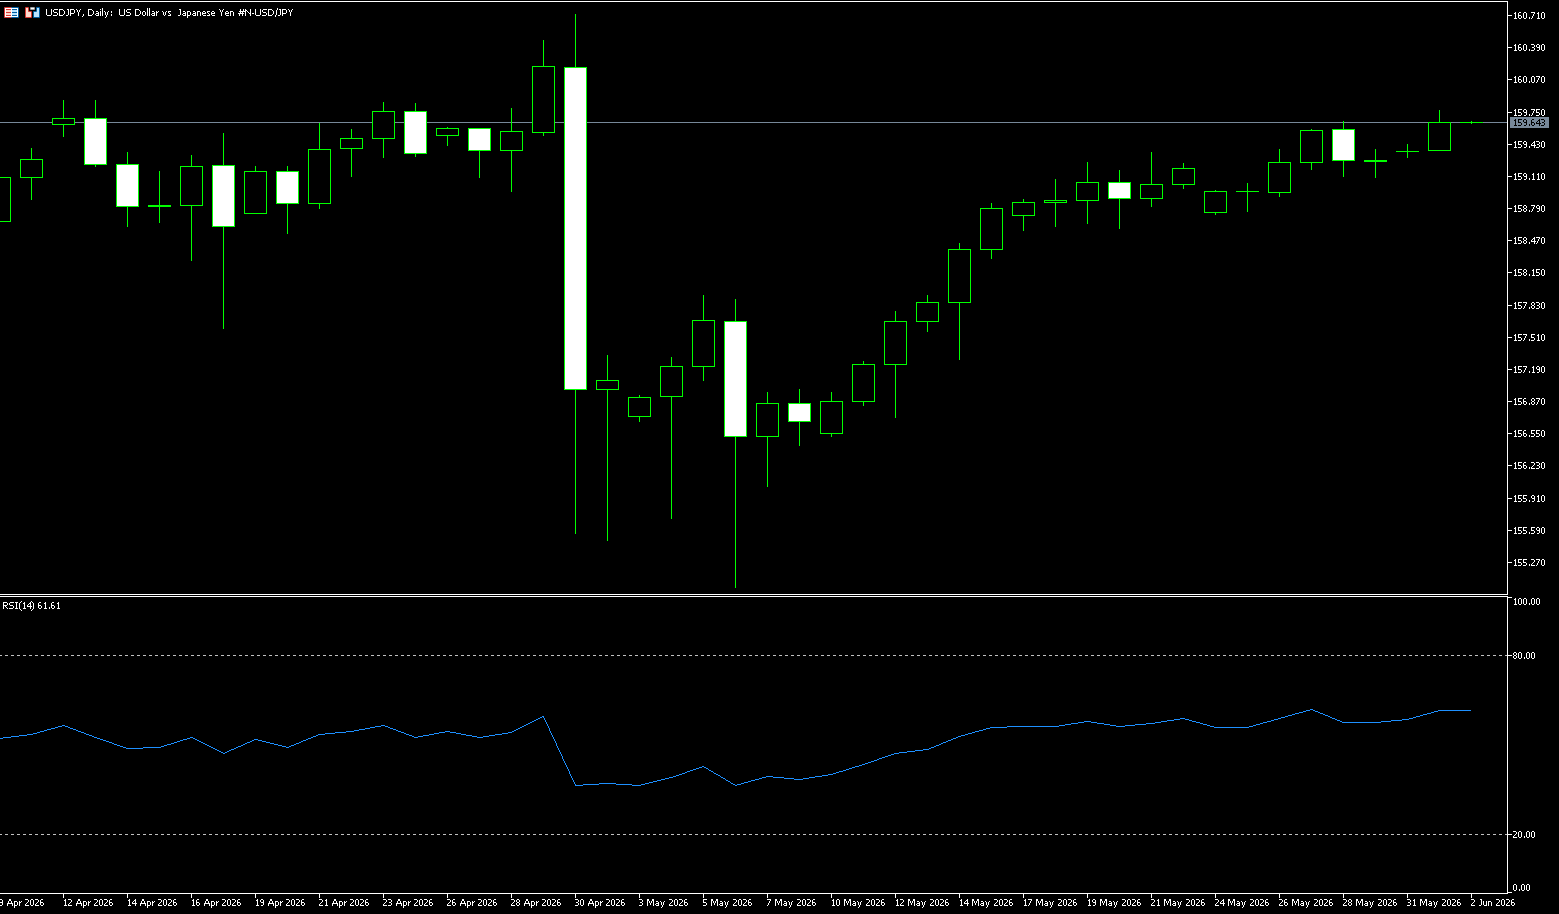
The yen traded around 159.60 per dollar on Monday, continuing to be under pressure and hovering near the closely watched 160 level, which previously triggered official intervention to support the currency. Data released on Friday showed that Japanese authorities spent 11.7 trillion yen in foreign exchange market intervention at the end of April, confirming widespread market speculation. On the policy front, investors are divided on whether the Bank of Japan will raise interest rates again this month, as policymakers weigh the growing uncertainty associated with Middle East tensions. Market participants are now awaiting a speech later this week from Bank of Japan Governor Kazuo Ueda for further insights into the central bank's policy outlook. Meanwhile, Japan's first-quarter capital spending was flat year-on-year, indicating a slowdown in corporate investment and raising concerns about the strength of domestic economic momentum.
Historical experience shows that when the USD/JPY pair rapidly approaches or breaks through key psychological levels, Japanese authorities often strengthen verbal warnings or even take actual intervention measures to slow the yen's depreciation. Therefore, although the USD/JPY pair maintains an overall upward trend, investors remain cautious about chasing the rally. From the daily chart, the USD/JPY pair maintains a clear upward structure. The exchange rate has been consistently trading above major moving averages, and the medium- to long-term trend remains bullish. The 158.00 area forms a significant recent support level, while the 160.00 level is a key psychological resistance level. A successful break above 160.00 could see the market further test the 161.50 or even 163.00 area; a pullback below 159.00 could trigger a correction towards the 158 level. The RSI indicator remains above 57, indicating that bullish momentum still dominates. The MACD indicator continues above the zero line, with the red bars gradually expanding, reflecting increased upward momentum in the market.
Consider shorting the US dollar at 159.85 today, with a stop loss at 159.98 and targets at 158.90 and 158.80.
EUR/USD
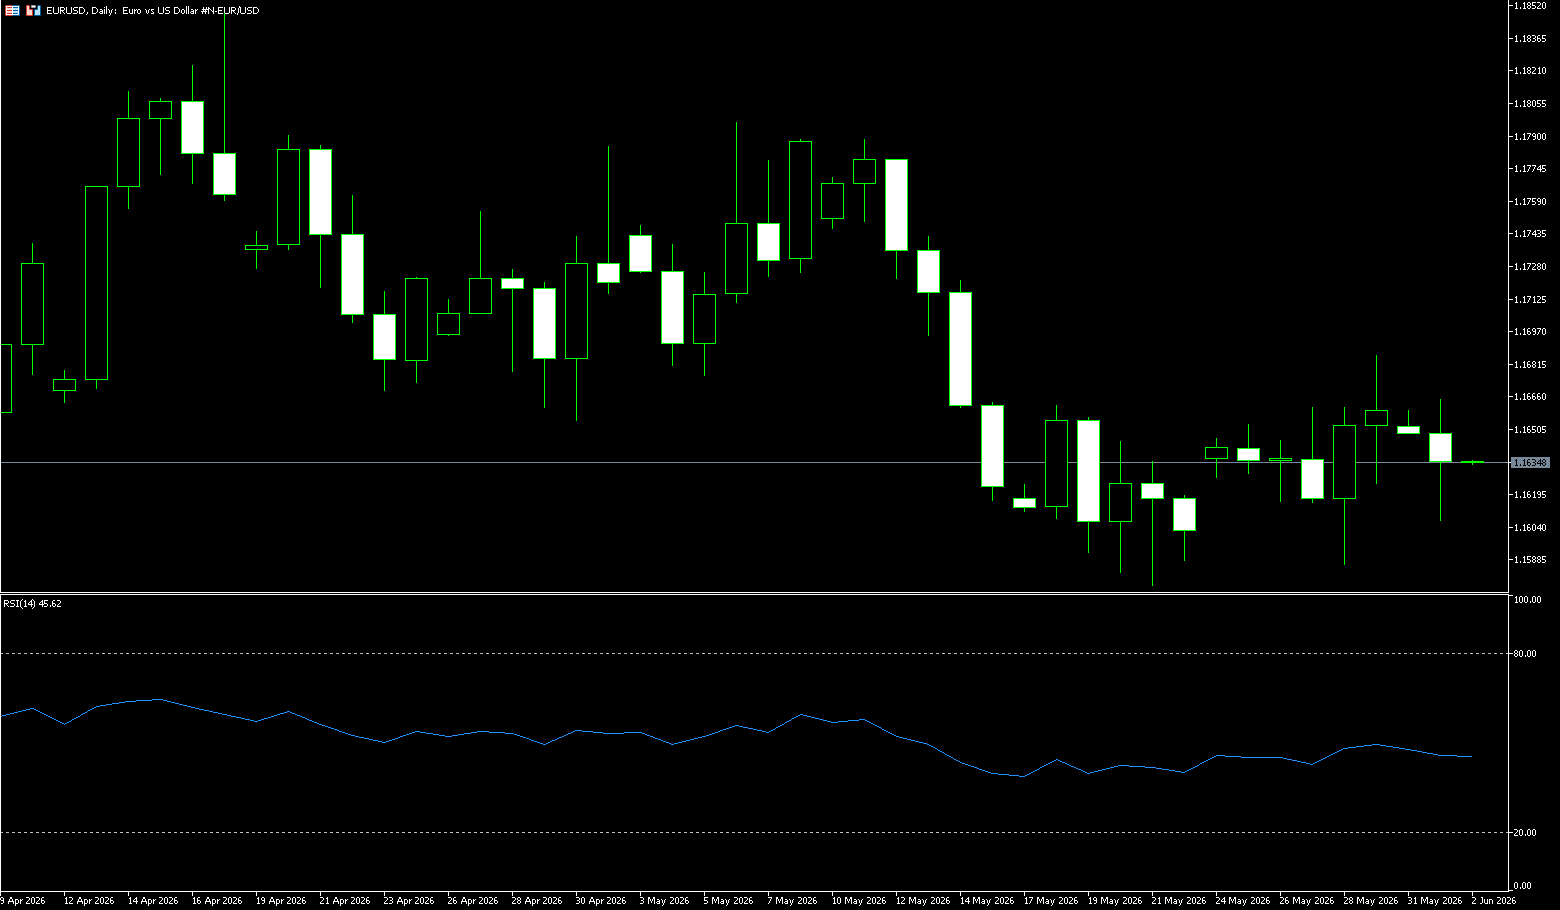
The EUR/USD pair extended its gains from the 1.1585 support level over the past two days, trading mixed and relatively flat before the European session on Monday. Spot prices are currently slightly above the 1.1600 midpoint, having been almost unchanged for the day, stabilizing after better-than-expected German retail sales data. Official data released by the German Federal Statistical Office (Destatis) showed that German retail sales, a key indicator of consumer spending, fell again by 0.3% in April. However, this was slightly better than the market consensus of a 0.4% decline and in line with the revised -0.3% in March. The EUR/USD pair received some support from the optimistic macroeconomic data, but a generally stronger dollar limited any substantial upside. Meanwhile, recent developments pushed oil prices to extend their slight recovery from Friday's more than one-month low, exacerbating inflation concerns and reaffirming market bets on a Federal Reserve rate hike in 2026. This outlook provided another supporting factor for the dollar.
From a technical perspective, the EUR/USD exchange rate is holding above the 23.6% Fibonacci retracement level of the April-May decline. Furthermore, the Relative Strength Index (RSI) is around 50, and the Moving Average Convergence Divergence (MACD) is slightly positive, suggesting improved momentum. Therefore, any subsequent gains are more likely to encounter immediate resistance near the 38.2% Fibonacci retracement level, around the 1.1675-1.1680 area. Next is the confluence point at 1.1710. This area should limit short-term bias, and a break above it could see the EUR/USD target the 61.8% retracement level around 1.1740. On the downside, immediate support lies at the 23.6% retracement level at 1.1638, with deeper support at 1.1600 (a psychological level); a break below this point would reopen a broader bearish phase.
Today, consider buying EUR/USD at 1.1620, with a stop-loss at 1.1610 and targets at 1.1670 and 1.1680.
Stock Analysis:
Australian ASX 200 Stock Index
Basic Market Overview:
The Australian Securities Exchange (ASX) 200 index was little changed on Monday, the first trading day of June, closing at 8729 points, after a rebound in the previous session. Gains in technology services, healthcare, and business services offset declines in processing and consumer services. Traders are bracing for a busy week of domestic data releases, including first-quarter business inventories, corporate gross profits, and gross domestic product (GDP). April trade data will also be released after exports fell in March, but imports surged. Meanwhile, the latest data showed that job advertisements rose for the first time in three months in May, while the monthly inflation gauge fell 0.3% month-on-month, the first decline since February. In the US, stock index futures rose slightly after President Donald Trump said Tehran “really wants to get a deal that’s good for the US and its allies.”
Sector Performance:
Leading Gains: Information Technology (+2.1%): Breaking a four-month high, driven by an overnight surge in US software stocks. Healthcare (+0.8%): Some leading stocks rebounded. Materials (+0.5%): BHP Billiton hit a record high.
Lagging: Utilities (-0.3%): Interest rate sensitive, under short-term pressure. Financials (-0.2%): Bank stocks diverged, insurance was weak. Consumer Staples (-0.2%): Defensive sectors saw capital outflows.
Outstanding performers: SiteMinder +10.8%; CATCatapult +10.0%; Pro Medicus +9.2%; Nuix +9.0%; Wisetech Global +8.7% (Technology)
Technical Analysis:
The ASX200 index is showing a high-level consolidation pattern with strong momentum but nearing overbought levels. In the short term, it is likely to consolidate within the 8,600–8,900 range. A key breakout/breakdown will determine the subsequent direction.
Technical indicators: SI (14) is at 53.20: neutral to bullish, bullish momentum remains but a pullback should be watched out for; MACD (12,26): upward after a golden cross, the histogram is positive, the medium-term bullish trend continues; as for STOCH (9,6)=84.2: overbought zone, the probability of a short-term pullback increases; ADX (14)=38.4: moderate trend strength, no obvious divergence. On the other hand, regarding the moving average system: short-term (20/50-day moving average): flat/slightly rising, support weakens; long-term (100/200-day moving average): upward, the medium-to-long-term upward trend remains intact. Therefore, in the short term, the ASX200 index will oscillate in the 8,600–8,900 range. RSI is close to overbought, STOCH is overbought, short-term pullback pressure is high; however, the 50-day moving average and the lower rail of the upward channel provide strong support, making a deep fall unlikely.
Trading Strategy:
The ASX200 is currently in a high-level consolidation phase within a medium-to-long-term uptrend. While the bullish trend remains intact, short-term overbought conditions and increased market divergence pose a risk of a pullback.
Short-term: Range trading. Buy on dips near 8,600, reduce positions near 8,850-9,000; stop-loss below 8,580.
Medium-term: If it holds above 9,000, add to positions with a target of 9,200; if it falls below 8,500, switch to a wait-and-see approach or consider a small short position.
Key Risk Warnings:
Weaker-than-expected Chinese demand (resources), unexpected RBA rate hike, and the spillover effect of a US stock market correction.
Japan Stock Market Index (JP225)
Basic Market Overview:
The Nikkei 225 rose 0.8% on Monday to approximately 66,900 points, a new high, as technology stocks continued their upward momentum fueled by continued enthusiasm for an AI-driven rebound. Japanese companies are deeply involved in the expansion of global artificial intelligence infrastructure, helping the domestic market become one of the strongest beneficiaries of the global technology boom. On the economic front, Japan's capital expenditure in the first quarter was flat year-on-year, indicating a slowdown in corporate investment activity. Investors are also closely watching developments in the Middle East, where negotiations between the US and Iran on a permanent ceasefire agreement continue to face significant challenges.
Sector Performance:
Leading Gainer: Kioxia Holdings, up 8.3%,
SoftBank Group (+4.9%)
Furukawa Electric (+3.1%)
Tokyo Electron (+2.7%)
Sumitomo Electric Industries (+2.2%)
Leading Declines: Nissan (7201) -5.0%
Honda (7267) -4.3%
Toyota (7203) -1.8%
Technical Analysis:
Last week (May 26 – June 1), JP225 exhibited a strong bullish pattern, first consolidating before accelerating upwards, closing at 66,934 points, a weekly gain of 3.0%. It broke through the 67,000 psychological level for the first time during the session, technically confirming a continuation of the strong upward trend while also indicating overbought conditions. Trend Structure: Strong bullish momentum, accelerating upwards; Regarding the moving average system: the price has stabilized above the 5/10/20-day moving averages, showing a bullish alignment; the short-term moving average (5-day) is diverging upwards, providing strong support. A rising flag pattern was completed mid-week, with a breakout above the upper trendline on Friday, followed by a continued upward surge on Monday, indicating sufficient bullish momentum. Technical indicators: RSI (14): 66.7, approaching the overbought zone (68), with no bearish divergence, indicating a high probability of continued short-term strength. STOCH (9,6): 99.1, severely overbought, suggesting a potential short-term pullback. MACD: After a golden cross above the zero line, the red bars are expanding, indicating continued strengthening of bullish momentum.
Looking ahead to this week, once the JP225 stabilizes above the 65,133 support level, it will challenge 67,231 and target 69,413. A break below 64,700 or a pullback to 63,875 would be a normal correction for the bulls.
Conclusion: The Nikkei 225 is in a strong bullish acceleration phase, with AI/semiconductors/communications dominating the market. A break above 67,000 could lead to a target of 70,000; however, caution is advised regarding high-level divergence and the drag from the automotive sector.
Disclaimer: The information contained herein (1) is proprietary to BCR and/or its content providers; (2) may not be copied or distributed; (3) is not warranted to be accurate, complete or timely; and, (4) does not constitute advice or a recommendation by BCR or its content providers in respect of the investment in financial instruments. Neither BCR or its content providers are responsible for any damages or losses arising from any use of this information. Past performance is no guarantee of future results.
More Coverage


Risk Disclosure:Derivatives are traded over-the-counter on margin, which means they carry a high level of risk and there is a possibility you could lose all of your investment. These products are not suitable for all investors. Please ensure you fully understand the risks and carefully consider your financial situation and trading experience before trading. Seek independent financial advice if necessary before opening an account with BCR.
BCR Co Pty Ltd (Company No. 1975046) is a company incorporated under the laws of the British Virgin Islands, with its registered office at Trident Chambers, Wickham’s Cay 1, Road Town, Tortola, British Virgin Islands, and is licensed and regulated by the British Virgin Islands Financial Services Commission under License No. SIBA/L/19/1122.
Open Bridge Limited (Company No. 16701394) is a company incorporated under the Companies Act 2006 and registered in England and Wales, with its registered address at Kemp House, 160 City Road, London, England, EC1V 2NX. Open Bridge Limited acts solely as a payment processor for BCR Co Pty Ltd and does not provide any financial, trading, or investment services on its behalf. Open Bridge Limited's role is limited to payment processing.

 English
 简体中文
简体中文
 繁體中文
繁體中文
 Bahasa
Melayu
Bahasa
Melayu
 Tiếng
Việt
Tiếng
Việt
 ไทย
ไทย
 日本語
日本語
 한국어
한국어
 ភាសាខ្មែរ
 español

