


0
Currency & Commodity Analysis:
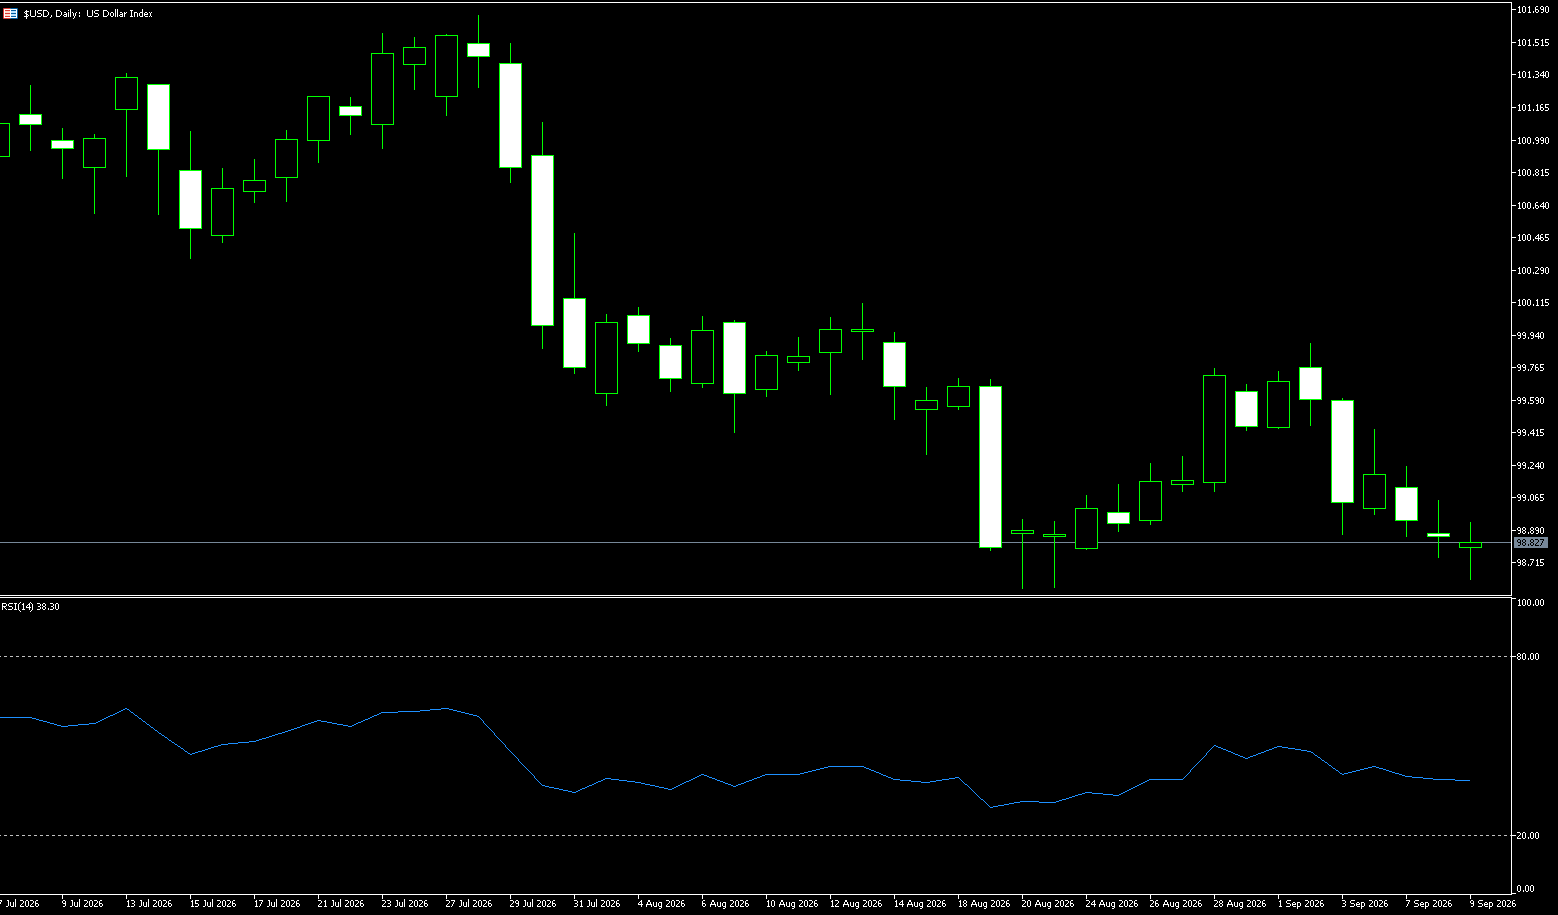
US Dollar Index
The US Dollar Index has held steady near 98.70. Investors remain cautious due to several factors: oil prices hovering at six-week highs, the US 10-year Treasury yield rising to 4.804%, and traders increasing bets—to approximately 60%—on a Federal Reserve rate hike at the September 15–16 meeting following last Friday's strong non-farm payrolls report. The market is awaiting this week's US PPI and CPI data for clearer policy signals. Despite the US economy remaining at full employment, the dollar has generally weakened in the third quarter. Analysts believe that the sharp rise in long-term US Treasury yields is tightening financial conditions and limiting the Fed's room to resume rate hikes. Their fixed-income team expects the Fed to remain on hold this year, keeping the trade-weighted dollar near recent lows. Furthermore, the dollar's weakness is broad-based; so far in the third quarter, all major currencies—with the exception of the Swiss franc—have strengthened against the dollar.
The daily chart shows the US Dollar Index spot rate trading just below 99. The short-term tone remains bearish, as the index stays below the cluster of 50-day, 100-day, and 200-day simple moving averages near 100.22, as well as below the key rising trendline (now situated near 100.15) that previously provided support. Meanwhile, a descending trendline extending from 101.80 caps broader rebound attempts near 101.26. The Relative Strength Index (14) stands at approximately 42—below the midline—suggesting persistent downward pressure rather than an imminent bullish reversal. On the upside, initial resistance lies near the 99.0 round-number mark, followed closely by the level near 99.22 (the 9-day moving average). On the downside, the first support level to watch is the secondary rising trendline near 98.72; a breach here would expose lower levels down to 98.56 (last month's low) and reinforce the prevailing bearish bias.
Consider shorting the US Dollar Index at 98.88 today; stop-loss: 98.98; targets: 98.40, 98.50.
WTI Spot Crude Oil
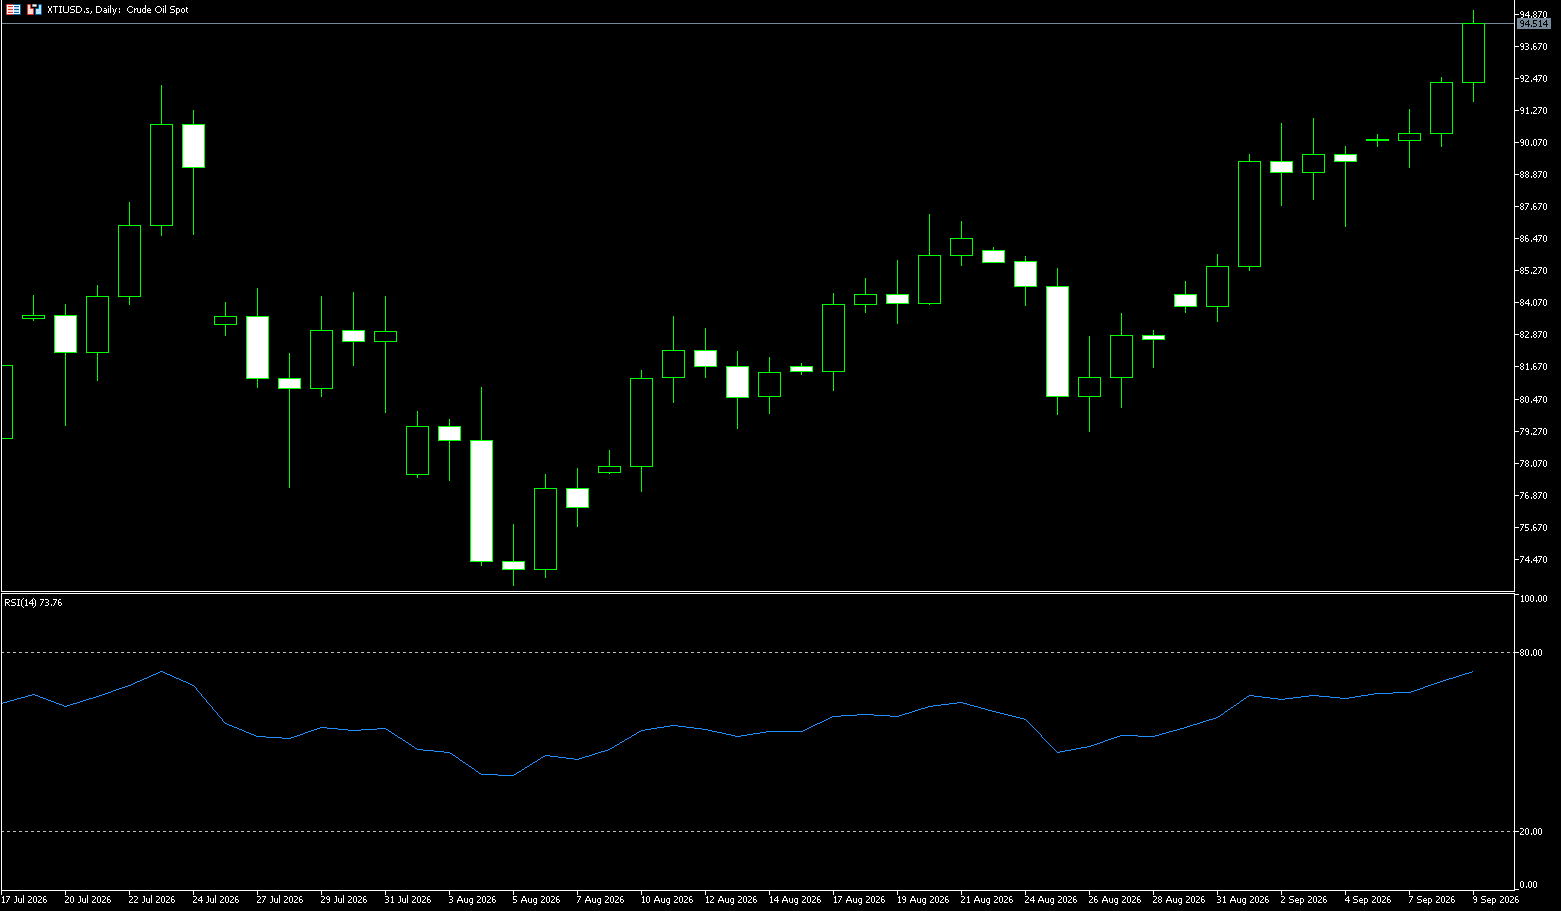
WTI crude oil prices climbed to a six-week high near the $94 mark on Wednesday after Yemen's Houthi rebels attacked four cities in southern Saudi Arabia, setting oil facilities ablaze and sparking market fears of a significant escalation in the Middle East conflict. Since the joint US-Israeli strikes against Iran in late February, Gulf oil exports have suffered severe damage; this latest attack on Saudi soil—bypassing the Strait of Hormuz blockade zone to directly threaten energy supplies toward the Red Sea—has heightened the risk of a global economic shock, prompting banks like Goldman Sachs and HSBC to raise their oil price forecasts for the remainder of 2026 and for 2027. Meanwhile, rising oil prices, combined with comments from Federal Reserve Governor Waller and a robust US jobs report, pushed trader bets on a rate hike at the September 15–16 policy meeting to approximately 60%, up from 50% prior to the data release. However, some intraday gains were erased following a call between Trump and Putin; the Kremlin stated that Trump desires a swift end to the Ukraine war—a sentiment Putin supported—and an end to hostilities could potentially allow Russia to resume higher levels of energy exports.
Iranian exports have been severely hampered by US blockades and reciprocal attacks, while obstructed passage through the Strait of Hormuz has raised export friction costs across the Gulf; with no significant contraction in demand, the anticipated supply-demand gap continues to drive oil prices higher. Amidst this tight balance between crude oil supply and demand, the marginal shift caused by the Houthi action has provided significant upward momentum for oil price expectations. Technically, international oil prices remain highly volatile today, currently rising toward the $94.82 level (the 61.8% Fibonacci retracement) and the $94.86 mark (the June 3 high)—an area of previous heavy trading and significant resistance—followed by the $96.00 round-number level and the $100 psychological benchmark. Support lies near the $90.00 psychological level, which also serves as a recent area of high trading volume; should the price break below $90 in the short term, it could retest the $89.00 level (the 9-day simple moving average).
Consider going long on crude oil at 94.60 today; stop-loss: 94.45; targets: 97.00, 98.00.
Spot Gold
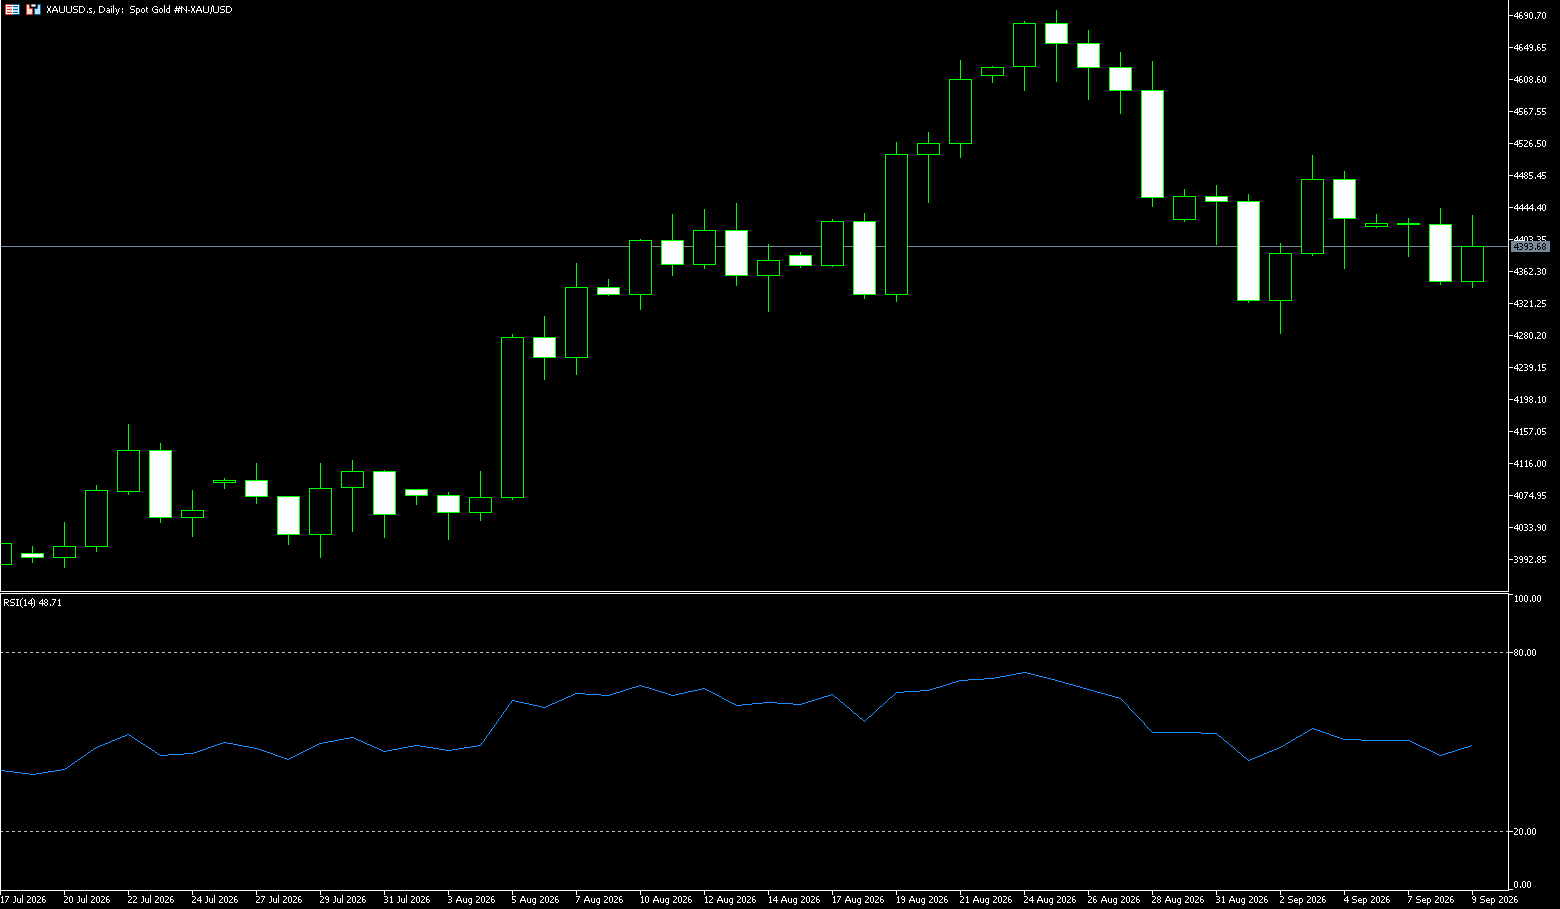
In Wednesday's early trading, spot gold traded near $4,400 per ounce. Gold prices faced pressure ahead of US CPI data release, as rising oil prices heightened inflation concerns and boosted expectations for a Federal Reserve rate hike in September. Factors such as attacks on Saudi energy facilities by Yemen's Houthi rebels and Iran's threats of "economic war" against the US—combined with a stronger-than-expected US August jobs report (where the unemployment rate held steady at 4.1%)—prompted traders to bet on a rate hike at the September policy meeting, thereby limiting gold's appeal. The market is currently awaiting PPI data on Thursday and CPI data on Friday for further clues regarding monetary policy. Over the past two weeks, gold has come under renewed pressure due to rising US Treasury yields, hawkish remarks from Fed Chair Warsh, and stronger-than-expected US non-farm payroll data. After surging 15% in the first three weeks of August, gold prices have since retraced 5.5%. During this period, a UBS market strategy report analyzed the differential impact of rising yields on three asset classes—stocks, bonds, and gold—within the context of the current rate-hike cycle.
Gold prices fell for the third consecutive day, approaching the psychological level of $4,400; the next target is $4,300, as the path of least resistance in the short term has shifted downward. The 14-day Relative Strength Index (RSI) continues to decline after breaking below the neutral 50 level, indicating further downside potential. The initial support level is at $4,300. A decisive break below this level could lead to a test of the September 2 swing low at $4,282, followed by the 50-day moving average at $4,262. Should weakness persist, the next area of focus would be $4,200. On the upside, a break above $4,400 would open the door to challenging the psychological level of $4,450, followed by the $4,500 mark. A break above the latter would expose the 200-day moving average at $4,537. A further breakout above that level could pave the way for a move toward $4,600.
Consider going long on gold at $4,400 today; stop-loss at $4,395; targets at $4,450 and $4,460.
AUD/USD
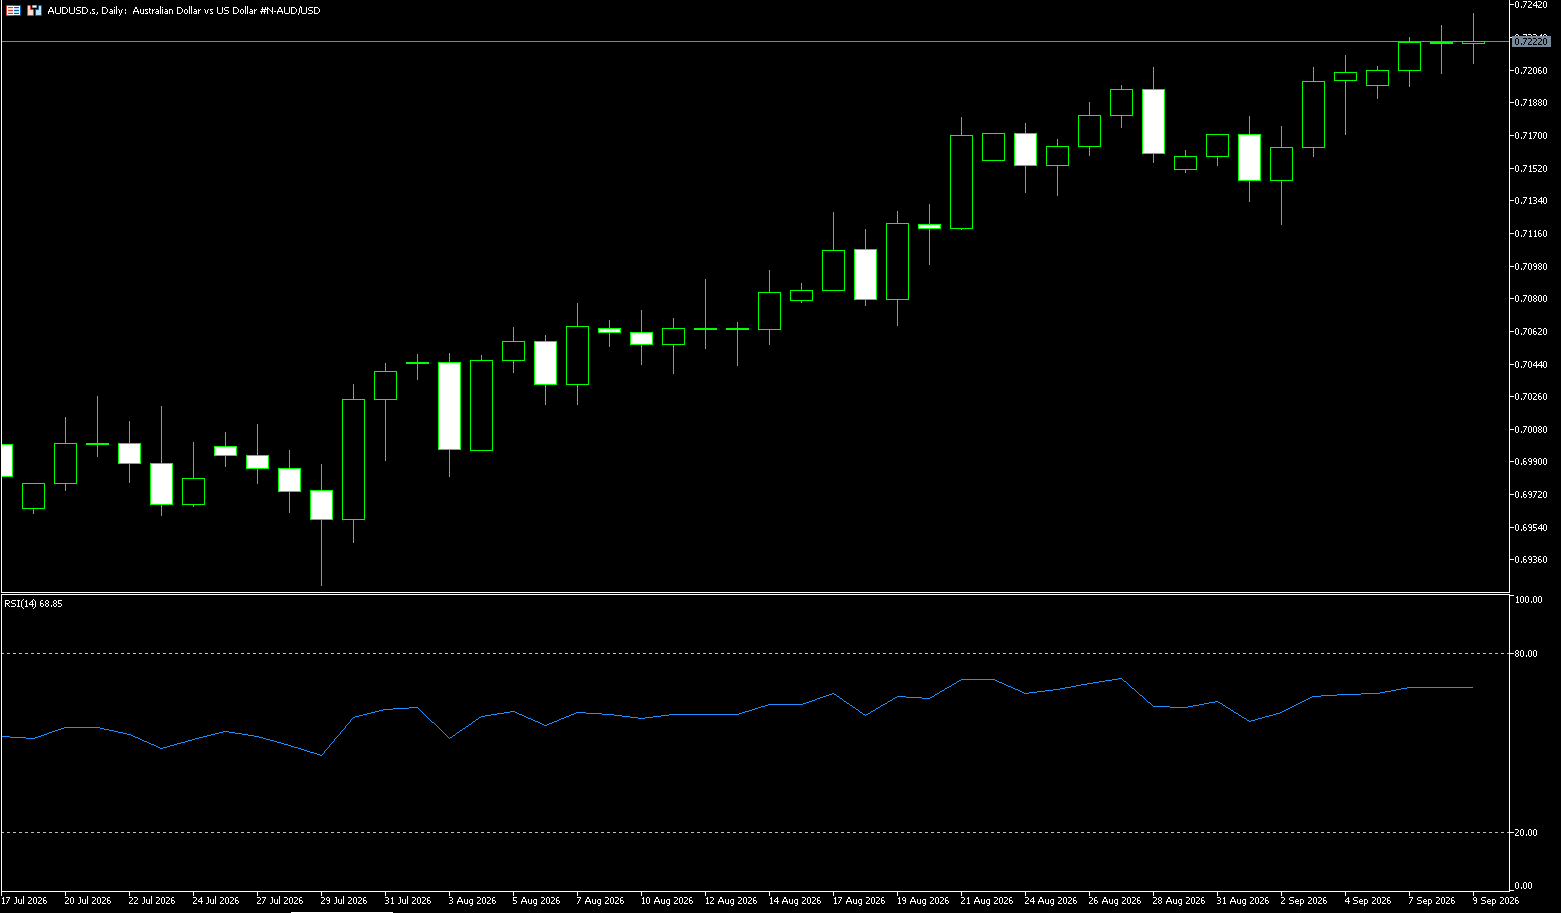
The Australian dollar edged up above $0.72, moving toward a four-month high, as increasingly hawkish signals from the Reserve Bank of Australia (RBA) reinforced expectations of another rate hike this month. Deputy Governor Andrew Hauser stated on Tuesday evening that the central bank would discuss the case for a rate hike at the September meeting, citing persistently high inflation and upside risks. Assistant Governor Sarah Hunter also indicated that the RBA has little tolerance for higher inflation and may need to raise rates for the fourth time this year. With oil price surges linked to the Gulf conflict driving up inflation, the central bank has already raised rates three times in 2026. Markets currently price in a 74% probability of a 25-basis-point hike at the September 29 meeting—up sharply from less than 10% a month ago—while a November hike is fully priced in. Additionally, strong trade data from China has supported the Australian dollar, even as the widening conflict in the Gulf weighs on risk sentiment.
On the daily chart, AUD/USD is trading at 0.7220, maintaining a constructive short-term bias; it holds firmly above the cluster of 50-day, 100-day, and 200-day simple moving averages near 0.7051 and tracks along a series of rising trendline supports. The Relative Strength Index (RSI) stands at approximately 69—just below the overbought zone—indicating solid upward momentum, though a pause or minor consolidation is possible following recent gains. To the downside, initial support lies near the 0.7190 level (9-day moving average), while the triple moving average cluster near 0.7051 reinforces a broader demand zone, which is further supported by multiple rising trendlines originating from the 0.6850–0.6900 range. Although the pattern does not explicitly define a specific upside resistance level, the broader structure suggests that as long as the price holds above 0.7190 (the 9-day moving average)—and especially above the 0.7050 zone—pullbacks are likely to attract buying interest targeting 0.7264 (the May 14 high), followed by the nearby upper limit of 0.7300 (a psychological resistance level).
Consider going long on the AUD at 0.7203 today; stop-loss: 0.7190; targets: 0.7260, 0.7250.
GBP/USD
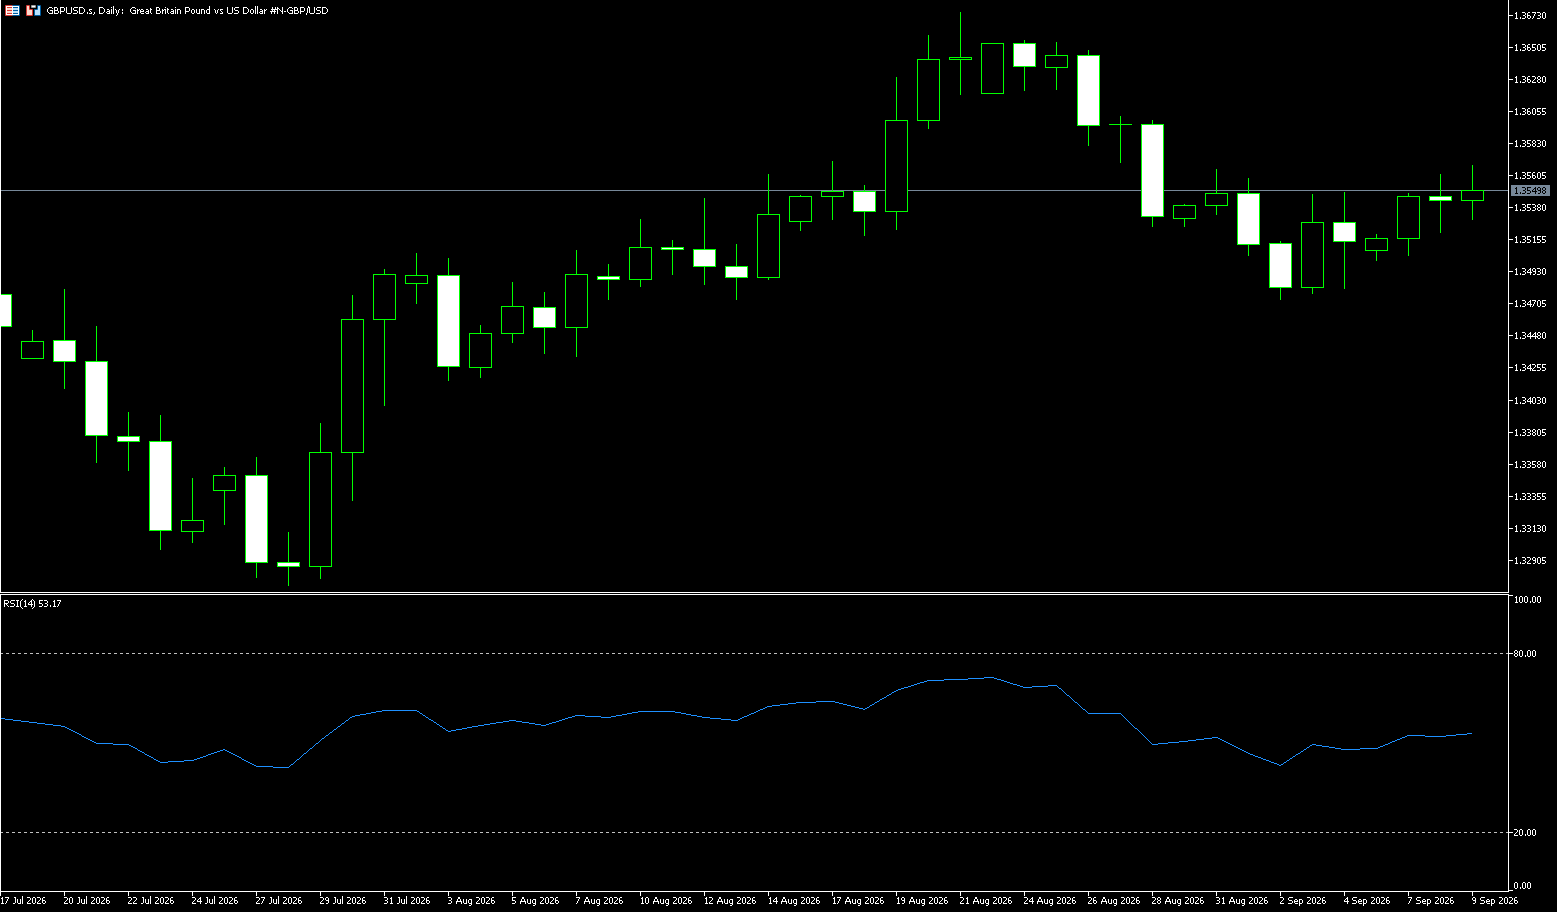
During early European trading on Wednesday, GBP/USD was trading in positive territory near 1.3550. UK Chancellor John Healey announced a series of measures aimed at boosting economic growth and attracting more private investment into the UK, providing some support for the pound against the dollar. On Monday, the Chancellor announced that urban areas would be granted greater powers to attract private investment, part of Prime Minister Andy Burnham's plan to devolve power and reduce central government control. Healey also emphasized his commitment to fiscal discipline and curbing rising costs for businesses and the public, including a pledge to cut regulatory costs by 25% before the next general election in 2029. A Reuters poll indicates that the Bank of England (BoE) is expected to maintain interest rates at 3.75% for the remainder of the year and at least through mid-2027. On Tuesday, BoE Governor Andrew Bailey sought to dispel the notion that a rate hike is merely a matter of time, stressing instead that it remains a possibility contingent upon economic and geopolitical developments.
On the daily chart, GBP/USD maintains a mildly bullish bias, as the price remains above the 200-day simple moving average (SMA) at 1.3450, indicating potential demand on dips. However, the spot price is currently just below the Bollinger Bands midline at 1.3561—a level acting as immediate resistance—while the Relative Strength Index (RSI) is near 56, suggesting solid bullish momentum that is not yet overextended. On the upside, if the daily close settles above the Bollinger Band midline at 1.3561, it will pave the way for a further test of the upper Bollinger Band resistance near 1.3660. Beyond that, the next hurdle to watch is the psychological level of 1.3700. On the downside, initial support lies at the 1.3500 psychological level, followed by stronger structural support from the lower Bollinger Band near 1.3463, where buyers are expected to defend the broader positive tone.
Consider going long on GBP at 1.3540 today; Stop Loss: 1.3530; Targets: 1.3590, 1.3580.
USD/JPY
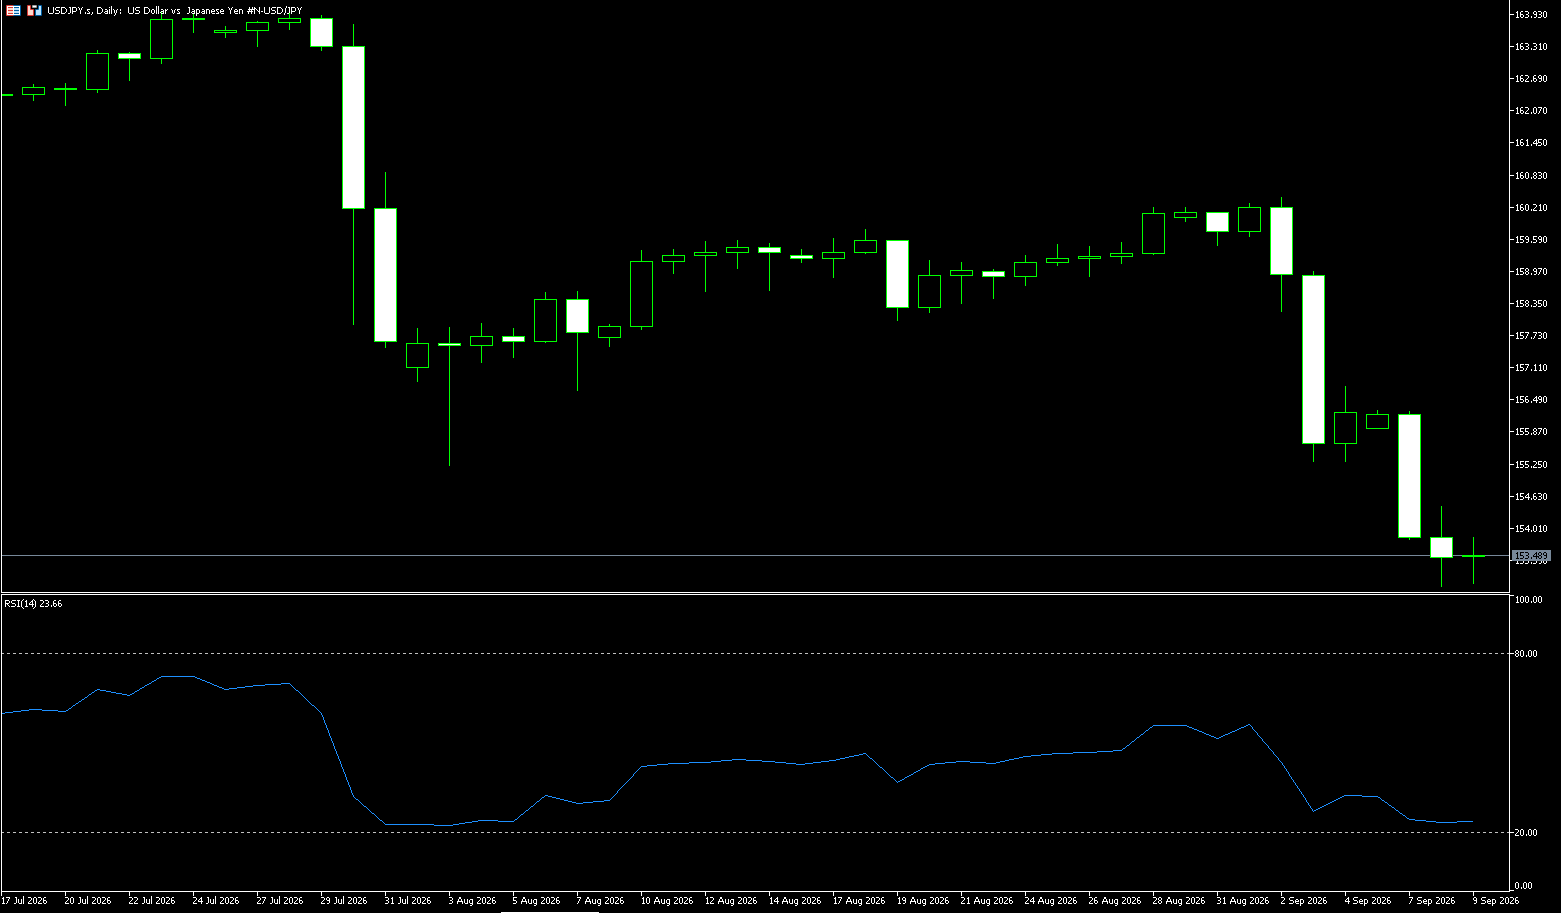
The yen appreciated to around 153 per dollar on Wednesday—nearing its strongest level in nearly seven months—after US Treasury Secretary Scott Bessent warned traders against shorting the currency. The former hedge fund manager stated he has "considerable insight" into the Bank of Japan's actions regarding when it might intervene in the yen. Markets widely anticipate a Bank of Japan rate hike next week, while the Sanae Takaichi administration has adopted a more hawkish stance, with policymakers acknowledging the need to curb the yen's excessive depreciation. The currency is also reversing the bearish forces that drove it to a 40-year low in July, including the unwinding of carry trades and expectations of increased capital repatriation. Meanwhile, private-sector data showed that confidence among Japanese manufacturers improved for the second consecutive month in September, bolstered by strong demand for semiconductors and data centers.
Since September 2, the USD/JPY pair has fallen by more than 4% (650 pips), even touching a near seven-month low of 152.89 before recovering to the 153.70 level, effectively forming a hammer candlestick pattern. While this pattern is typically bullish, a daily close above the session high of 154.42 is required before the pair can challenge higher price levels. In such a scenario, the 155.00 mark would be the next target, followed by the 200-day simple moving average at 158.44, and then the 160.00 level. Although the Relative Strength Index (RSI) indicates oversold conditions, the rapid pace of the decline suggests the pair could drift lower; however, a move by the RSI above the 30 level could trigger a partial recovery. Conversely, if bears step in and push the price below 153.00, they may test the year-to-date low of 152.10, reached on January 27.
Consider shorting USD/JPY at 153.70 today; Stop Loss: 153.85; Targets: 153.00, 152.80.
EUR/USD
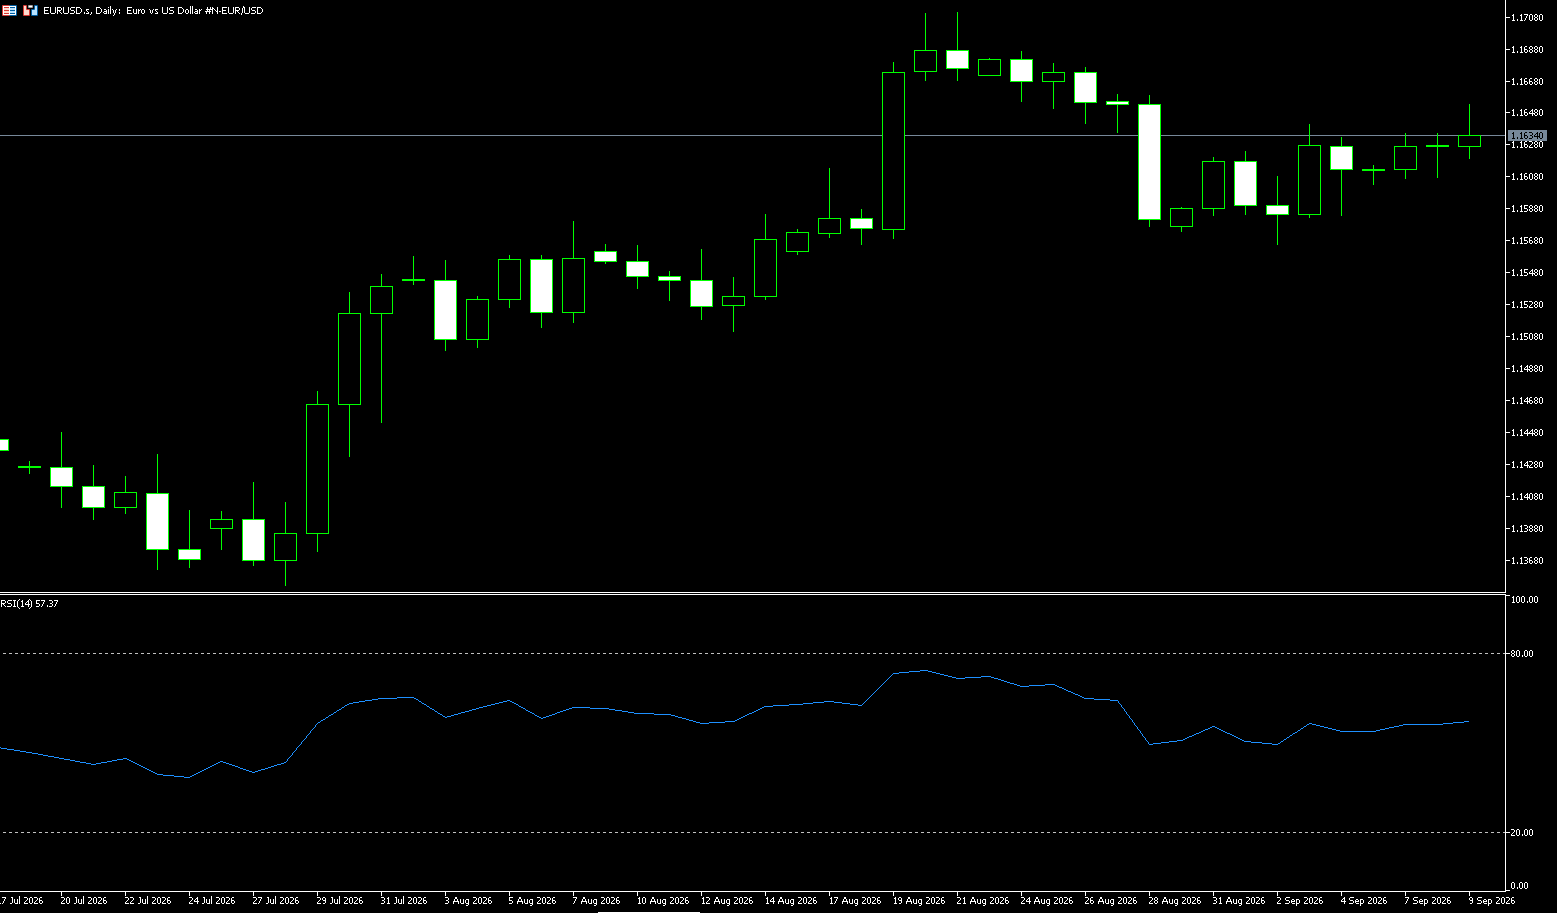
The Euro has stabilized above the $1.16 level as investors await the European Central Bank's (ECB) policy meeting later today, while rising oil prices have heightened inflation concerns. Brent crude is nearing $100 per barrel, and European natural gas prices have climbed to their highest levels since late 2022—driven by escalating tensions in the Middle East and reports of a pending agreement between Iran and Oman regarding shipping management in the Strait of Hormuz, which has further stoked fears regarding Tehran's growing influence over this critical waterway. Persistent inflationary pressures and robust economic growth are placing pressure on the central bank to maintain a hawkish policy stance. Markets widely anticipate an ECB rate hike on Thursday, with expectations almost fully priced in for another increase later this year. In the US, investors are awaiting key inflation data due later this week; this follows a strong jobs report on Friday that boosted the probability of a Federal Reserve rate hike next week to nearly 60%, further supporting the US dollar.
On the daily chart, the EUR/USD pair maintains a mildly bullish bias as it trades above the 20-day (1.1621) and 100-day (1.1633) simple moving averages, indicating potential buying interest on dips, while remaining capped below the upper Bollinger Band at 1.1705. The Relative Strength Index (14) hovers around the 55 level, suggesting positive but not overextended momentum; as long as the price holds above the nearby moving average support, further gains are possible. To the upside, immediate resistance lies near the upper Bollinger Band at 1.1705 and the August 21 high of 1.1711; a sustained break above this ceiling would pave the way for a more distinct bullish extension toward the May 21 high of 1.1787. On the downside, initial support is found near the psychological 1.1600 mark, followed by the Bollinger Band level around 1.1538, which would provide deeper, tiered support in the event of a corrective pullback.
Consider going long on the Euro today at 1.1622; Stop Loss: 1.1610; Targets: 1.1670, 1.1660.
Stock Analysis:
Australia ASX 200 Index
Market Overview:
The Australian ASX 200 fell 0.1% on Wednesday to close at 8,911 points, extending recent weakness to a six-week low as markets remained cautious amid oil prices nearing $100 and mounting global inflation concerns. Locally, business sentiment dropped to a three-month low in August, while consumer confidence declined in September. Meanwhile, regional markets fell due to escalating tensions involving Iran, which launched missiles at a US base in Jordan and attacked vessels in the Strait of Hormuz. In key trading partner China, headline inflation accelerated as expected in August, while producer prices rose more than anticipated. Healthcare, financials, and business services weighed on the index. CSL fell 2.0% after lowering its FY2026 guidance and warning of slowing plasma demand and increased competition from generics.
The "Big Four" banks fell between 0.4% and 2.2%. Losses were limited by strong performances in non-energy minerals, energy, and industrial services; Woodside and Santos rose 2.7% and 1.8%, respectively. Mining companies also advanced, driven by strong gains from BHP (up 2.8%) and Rio Tinto (up 2.3%).
Sector Performance:
Top-performing sectors: Energy, Materials (Mining)
• Energy: WDS and Santos rose, driven by Brent crude approaching $100;
• Materials: BHP and Rio Tinto strengthened, with mining stocks lifted by higher copper prices.
Worst-performing sectors: Healthcare, Financials (Big Four banks), Retail
• Healthcare: CSL dragged down the sector after lowering guidance;
• Financials: The Big Four banks generally declined, pressured by weak domestic business and consumer confidence;
• Consumer retail remained under pressure, reflecting a weakening outlook for the local economy.
Technical Analysis:
Outlook for Thursday: The market is in a short-term consolidation/pullback phase. Energy and mining sectors are providing a floor for the index, but financials and healthcare are acting as a drag, resulting in an intense tug-of-war between bulls and bears. Technical Scenarios — Bullish Scenario: Support at 8880 holds; commodities continue to strengthen, driving a rebound in the resource sector; the index tests the 8960–8980 resistance zone. Bearish Scenario: Support at 8860 fails; rising US Treasury yields and escalating Middle East geopolitical risks push the index down to 8800. Neutral Scenario: Oscillating within a narrow 8870–8970 range while awaiting external news catalysts.
Trading Strategy (Short-term Perspective)
Short-term Trading Strategy (Intraday / 1–2 trading days)
1. Bullish Approach: Consider long positions only after the index firmly establishes itself above 8880; place stop-loss below 8855; first target 8960–8980; if 8980 is breached, look toward 9020.
2. Bearish Approach: If the rebound faces resistance and retreats in the 8960–8980 zone, consider shorting at highs; place stop-loss above 8995; first target 8880; if broken, look toward 8800.
3. Range-bound Strategy: 8870–8970 range; avoid chasing rallies or panic selling; go long near support and short near resistance; maintain strict stop-losses.
Key Risk Warnings:
1. Geopolitical Risk: Further escalation in the Middle East and volatile oil prices could directly impact the energy sector while intensifying global inflation concerns and suppressing stock market valuations.
2. Macro Data Risk: Continued weakening of Australian domestic confidence data and shifting market expectations regarding RBA interest rates; US inflation data and fluctuations in US Treasury yields could spill over to Australian equities.
3. Technical Breakdown Risk: If the index decisively breaks below 8860, it could open the door for a deeper correction; avoid blindly "buying the dip."
4. Sector Divergence Risk: Current market performance relies heavily on resource commodities; if copper and oil prices retreat, the index may lack underlying support and weaken rapidly. Hang Seng Index (HSI)
Market Overview:
The Hang Seng Index saw little change on Wednesday, edging down 0.2% (or 42 points) to close at 25,275, as investors remained cautious amidst escalating tensions in the Middle East and rising oil prices. Brent crude climbed toward $100 per barrel—driven by concerns over global supply disruptions following attacks on Saudi energy facilities—fueling inflation fears and potentially limiting room for interest rate cuts. Overnight, US futures weakened following a decline on Wall Street. Meanwhile, strong performance in Asian chip stocks and continued investor interest in artificial intelligence (AI) stocks helped cushion the downside.
Regarding economic data, China's annual inflation rate accelerated to 0.8% in August from 0.5% in July, while producer prices rose 3.8% year-on-year—up from 3.5% in July—partly due to rising food and energy costs. Among individual stocks, Haidilao plunged nearly 10%, whereas Lenovo rose 2.1%, MiniMax gained 1.9%, and Kingboard Laminates climbed 3.3%.
Sector Performance:
Top-performing sectors: Non-ferrous metals (copper and aluminum), optical communications/PCB, and electric utilities; cyclical resource stocks showed relative resilience.
Worst-performing sectors: Food & beverage/consumer (Haidilao fell over 9%), autos, mainland property developers, and select internet platform stocks; Meituan, JD.com, and Xiaomi weakened, while Baidu bucked the trend to strengthen.
Technical Analysis:
Hang Seng Index Wednesday close: 25,274.96 points (-42.22 points, -0.17%); turnover: HK$204.945 billion. The index recorded its third consecutive day of losses, trading within a narrow range throughout the day with an overall weak tone. The Hang Seng Tech Index fell more sharply, dropping 0.76% to 4,420.79 points, as heavyweight tech stocks weighed on the broader market. The KDJ indicator has formed a "death cross," and the MACD red histogram is contracting; the index has pulled back to test short-term moving averages, bullish momentum has waned, and the market has entered a short-term phase of corrective fluctuation. Intraday Range: The index fluctuated repeatedly within the 25,200–25,400 range, closing slightly lower at the end of the session. Key levels: Wednesday's low near 25,220; overhead resistance at 25,400–25,430.
On Thursday, the index is likely to continue oscillating within the 25,150–25,430 range. If a rebound faces resistance at 25,380–25,430, it may retest the 25,200 support level; if 25,200 holds, the index will likely test overhead resistance again; however, a drop below 25,150 would target the 25,050–25,000 zone. Bullish scenario: Requires a breakout above 25,430 on high volume to challenge 25,550. Bearish scenario: A decisive break below 25,000 would signal short-term weakness, targeting the 24,850 area.
Trading Strategy:
Operational Strategy (Short-term Perspective)
Short-term Trading (Intraday / 1–3 days)
1. Shorting on rebounds: If the price faces resistance in the 25,380–25,430 range, consider a light short position; place the stop-loss above 25,600; first target 25,200, second target 25,050.
2. Going long on dips: If the price stabilizes after pulling back to the 25,150–25,200 support zone, consider a small long position; place the stop-loss below 25,000; first target 25,380–25,430.
Key Risk Warnings:
1. Overseas liquidity risk: Strong US employment data has raised market expectations for Federal Reserve rate hikes and pushed up US Treasury yields, suppressing Hong Kong stock valuations; a sharp overnight drop in US stocks would directly drag down the Hong Kong market opening.
2. Mainland economic data volatility: Domestic data (such as August foreign trade figures) may influence market risk appetite.
3. Risk associated with heavyweight stocks: High-weightage technology and leading consumer stocks exhibit significant volatility; for instance, sell-offs in the catering sector can trigger market sentiment shocks, easily leading to sharp fluctuations in the index.
Disclaimer: The information contained herein (1) is proprietary to BCR and/or its content providers; (2) may not be copied or distributed; (3) is not warranted to be accurate, complete or timely; and, (4) does not constitute advice or a recommendation by BCR or its content providers in respect of the investment in financial instruments. Neither BCR or its content providers are responsible for any damages or losses arising from any use of this information. Past performance is no guarantee of future results.
More Coverage






2026 © - All Rights Reserved by BCR Co Pty Ltd
Risk Disclosure:Derivatives are traded over-the-counter on margin, which means they carry a high level of risk and there is a possibility you could lose all of your investment. These products are not suitable for all investors. Please ensure you fully understand the risks and carefully consider your financial situation and trading experience before trading. Seek independent financial advice if necessary before opening an account with BCR.
BCR Co Pty Ltd (Company No. 1975046) is a company incorporated under the laws of the British Virgin Islands, with its registered office at Trident Chambers, Wickham’s Cay 1, Road Town, Tortola, British Virgin Islands, and is licensed and regulated by the British Virgin Islands Financial Services Commission under License No. SIBA/L/19/1122.
Open Bridge Limited (Company No. 16701394) is a company incorporated under the Companies Act 2006 and registered in England and Wales, with its registered address at Kemp House, 160 City Road, London, England, EC1V 2NX. Open Bridge Limited acts solely as a payment processor for BCR Co Pty Ltd and does not provide any financial, trading, or investment services on its behalf. Open Bridge Limited's role is limited to payment processing.


 English
 简体中文
简体中文
 繁體中文
繁體中文
 Bahasa
Melayu
Bahasa
Melayu
 Tiếng
Việt
Tiếng
Việt
 ไทย
ไทย
 日本語
日本語
 한국어
한국어
 ភាសាខ្មែរ
 español