


0
US Dollar Index
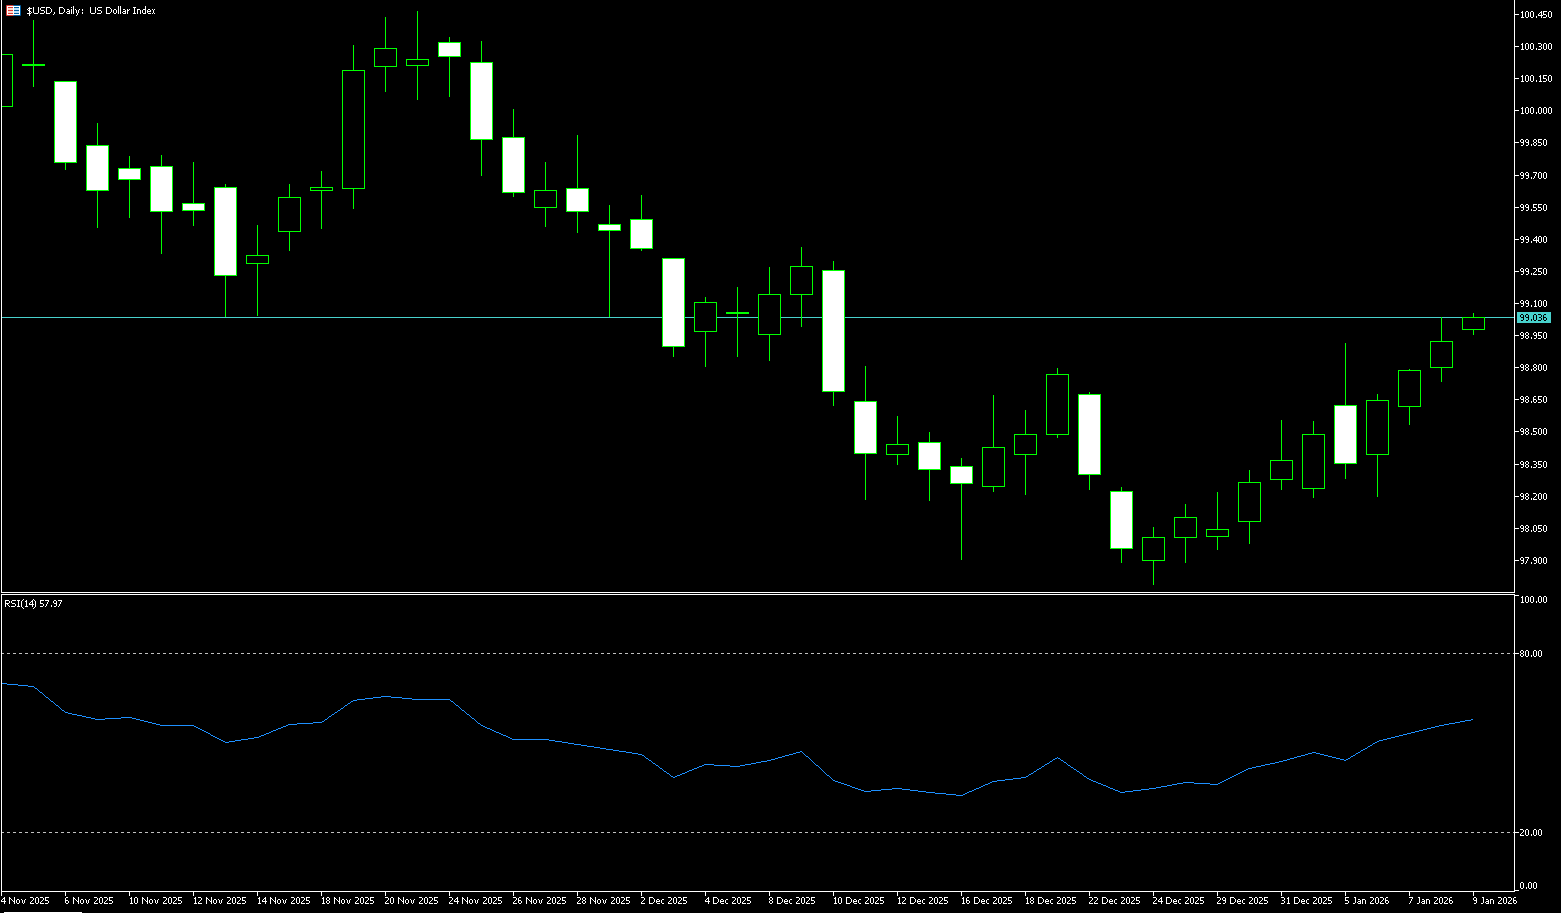
The US dollar index fell to around 98.70 on Monday, ending a four-day rally, as federal prosecutors launched a criminal investigation into Federal Reserve Chairman Jerome Powell, raising questions about the central bank's independence. Powell called the threat of criminal charges a "pretext" aimed at pressuring the Fed to align its policies with the Trump administration and warned that such actions could undermine the central bank's ability to set interest rates based on economic conditions rather than political influence. The dollar also faced downward pressure from bets on additional Fed rate cuts this year after Friday's nonfarm payroll report showed weaker-than-expected job growth in December. Investors are now awaiting the latest inflation data and key banking earnings this week for further guidance. Additionally, the market is weighing geopolitical risks amid escalating protests in Iran and increased uncertainty in South America.
The daily chart shows the US dollar index is under pressure near the 99.00 level, while the 14-day Relative Strength Index (RSI) has fallen to 54, indicating weakening upward momentum and a potential need for consolidation to digest previous gains in the short term. A short-term pullback has occurred after recent consecutive gains. The index is fluctuating around the 200-day moving average (98.77), indicating an imminent breakout direction. The 25-day moving average (98.42) is a crucial medium- to long-term support level. A break below this level would target the psychological level of 98.00. On the other hand, if the index holds above the 200-day moving average at 98.77 and continues to rise, the US dollar index could potentially retest 99.32 (the high of December 9th last year) and 99.82 (the high of November 28th last year), with the next target being the psychological level of 100.
Today, consider shorting the US Dollar Index around 99.02; Stop loss: 99.14; Target: 98.60; 98.70
WTI Crude Oil
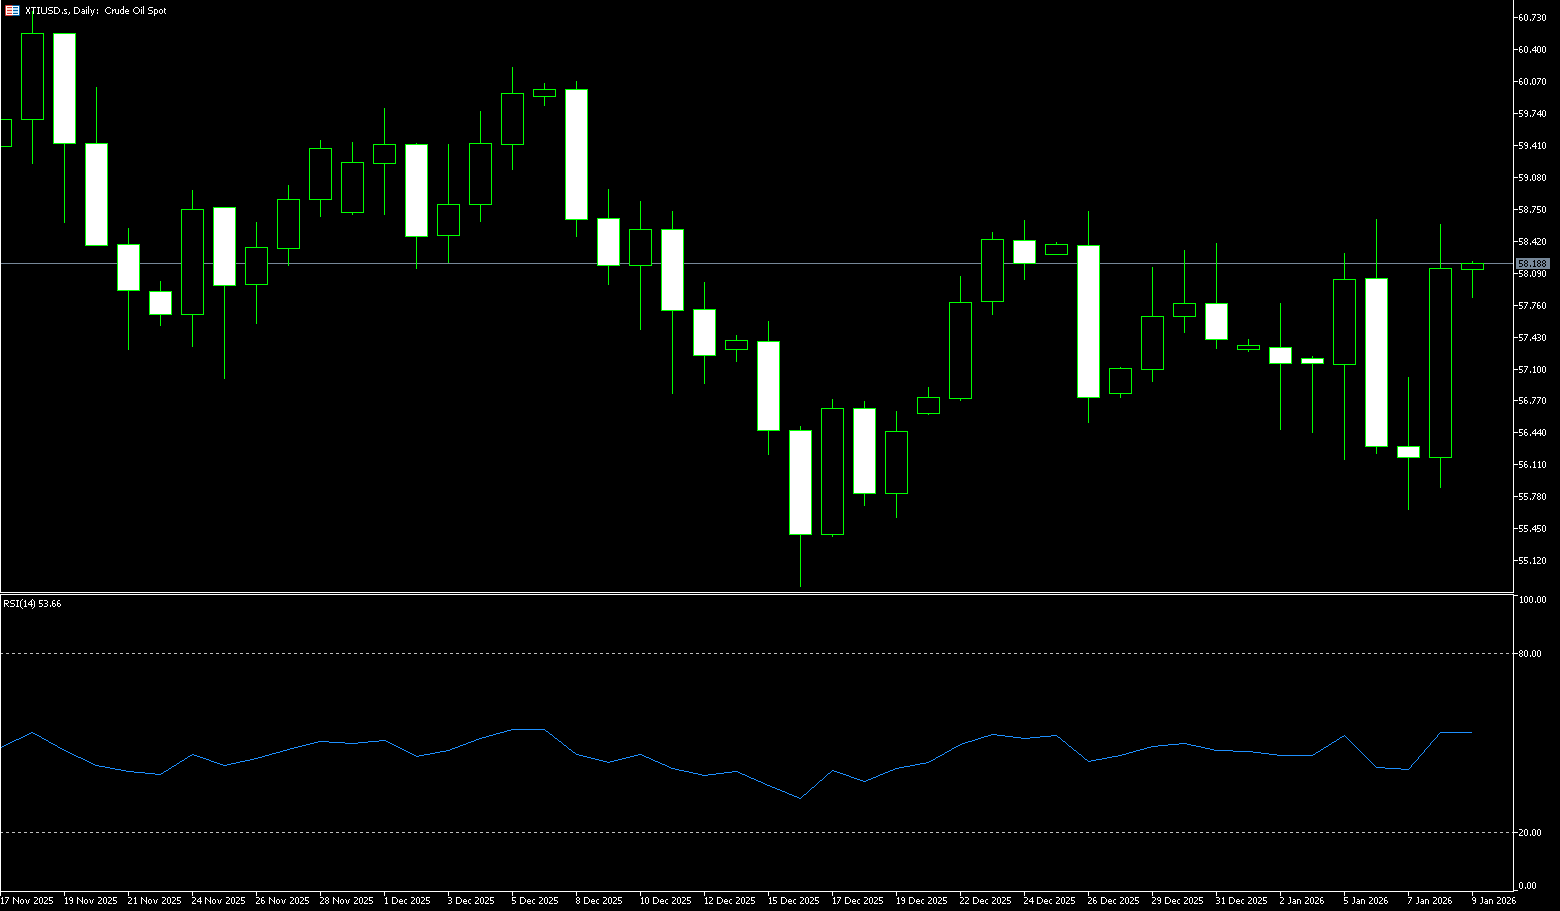
On Monday in European trading, US WTI crude oil rose slightly, briefly reaching a more than one-month high of around $59.62 per barrel. Escalating geopolitical tensions in the Middle East, coupled with Trump's strong rhetoric towards Iran and resilient fundamentals, have led the market to focus on the impact of Iran's growing instability on supply. The Iranian protests, which have lasted for two weeks and caused significant casualties (over 500 deaths), combined with the country's economic collapse (extremely high inflation) and internet censorship, have significantly increased geopolitical risk premiums. Market concerns include potential military conflict, energy supply disruptions, and broader regional instability. In global oil trading, hundreds of oil tankers circumvent Western sanctions by frequently changing flags, disabling GPS, and engaging in anonymous trading. This situation makes oil price movements exceptionally delicate. In theory, sanctions should lead to reduced supply and higher prices; however, in reality, large quantities of crude oil are still flowing, albeit through more concealed channels and at higher costs. This makes it difficult for the market to form clear price signals. Traders are worried about sudden escalations of geopolitical conflicts, yet they must face the reality that the total global crude oil volume has not actually shrunk, only its flow has changed.
In summary, the current crude oil market is characterized by a mix of bullish and bearish factors. Passive buying driven by the rebalancing of commodity indices, supply concerns triggered by escalating geopolitical conflicts, and increased supply resulting from the easing of restrictions in Venezuela, along with high levels of US crude oil production, are all interacting and intertwined. Technically, US crude oil has been oscillating within a range of $55-$60. The current price action at the upper edge of this range, combined with previous bottoming patterns, provides good short-term support. Before a confirmed breakdown, the further the price breaks below this support level, the greater the safety margin for bulls. Currently, support remains around the lower edge of the trading range at $56.76, while resistance levels are at $60.00 (a psychological level) and the $60.09 area (the 100-day simple moving average), followed by $61.20 (the high from November 11th last year). However, if oil prices retest $57.65 (the 9-day simple moving average) and $57.50 (last Friday's low) in the short term, a break below these levels should be anticipated.
Today, consider going long on spot crude oil around $59.03; Stop loss: $58.85; Target: $60.30; $60.50
Spot Gold
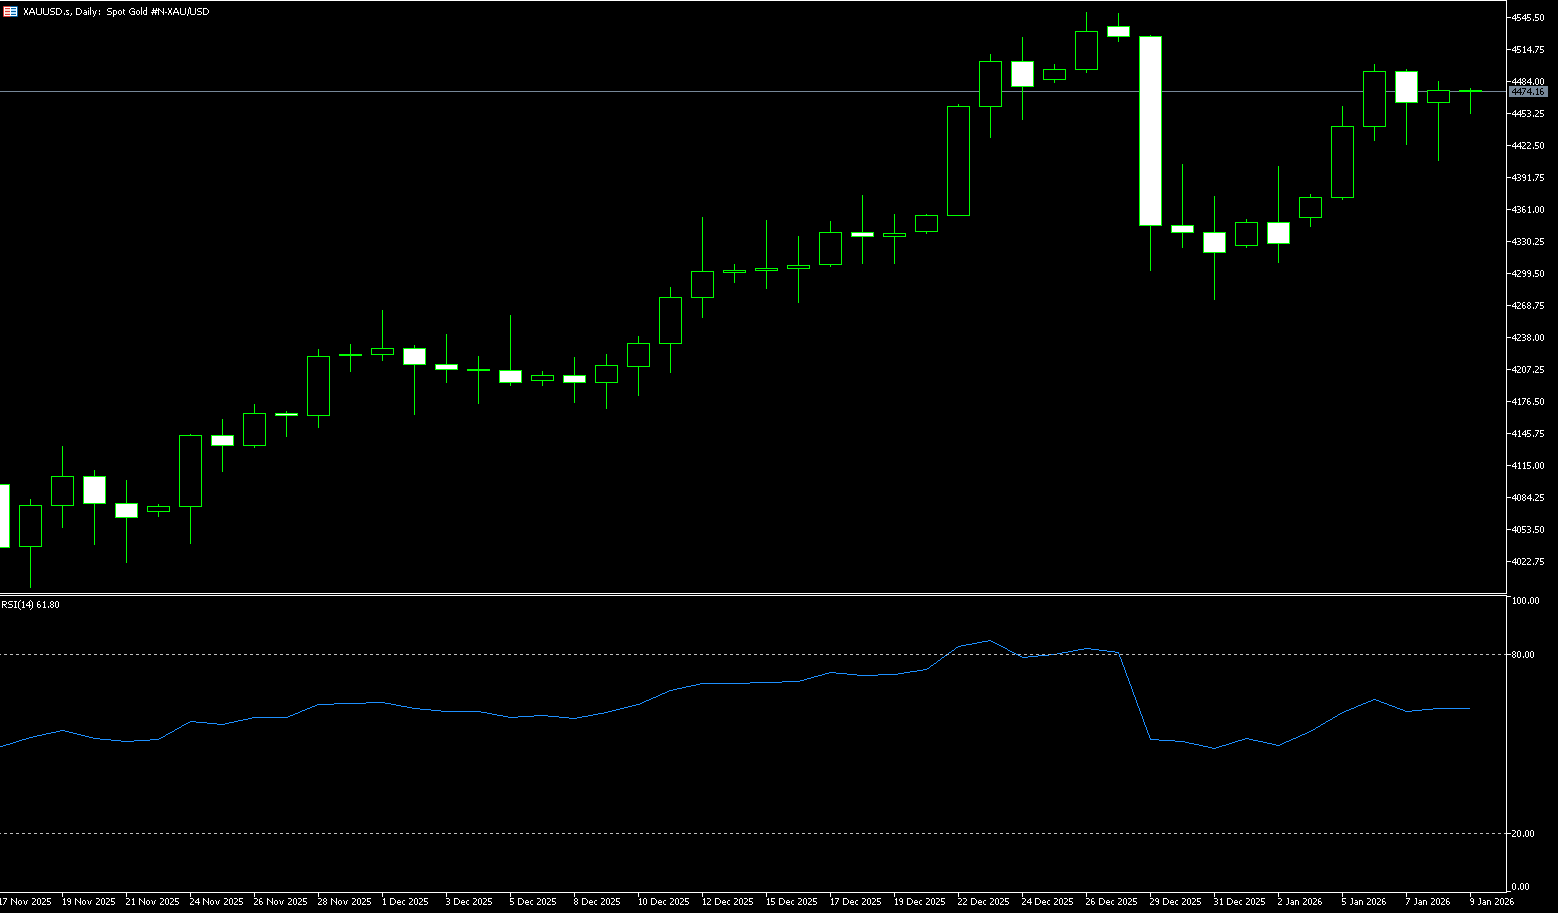
On Monday morning in Asian trading, spot gold traded around $4,629 per ounce, a new all-time high. Gold prices benefited from weaker-than-expected US jobs data and widespread policy and geopolitical uncertainty, including Israeli airstrikes on Hezbollah underground facilities in Lebanon, which increased geopolitical uncertainty risks. The weaker-than-expected US non-farm payroll data for December further solidified market expectations that the Federal Reserve would keep interest rates unchanged this month, although TD Securities believes the Fed will cut rates at least twice this year. Continued geopolitical tensions, including the unrest in Iran, the Russia-Ukraine war, and uncertainty surrounding tariff policies, have all provided upward momentum for gold prices. The unrest in Iran has resulted in over 500 deaths. Meanwhile, Tehran threatened to attack US military bases if US President Trump follows through on his threat to intervene in the protests. This news triggered a surge in risk aversion, causing spot gold to open sharply higher on Monday, reaching $4,564 per ounce in early Asian trading, a gain of over $50 on the day.
Against the backdrop of a continued complex and volatile global macroeconomic environment, the gold market has once again demonstrated strong upward resilience over the past week, with price fluctuations steadily shifting upwards. It is currently making a strong push to break through and hold the key psychological level of $4,600. Spot gold traded near $4,629 per ounce at the start of the week, setting a new all-time high. The daily chart shows the upward trend remains intact, with prices closing above $4,500 last week, indicating continued strengthening buying pressure. The 14-day Relative Strength Index (RSI) has risen to 69.95 and is about to break through its latest cycle high, suggesting buyers are gaining momentum and opening the door to higher prices. Monday's break above the all-time high of $4,549 to a new high of $4,629 paves the way for $4,650 and $4,700. Conversely, if gold/dollar closes below $4,550 this week, sellers may push prices down to the $4,500 level (a psychological level).
Consider going long on spot gold around 4,587 today; Stop loss: 4,583; Target: 4,630; 4,640
AUD/USD
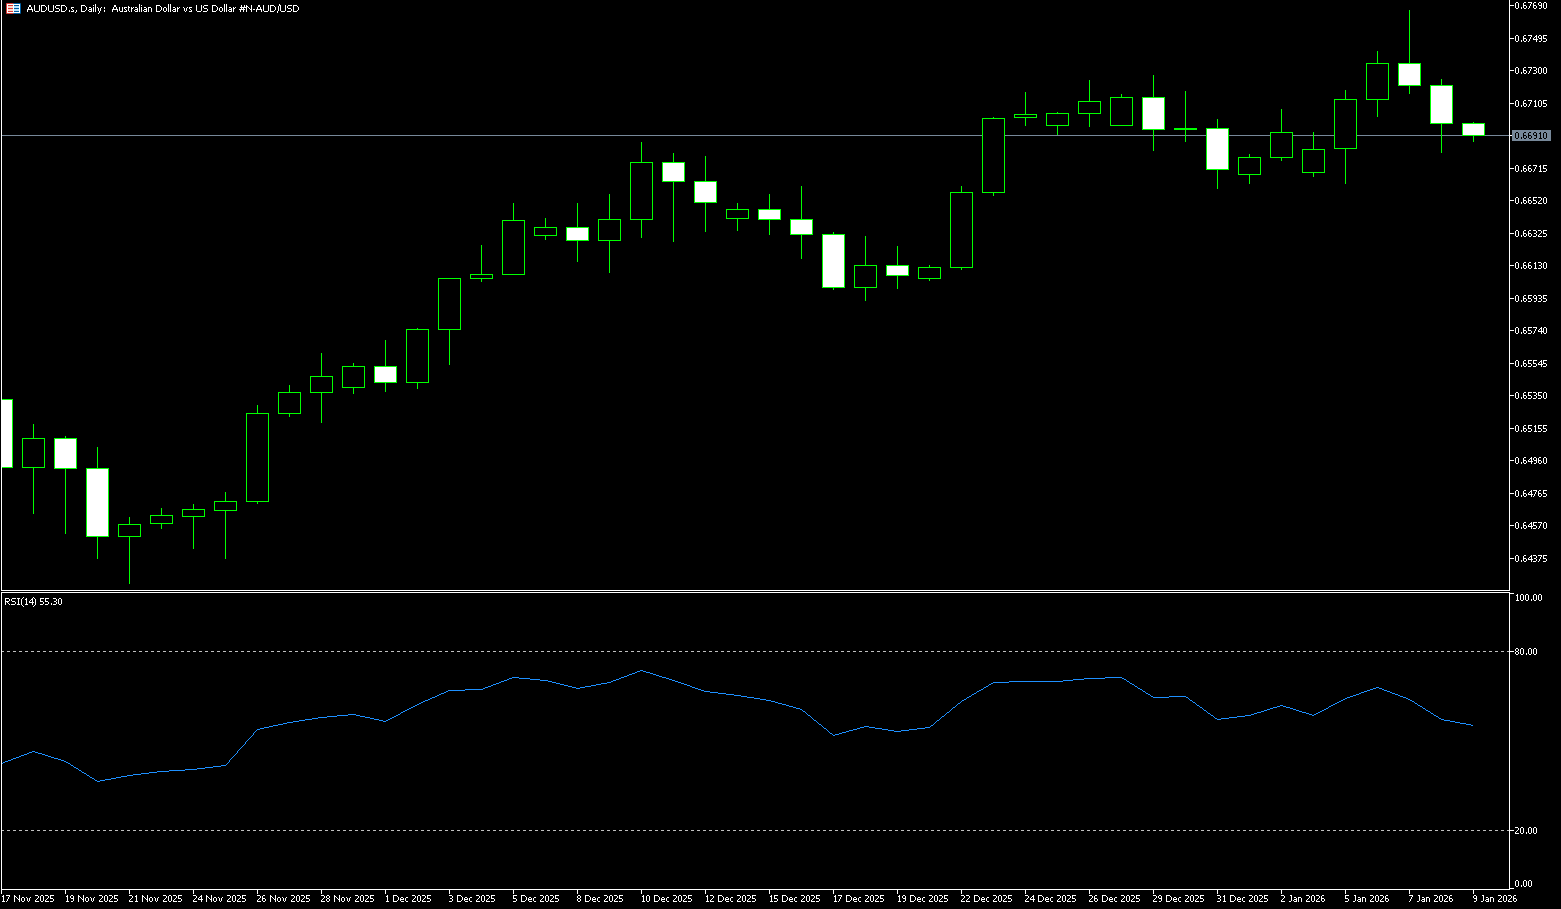
The Australian dollar rose against the US dollar on Monday, ending a three-day losing streak. The rise in the AUD/USD pair as the dollar weakened may be due to market concerns about the Federal Reserve. ANZ's job advertisements fell 0.5% in December, previously revised to a 1.5% decline. Meanwhile, household spending rose 1.0% month-on-month in November, lower than the revised 1.4% increase in October, as consumers remained cautious amid high interest rates and persistent inflation. Australia's November consumer price index data was mixed, leaving the Reserve Bank of Australia's policy outlook uncertain. However, RBA Deputy Governor Andrew Hauser said the November inflation data was largely in line with expectations. Hauser added that a rate cut is unlikely in the near term. Market focus now shifts to the quarterly CPI report to be released later this month for clearer guidance on the RBA's next policy move.
The Australian dollar traded slightly above 0.6700 against the US dollar at the start of the week. Technical analysis on the daily chart shows the pair is testing the lower trendline of an ascending channel pattern, suggesting a potential weakening of bullish bias. The 14-day Relative Strength Index (RSI) is at 59.30, still above the midline, but has retreated from recent highs, indicating slowing bullish momentum. Immediate resistance lies at 0.6725 (the high from December 26th last year). A break above 0.6725 would strengthen bullish momentum, potentially leading to a rally towards 0.6766, the highest level since October 2024, followed by the psychological level near 0.6800. On the downside, a break below 0.6663 (last Friday's low) would lead to a test of the 40-day simple moving average at 0.6622. Further losses would open up downside potential towards 0.6600, a psychological level.
Consider going long on the Australian dollar around 0.6700 today; Stop loss: 0.6690; Target: 0.6750; 0.6740
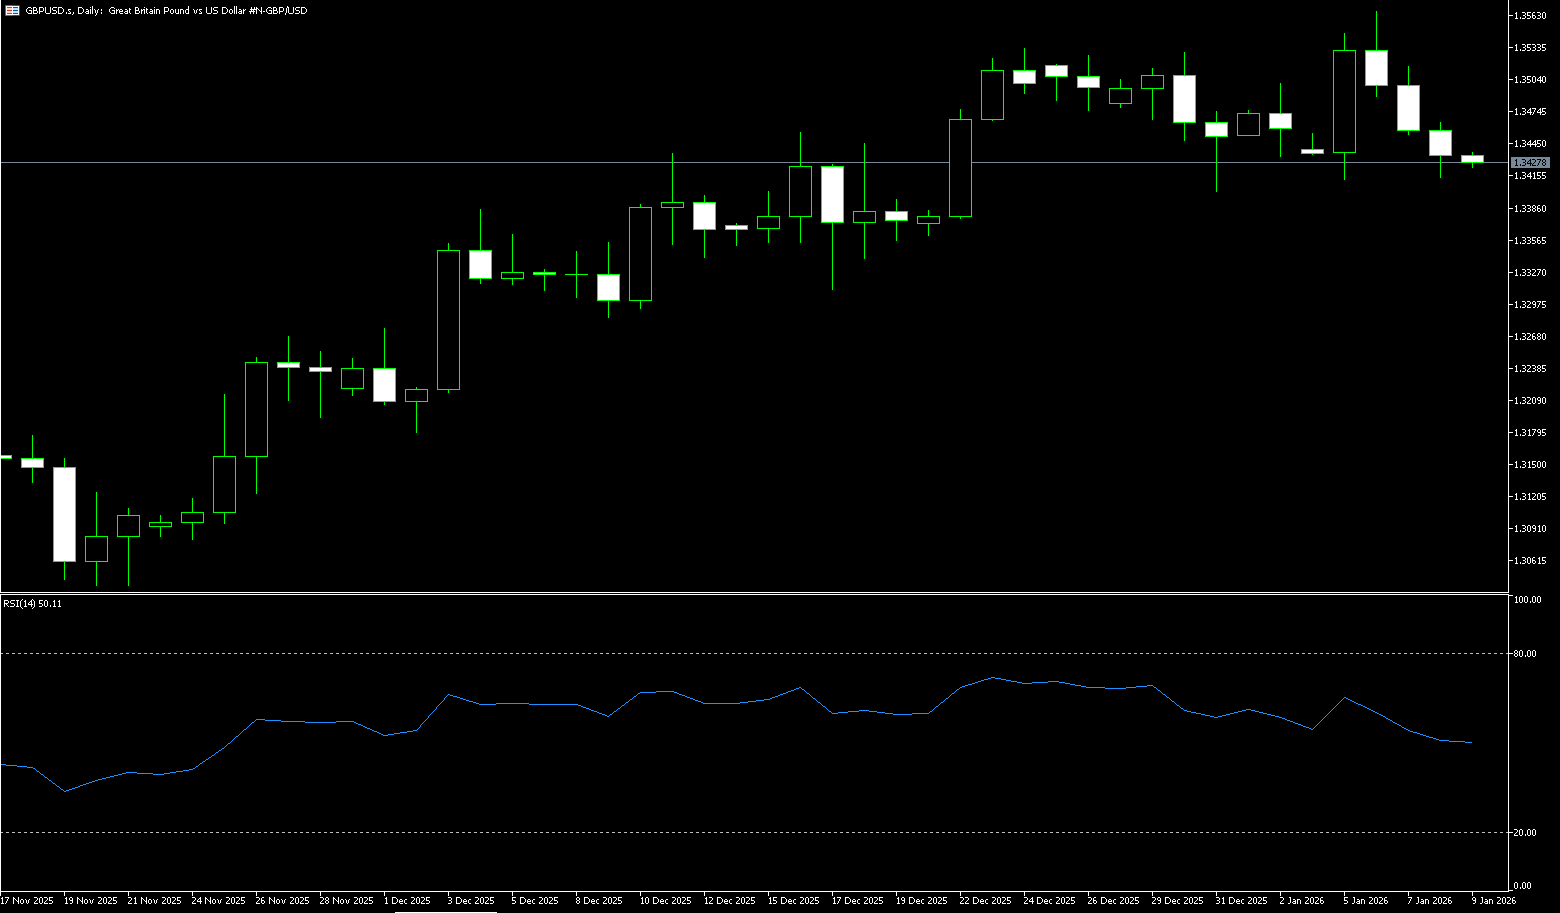
GBP/USD
The GBP/USD pair has recovered slightly from its near three-week low hit during Monday's Asian session. The spot price currently appears to have ended a four-day losing streak and is trading around 1.3460. Despite rising global risk aversion and reduced bets on more aggressive policy easing by the Federal Reserve, concerns about the independence of the US central bank continue to pressure the dollar and benefit the GBP/USD pair. In fact, Federal Reserve Chairman Jerome Powell stated in a statement that the Department of Justice had threatened to bring criminal charges against him. Powell added that the threat of criminal charges was a decision made by the Fed based on our best assessment of the public interest, not following the president's preferences. However, market bets on two more rate cuts by the Bank of England in 2026 may deter traders from making aggressive bullish bets around the pound and limit the upside for the GBP/USD pair. Furthermore, Thursday's UK monthly GDP report will provide some meaningful impetus for the GBP/USD pair in the latter half of the week.
The pound broke above the 1.3395-1.3400 confluence early in the week—a 200-day simple moving average and a psychological level—considered a key trigger for the GBP/USD bulls. With the 14-day Relative Strength Index (RSI) on the daily chart holding in the 53.90 area, some follow-through buying above 1.3395-1.3400 would push the pair back to the 1.3466 level (9-day simple moving average). Momentum could extend further to the psychological resistance at the 1.3500 level. On the other hand, a corrective pullback could now find considerable support near the 200-day simple moving average at 1.3395, followed by a breakout of the 1.3354 level (220-day simple moving average). Any further declines could be viewed as buying opportunities.
Today, consider going long on GBP around 1.3452; Stop loss: 1.3440; Target: 1.3480; 1.3490
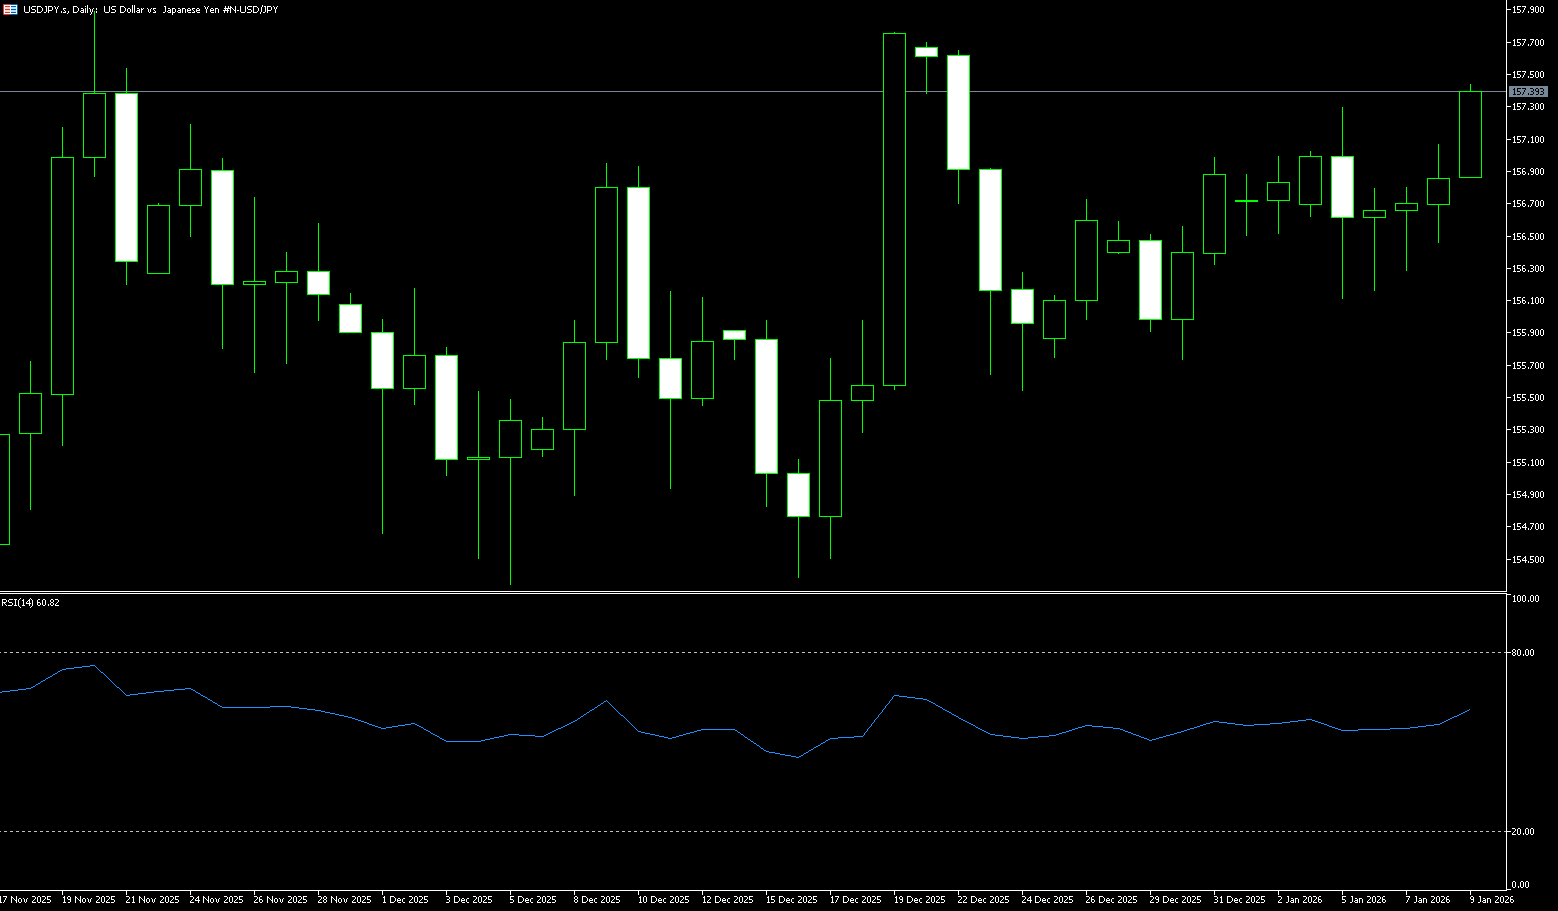
USD/JPY
On Monday, USD/JPY weakened around 158.10. The yen strengthened slightly against the dollar as Japanese Prime Minister Sanae Takaichi considered holding a snap election for the House of Representatives in the first half of February. Prime Minister Takaichi may hold an early election, possibly as early as February. This would be the first time the conservative Takaichi faces voters, allowing her to capitalize on the strong public support she has enjoyed since taking office last October. Data released by the U.S. Bureau of Labor Statistics on Friday showed that U.S. job growth was lower than expected, suggesting the Federal Reserve may keep interest rates unchanged later this month. Meanwhile, the unemployment rate fell to 4.4% in December from 4.6% in November, while average hourly earnings rose to 3.8% year-on-year in December, higher than the previous 3.6%.
From a daily chart perspective, USD/JPY maintains a high-level, slightly bullish trend. The exchange rate continues to trade above major moving averages, indicating a continued bullish bias in the medium term. The recent price rebound and test of the 157.30 area suggests that bullish momentum has not yet fully exhausted. Technically, the daily RSI remains in a neutral-to-strong range, not yet in overbought territory, indicating further upside potential; the MACD fast and slow lines are above the zero line, with the red bars expanding moderately, reflecting continued trend momentum. If the exchange rate can effectively hold above 157.52 (Monday's low), a further test of the previous high of 158.20 and the 158.50 level is possible. On the downside, the 156.98 (9-day moving average) – 156.78 (last Friday's low) area forms a significant support zone. A break below this range could lead to a more pronounced consolidation phase, and a short-term pullback risk should be anticipated.
Today, consider shorting the US dollar around 158.30; Stop loss: 158.50; Target: 157.40, 157.50
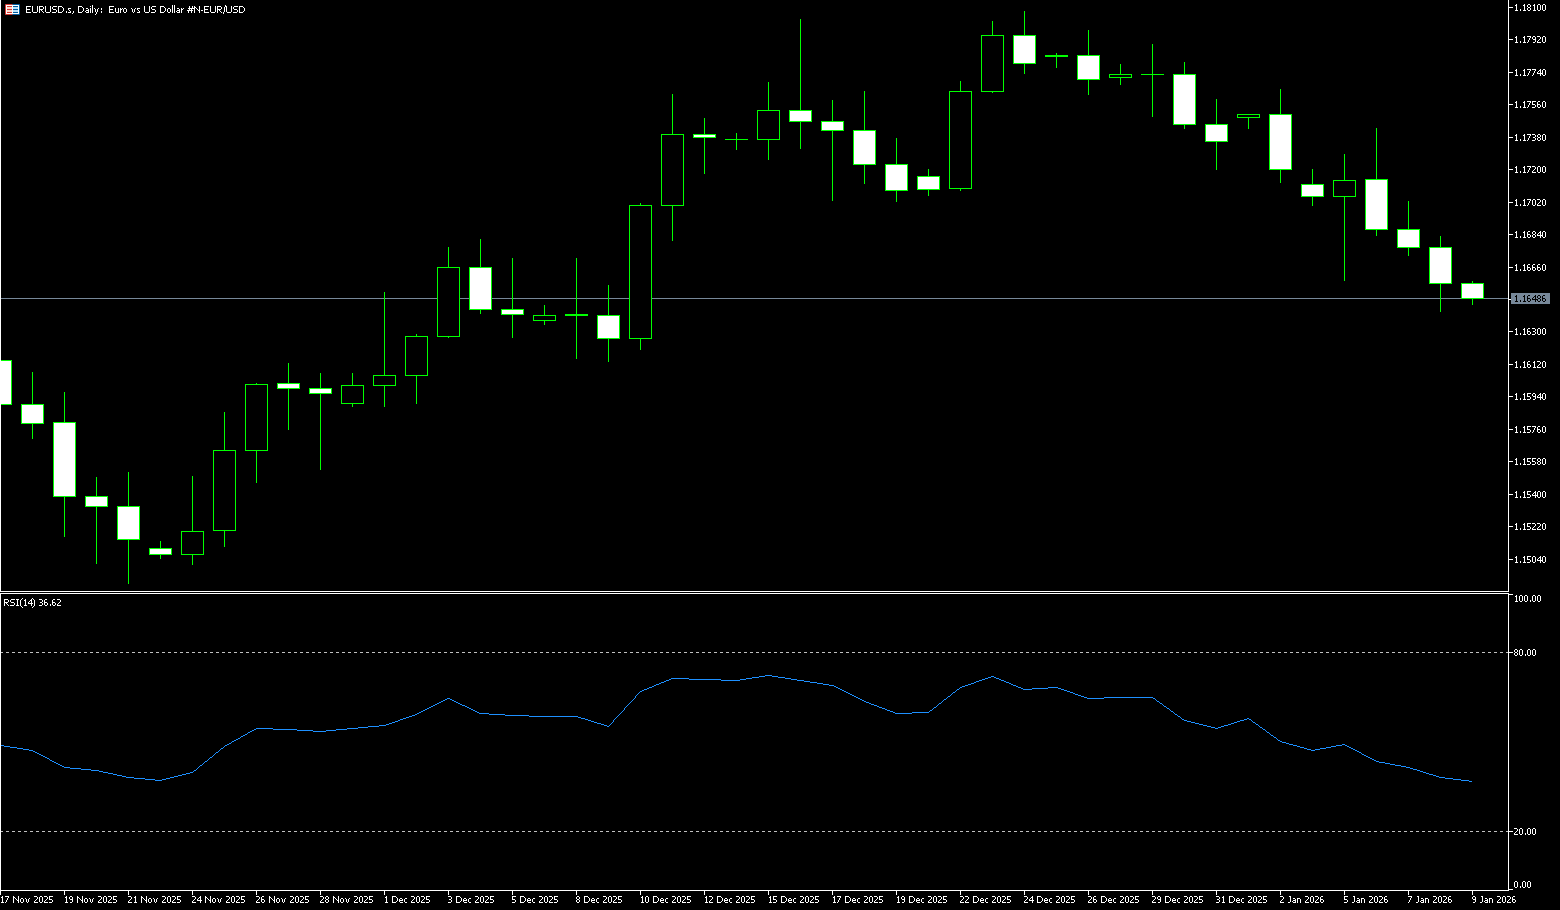
EUR/USD
The euro/dollar pair edged higher after six consecutive days of gains, trading around 1.1670 during Monday's European session. The pair appreciated due to pressure on the dollar from dovish expectations from the Federal Reserve. Friday's weaker-than-expected US job growth suggests the Fed may keep interest rates unchanged later this month. The euro may face additional downward pressure due to slowing inflation in the eurozone, weakening market expectations for further tightening by the European Central Bank. Headline inflation fell to 2.0% in December, a four-month low, in line with the ECB's target, while core inflation fell to 2.3%, slightly below expectations. Bloomberg reported that UK and German-led European countries are discussing increasing their military presence in Greenland to strengthen Arctic security. Germany may propose a joint NATO mission, while British Prime Minister Keir Starmer calls on allies to ramp up efforts in the High North, amid renewed US President Trump's mention of US ownership of Greenland.
Technical charts show the EUR/USD pair is neutral-biased, hovering near the key 40-day simple moving average at 1.1675. The 14-day Relative Strength Index (RSI) on the daily chart shows the bears rebounding to 47 after hitting a low of 36, moving away from oversold territory. The first support level for EUR/USD is 1.1600 (the psychological level). A break below this level would expose the 200-day simple moving average support at 1.1574, the last line of defense for the bulls, after which the pair would turn bearish. Further downside support lies at the 1.1500 level. On the other hand, if buyers retake the psychological level of 1.1700, then 1.1762 (this year's high) will be the next resistance level. Once this level is broken, traders will be watching the resistance level at 1.1800.
Consider going long on the Euro today around 1.1655; Stop loss: 1.1640; Targets: 1.1695, 1.1710
Disclaimer: The information contained herein (1) is proprietary to BCR and/or its content providers; (2) may not be copied or distributed; (3) is not warranted to be accurate, complete or timely; and, (4) does not constitute advice or a recommendation by BCR or its content providers in respect of the investment in financial instruments. Neither BCR or its content providers are responsible for any damages or losses arising from any use of this information. Past performance is no guarantee of future results.
More Coverage


Risk Disclosure:Derivatives are traded over-the-counter on margin, which means they carry a high level of risk and there is a possibility you could lose all of your investment. These products are not suitable for all investors. Please ensure you fully understand the risks and carefully consider your financial situation and trading experience before trading. Seek independent financial advice if necessary before opening an account with BCR.
BCR Co Pty Ltd (Company No. 1975046) is a company incorporated under the laws of the British Virgin Islands, with its registered office at Trident Chambers, Wickham’s Cay 1, Road Town, Tortola, British Virgin Islands, and is licensed and regulated by the British Virgin Islands Financial Services Commission under License No. SIBA/L/19/1122.
Open Bridge Limited (Company No. 16701394) is a company incorporated under the Companies Act 2006 and registered in England and Wales, with its registered address at Kemp House, 160 City Road, London, City Road, London, England, EC1V 2NX. This entity acts solely as a payment processor and does not provide any trading or investment services.

 English
 简体中文
简体中文
 繁體中文
繁體中文
 Bahasa
Melayu
Bahasa
Melayu
 Tiếng
Việt
Tiếng
Việt
 ไทย
ไทย
 日本語
日本語
 한국어
한국어
 ភាសាខ្មែរ
 español