


0
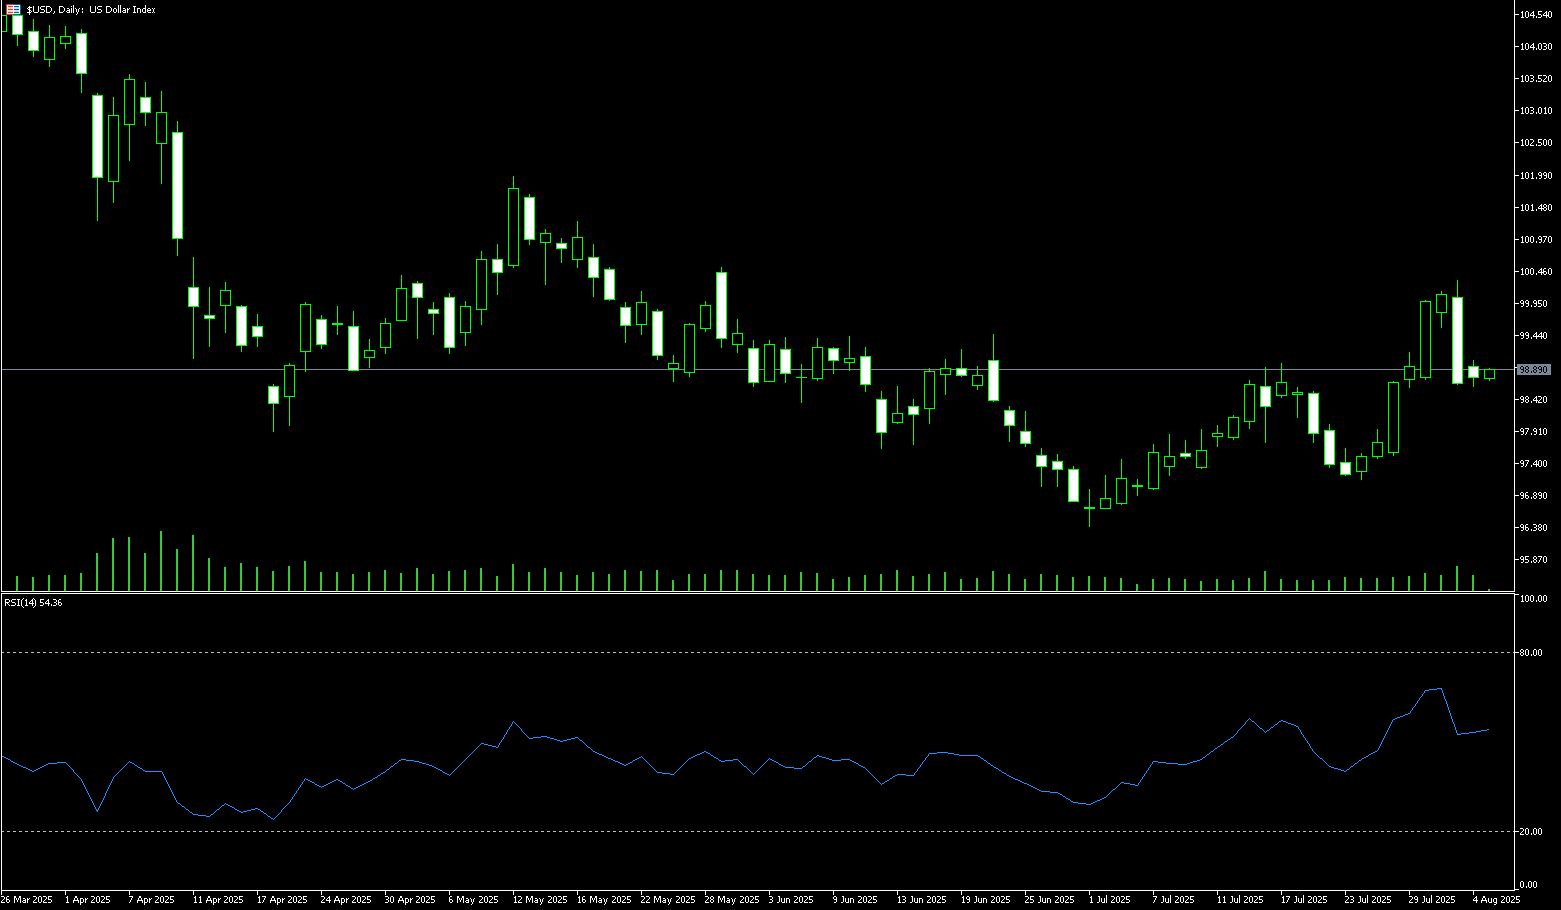
US Dollar Index
The US dollar index temporarily stabilized near 98.70 on Monday, after falling over 1% earlier as traders reassessed the Federal Reserve's policy outlook. Last Friday's jobs report showed nonfarm payrolls rose by just 73,000 in July, well below expectations, with figures for previous months revised down by 258,000, suggesting a further slowdown in the labor market. The market is now almost fully pricing in a September Fed rate cut, with expectations for more than 63 basis points of easing by year-end. Adding to the drama, President Donald Trump fired Bureau of Labor Statistics Director Erica McEntuff last Friday, accusing her of fabricating employment data. Investors also continue to assess the impact of Trump's broad retaliatory tariffs on economic growth and inflation.
Currently, the US dollar index is expected to remain under pressure as it remains below its 100-day simple moving average, currently at 99.73. Technical indicators on the daily chart suggest weakening momentum in the recent uptrend. The 14-day Relative Strength Index (RSI) has fallen to near 53, while the Average Directional Index (ADX) remains around 16, indicating weak trend momentum. A break below 98.30 (the 50-day simple moving average) could pave the way for a move towards the 98.00 round-figure mark. On the upside, initial resistance lies at the 99.00 high (August 1). A clear break above this level could lead to a high of 99.73 (the 100-day simple moving average).
Consider shorting the US Dollar Index at 98.85 today, with a stop-loss at 98.95 and targets at 98.35 or 98.25.
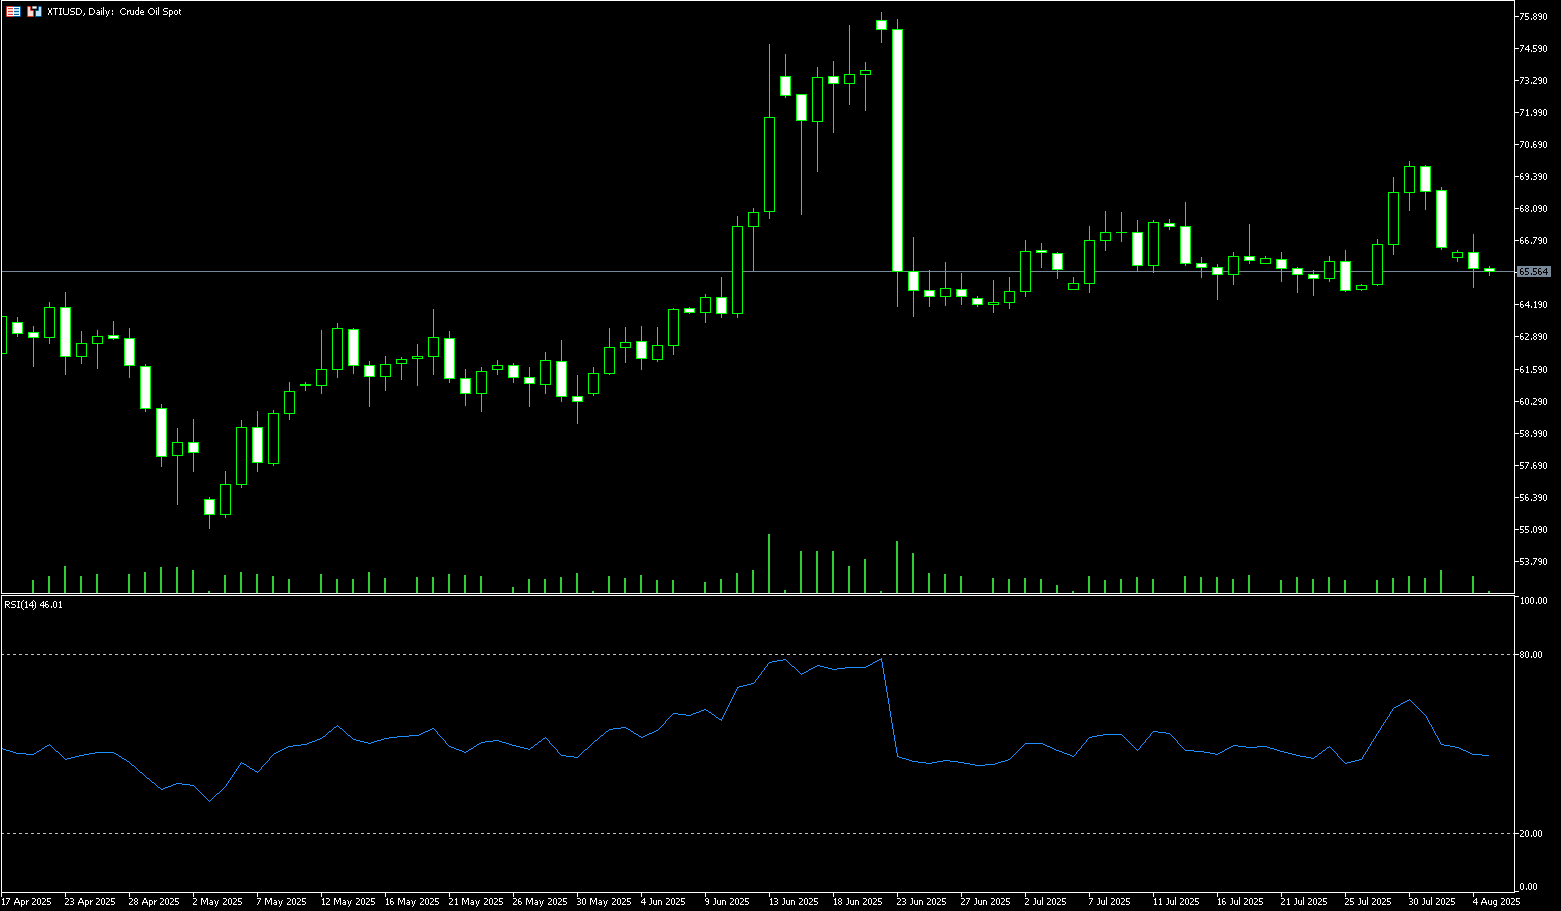
WTI Spot Crude Oil
WTI crude oil futures fell to $65.60 per barrel on Monday as traders digested OPEC+'s decision to increase production and growing geopolitical uncertainty. OPEC+ reached a consensus on Sunday to complete its one-year production recovery plan in September, significantly increasing crude oil production by 548,000 barrels per day (bpd). Oil traders spent much of last week focused on the potential impact of US tariffs, which were set to take effect on most of its trading partners this Friday. Last Thursday, Trump signed an executive order imposing immediate tariffs ranging from 10% to 41% on US imports from dozens of countries and regions, including Canada and India, that failed to reach trade agreements by the August 1st deadline. With few exceptions, the resolution of the trade agreement has been largely satisfactory to the market, which has been the primary driver of bullish oil prices in recent days. Last week, Trump's threat to impose a 100% secondary tariff on buyers of Russian crude oil to pressure Russia to end its war in Ukraine also supported oil prices. This move raised concerns about potential disruptions to oil trade flows and reduced supply.
Technically, the daily chart of US crude oil shows that prices have fallen below the key psychological support level of $70, extending their short-term downward trend. The current K-line has closed negative for two consecutive days, and the MACD fast and slow lines have formed a death cross and diverged, indicating that bearish forces are dominating the market. The 14-day Relative Strength Index (RSI) is below 50, indicating weakness. It is not yet oversold, but momentum is insufficient. If the price continues to remain below the $66.18 (30-day moving average) and $66.00 (round mark), the next support will be tested at $65 and $64.81 (July 28 low). On the rebound, $67.66 (200-day moving average) poses significant resistance. If it holds above this level, it will increase the rebound potential and maintain the bullish structure. There is still room for further upside in the future, and the $69.22 (support plus trend line) and $70.00 (market psychological level) should be closely monitored.
Consider going long on crude oil at 65.40 today. Stop loss: 65.20, target: 67.00, 67.50.
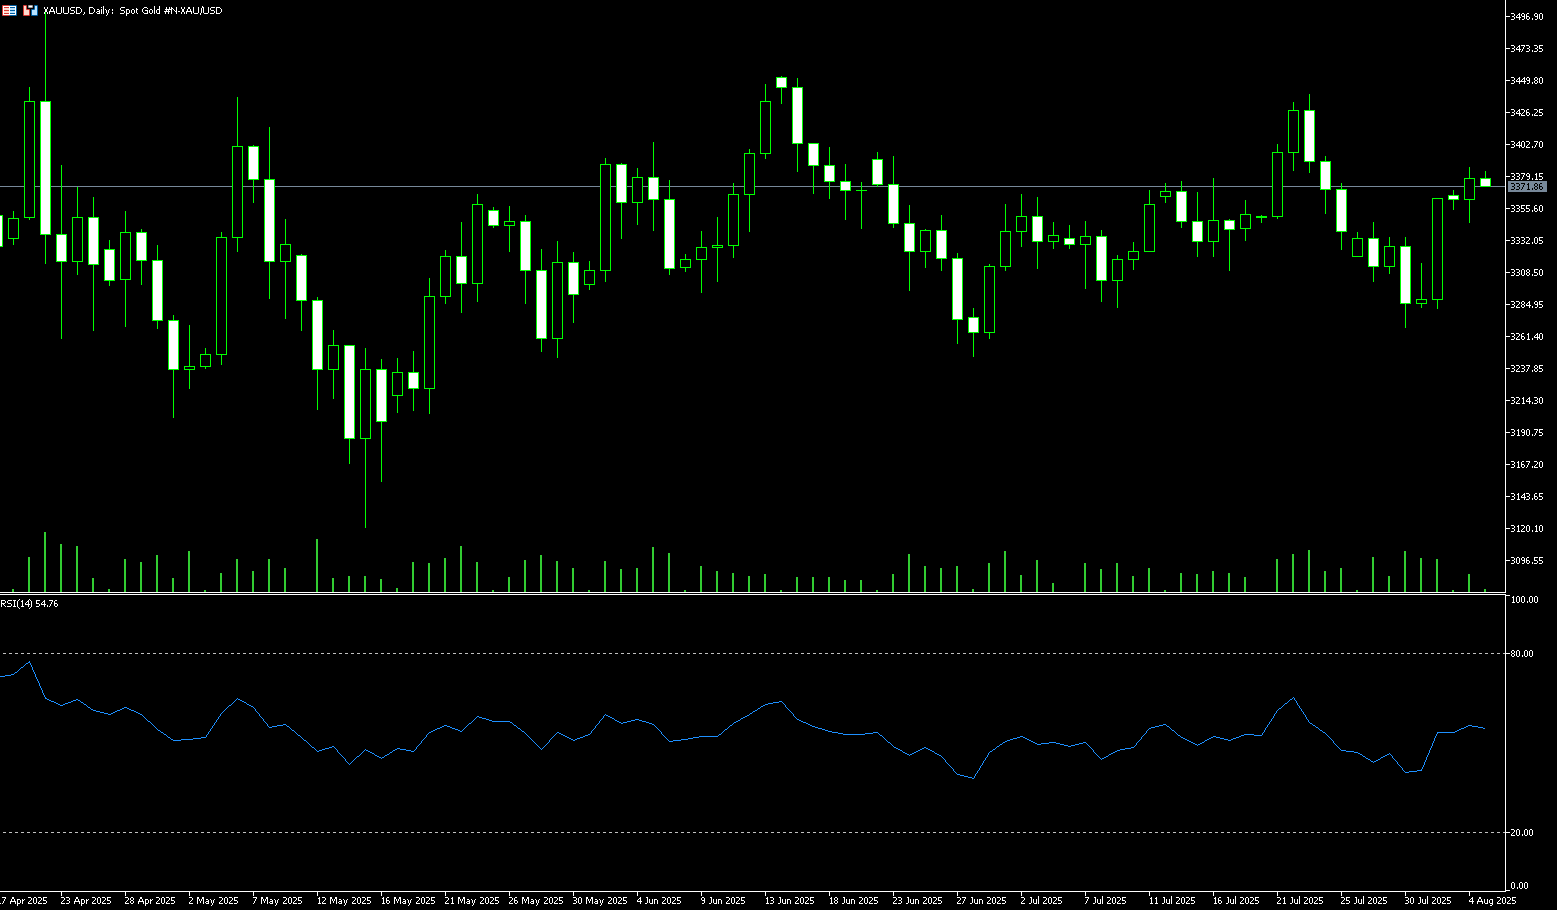
Spot Gold
Gold prices rose slightly on Monday as expectations of a possible Federal Reserve (Fed) rate cut rose following last Friday's weak US non-farm payrolls report. Gold was trading at $3,375. Earlier, it hit $3,385.00. Gold prices rose nearly 2% on Friday, hitting a one-week high. Weaker-than-expected US non-farm payrolls data boosted expectations of a Fed rate cut, while new tariff announcements stimulated safe-haven demand. The weaker-than-expected employment data increased the likelihood of a Fed rate cut later this year. Gold, a non-yielding asset, tends to perform well in a low-interest rate environment. The spot gold market experienced a V-shaped reversal last week, driven by unexpectedly weak US non-farm payroll data and risk aversion triggered by Trump's new tariff policy. Gold prices rose nearly 2% on Friday, reaching a one-week high. Trump's decision to impose tariffs ranging from 10% to 41% on several countries heightened market concerns about global trade tensions, boosting safe-haven demand for gold.
Before the weekend, the non-farm payroll data ignited bullish momentum, sending spot gold prices surging from $3,289.90 to $3,363.10, effectively breaking through the 50-day moving average ($3,342.80) and continuing this week's V-shaped reversal. The current price is above the Bollinger Bands mid-line ($3,342.20), having earlier touched near $3,385. It is currently trading near the July 25 high of $3,373.50, indicating short-term strength, but caution is advised against profit-taking near the upper resistance level. The Bollinger Bands are showing signs of widening, suggesting increased volatility. The MACD indicates weakening bearish momentum, and a golden cross formation is expected to strengthen the market. A break above the upper band would initially target $3,369 (Monday's high); a break would challenge $3,400 (round number), and further up to $3,414.10 (Bollinger Band). A pullback would likely target the intersection of the 50-day moving average at $3,342.80 and the Bollinger Band at $3,342.20 (Bollinger Band). A continued decline would target the 89-day moving average at $3,303.40 and the market level at $3,300.00.
Today, consider a long position in gold at $3,370, with a stop-loss at $3,365 and a target at $3,395. 3,400
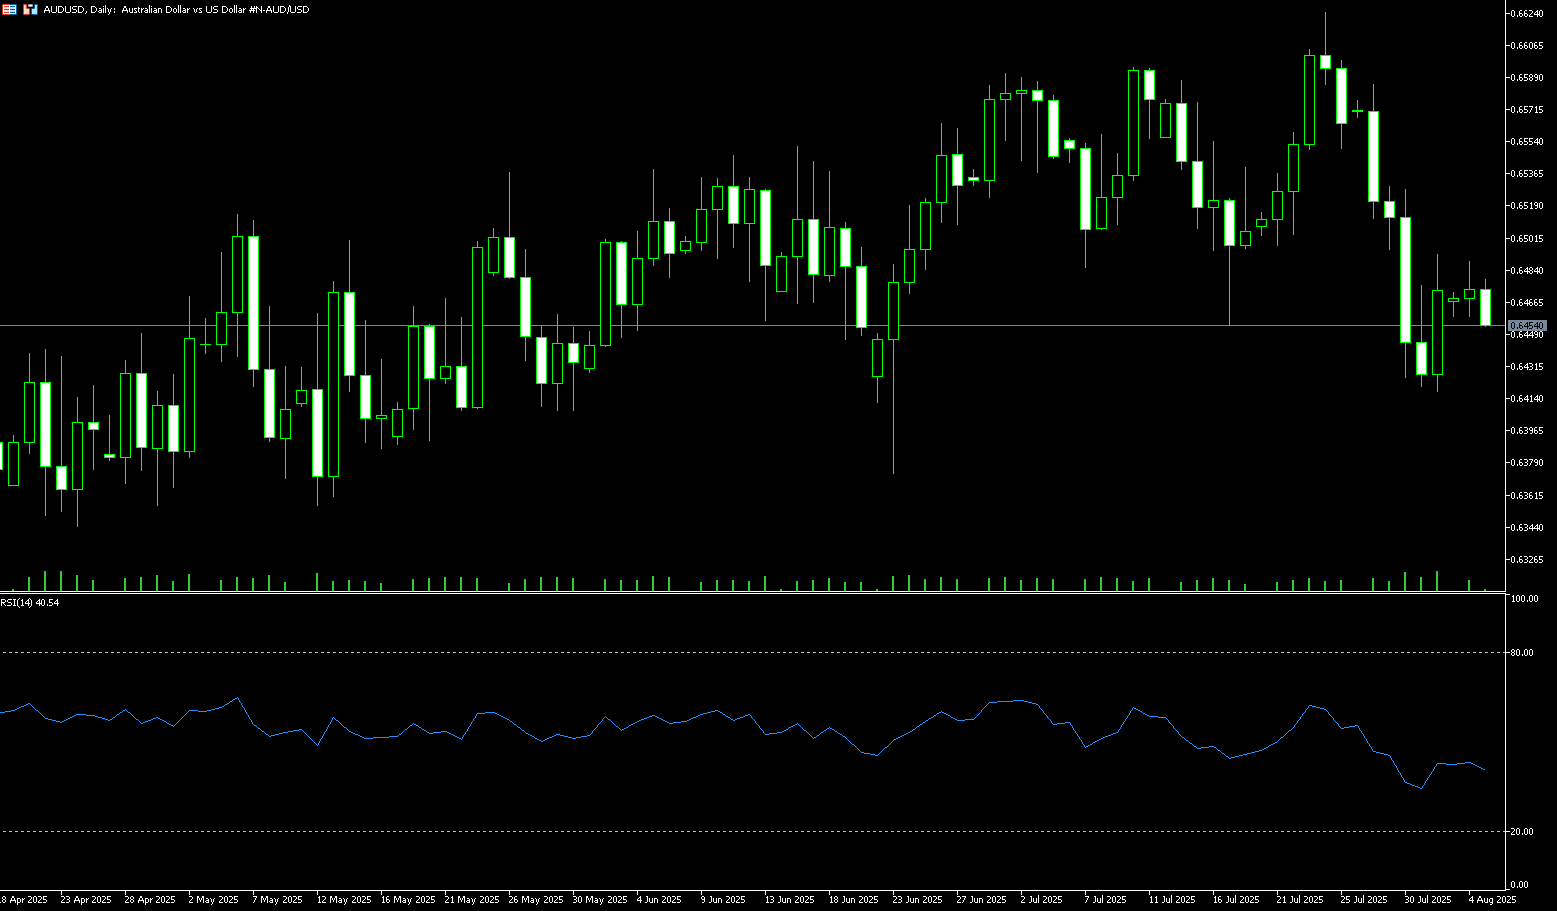
AUD/USD
The Australian dollar appreciated to around $0.6480 on Monday, extending gains from the previous session, as market sentiment remained positive after Australia was spared the latest round of US tariff increases. Last week, President Trump announced a 10% global baseline tariff and levied matching tariffs of up to 41% on countries without trade agreements. Despite earlier warnings of potential increases to 15-20%, Australia avoided harsher penalties, maintaining the 10% baseline rate. The White House attributed the leniency to progress in ongoing trade and security negotiations, noting that Australia is a member of a group of One of the countries nearing a comprehensive agreement with the United States. Domestically, the Melbourne Institute's monthly Australian inflation index rose 0.9% in July 2025, the largest monthly increase since December 2023 and up from a 0.1% increase the previous month.
AUD/USD traded around 0.6470 on Monday. Technical analysis on the daily chart suggests a bearish bias, with the 14-day relative strength index (RSI) remaining below the 50-day level. The pair is also trading below its 50-day simple moving average at 0.6511, indicating that the short-term bias remains bearish. On the downside, AUD/USD could reach the lower Bollinger Bands level on the daily chart at 0.6430. The pair finds major support at 0.6420, the two-month low recorded on August 1st. A break below these levels could exert downward pressure on the pair, potentially testing the three-month low of 0.6372 recorded on June 23rd. On the one hand, AUD/USD may face initial resistance at the 0.6500 round-figure mark, aligned with the 50-day simple moving average at 0.6511. A break above these levels could strengthen short- and medium-term price momentum and support the pair's exploration of the 0.6576 level (the 76.4% Fibonacci retracement level from 0.6625 to 0.6420).
Consider a long AUD at 0.6455 today, with a stop-loss at 0.6440 and a target at 0.6520. 0.6530
GBP/USD
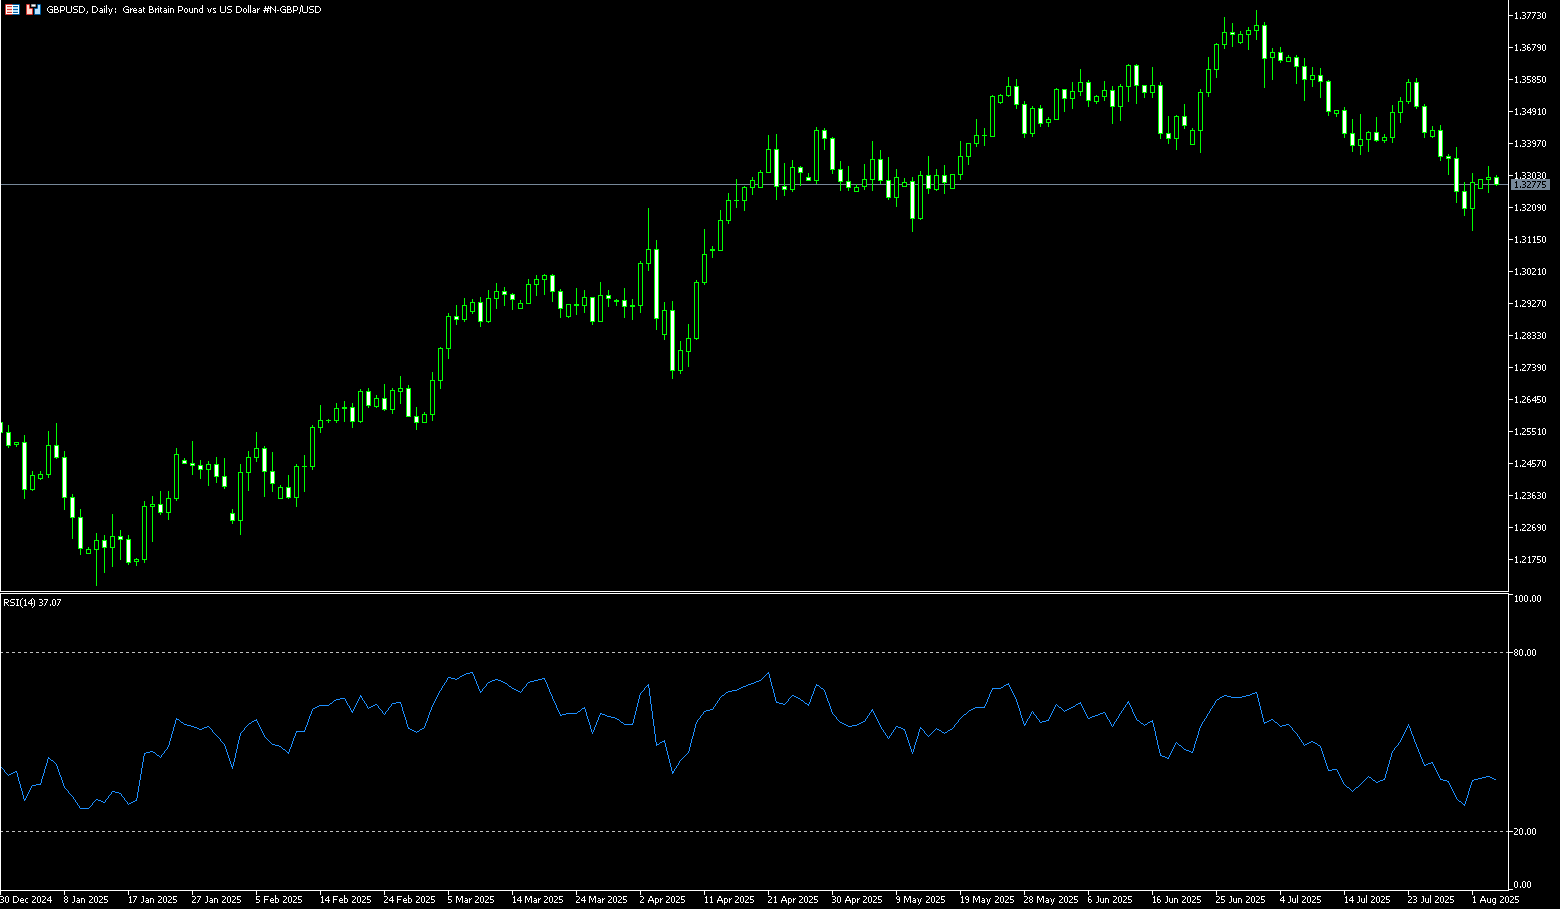
After surging over 0.5% the previous day, GBP/USD traded sideways around 1.3280 on Monday. Bearish sentiment persists. Sterling rebounded from an 11-week low of $1.3210 to $1.3330 on July 31st, supported by a weaker-than-expected US jobs report that signaled a cooling labor market. However, the pound slumped 3.8% in July, its worst monthly performance since September 2022, as concerns about the UK's economic outlook and fiscal health continued to weigh on sentiment. Investors are increasingly pessimistic about the UK's growth outlook, anticipating a possible 25 basis point interest rate cut by the Bank of England in August and possibly another by the end of the year to support growth. Historically, the British pound reached an all-time high of 2.86 in December 1957.
Technical analysis on the daily chart suggests that GBP/USD is moving downward within a descending channel pattern. The 14-day relative strength index (RSI) remains below 40, reinforcing the bearish bias. However, GBP/USD is trading below its 9-day simple moving average of 1.3359, suggesting weakening short-term price momentum. On the downside, GBP/USD could find major support at 1.3200 (round number) and 1.3199 (Bollinger Band), followed by the four-month low of 1.3139 set on May 12. On the other hand, GBP/USD could target initial support at 1.3300 (a psychological level), followed by the 9-day simple moving average of 1.3359. A break above these levels would improve short- and medium-term price momentum and support a test of 1.3400.
Consider a long position on GBP at 1.3273 today, with a stop-loss of: 1.3260, Target: 1.3320, 1.3330
USD/JPY
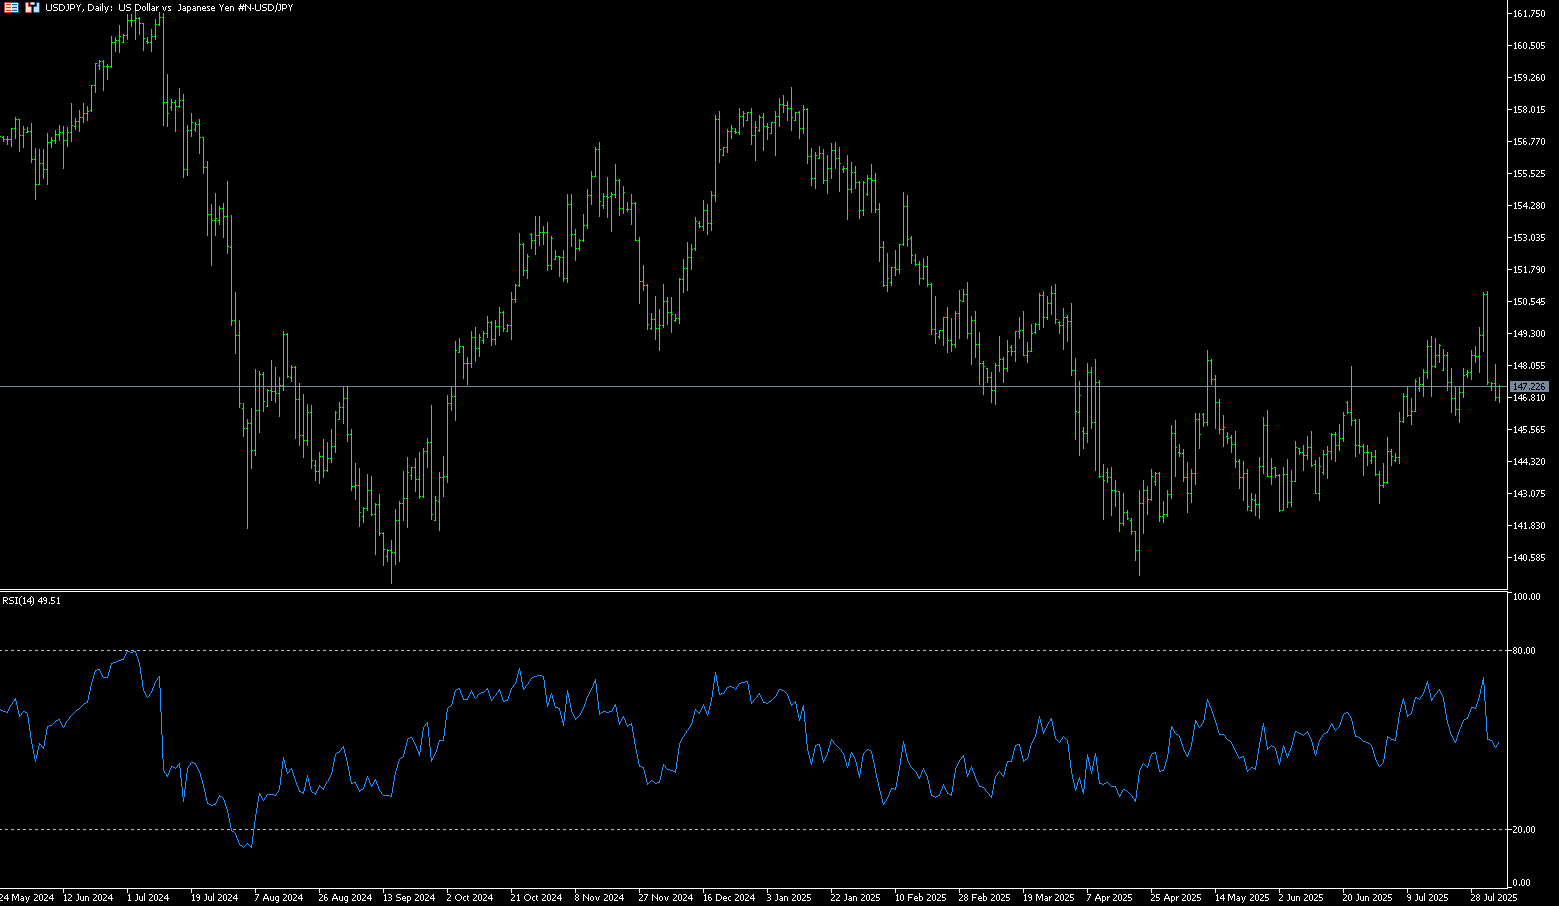
The yen appreciated to 146.85 per dollar on Monday after a rally that saw investors reassess the Federal Reserve's policy trajectory. Although a weak US jobs report last Friday bolstered market expectations of an imminent rate cut, Fed officials maintained a cautious stance, citing inflation risks associated with President Trump's broad tariff policies. The dollar regained some support amid the shift in sentiment, putting pressure on the yen. Meanwhile, markets awaited the minutes of the Bank of Japan's latest policy meeting for clues on the timing of a potential rate hike. The Bank of Japan held interest rates steady last week but raised its inflation forecasts, noting growing uncertainty from global trade tensions.
Although oscillators on the daily chart have retreated from their highs, USD/JPY remains in positive territory at 51.86. This, in turn, has helped The pair has found some support near the 146.31 (34-day moving average), which should serve as a pivotal point. A sustained break below this support level would pave the way for a decline towards the 146.00 level, leading to the July 24 swing low of 145.85, followed by confluence with the 100-day moving average at 145.72. On the other hand, any subsequent rebound is more likely to face immediate resistance near the 148.00 level, a breakout of which could see USD/JPY climb to the 148.60 level. A subsequent rise could push the spot price towards the 149.00 level. A sustained strong break above the latter would tilt the bias in favor of bullish traders and allow the pair to recapture the psychological 150.00 level, potentially creating some intermediate resistance around the 149.50 area or the all-important 200-day simple moving average at 149.53.
Consider shorting the USD at 147.30 today. Stop loss: 147.50 Target: 146.20 146.00
EUR/USD
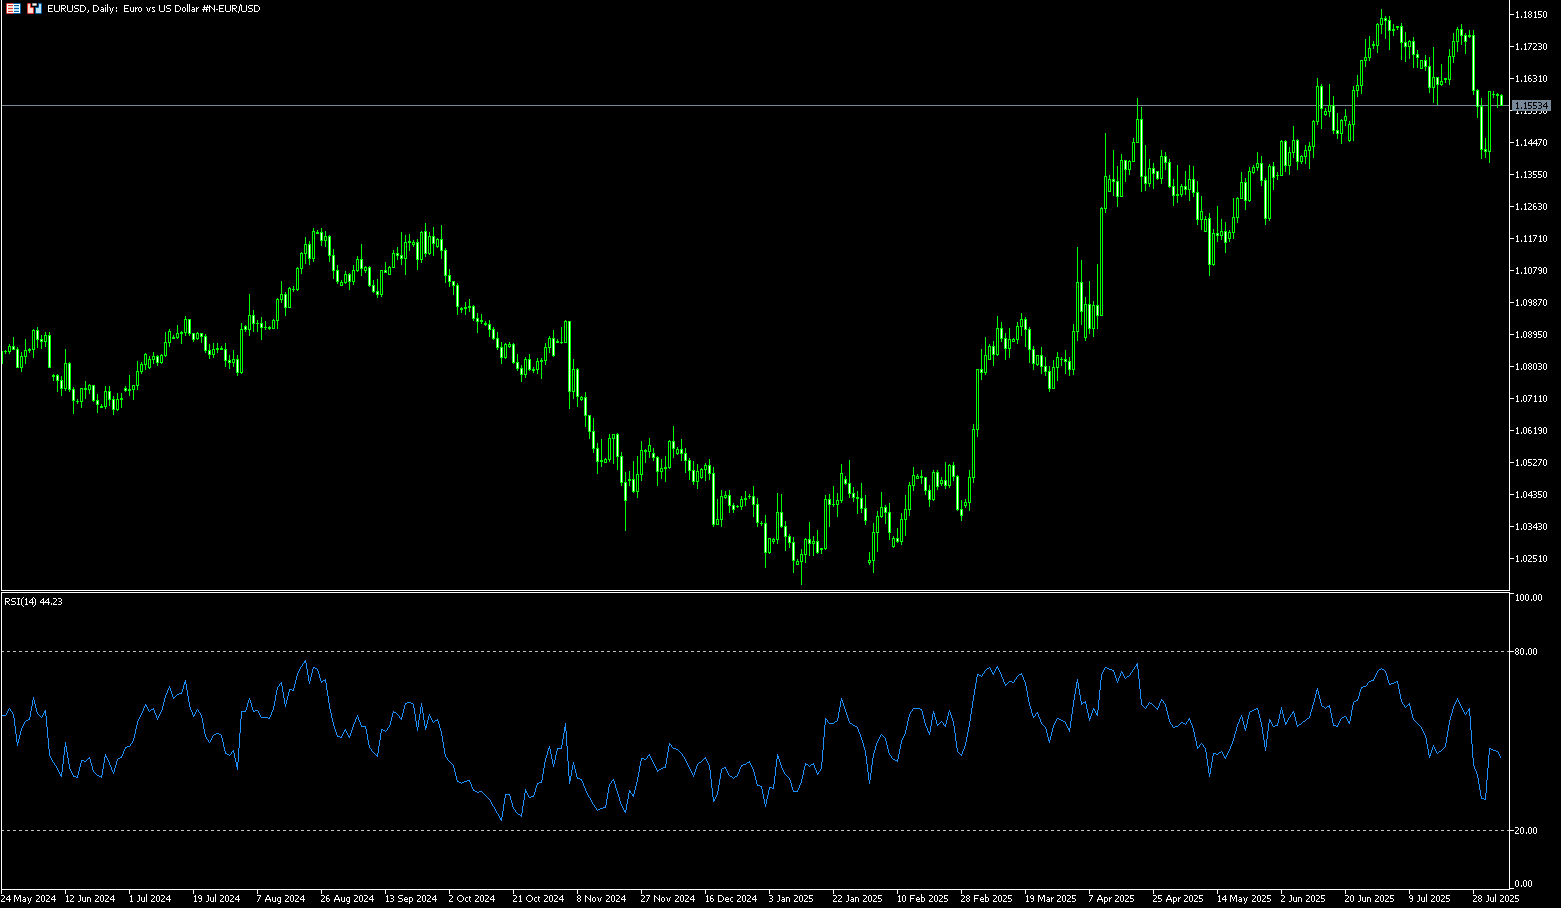
The EUR/USD pair depreciated after rising approximately 1.5% in the previous session, trading around 1.1570 in Asian trading on Monday. The pair weakened as the US dollar recovered from the previous session's losses. However, the dollar may come under pressure following Friday's weaker-than-expected US jobs report, which prompted market expectations of two Federal Reserve rate cuts. With the European Central Bank expected to delay rate cuts, the euro is expected to remain strong, potentially limiting EUR/USD's downside. This is because inflation is expected to be higher than the ECB's short-term forecasts. Recent data indicate that eurozone consumer inflation remained at 2. 0%, slightly higher than the market expectation of 1.9%. Investors are also weighing the impact of newly implemented US tariffs, including a 15% tariff on EU exports to the US.
The daily chart suggests that EUR/USD could resume its uptrend, but faces key resistance at the 1.1600 level and the 14-day simple moving average of 1.1620. The 14-day relative strength index (RSI) has rebounded from near oversold territory, approaching the 50 level. A break above 50 would confirm that buyers are in control of the market. If EUR/USD breaks above the 14-day simple moving average of 1.1620, it could rally to the 34-day simple moving average of 1.1353. and 1.1700 (round level). On the other hand, if the 65-day simple moving average of 1.1507 is broken, the 1.1500 round level will follow. The next area of focus will be the 85-day simple moving average at 1.1456.
Today, consider going long on the euro at 1.1560, with a stop-loss at 1.1550 and targets at 1.1620 and 1.1630.
Disclaimer: The information contained herein (1) is proprietary to BCR and/or its content providers; (2) may not be copied or distributed; (3) is not warranted to be accurate, complete or timely; and, (4) does not constitute advice or a recommendation by BCR or its content providers in respect of the investment in financial instruments. Neither BCR or its content providers are responsible for any damages or losses arising from any use of this information. Past performance is no guarantee of future results.
More Coverage


Risk Disclosure:Derivatives are traded over-the-counter on margin, which means they carry a high level of risk and there is a possibility you could lose all of your investment. These products are not suitable for all investors. Please ensure you fully understand the risks and carefully consider your financial situation and trading experience before trading. Seek independent financial advice if necessary before opening an account with BCR.